ECO AI SQ SQLShark Part 9 — Future Improvements: Taking My Market Copilot From “Working” to “Worth Shipping” By this point in the series, the system is doing the thing I originally wanted: it turns noisy market + news inputs into something I can…
TCH SQ SQLShark How I built my own private cloud on Ubuntu with Nextcloud I’ve been meaning to fix my “personal cloud” mess for years.
AI SQ SQLShark Part 6 — The Telegram Analyst Copilot In Part 5, we built the analyst score engine: a scheduled workflow that crunches 7/30-day features, applies deterministic heuristics, and…
AI ECO SQ SQLShark Part 7 — Postgres Data Model for a Near-Real-Time Market Copilot (n8n schema, idempotent ingestion, agent-friendly views, and materialized views for fast reporting)
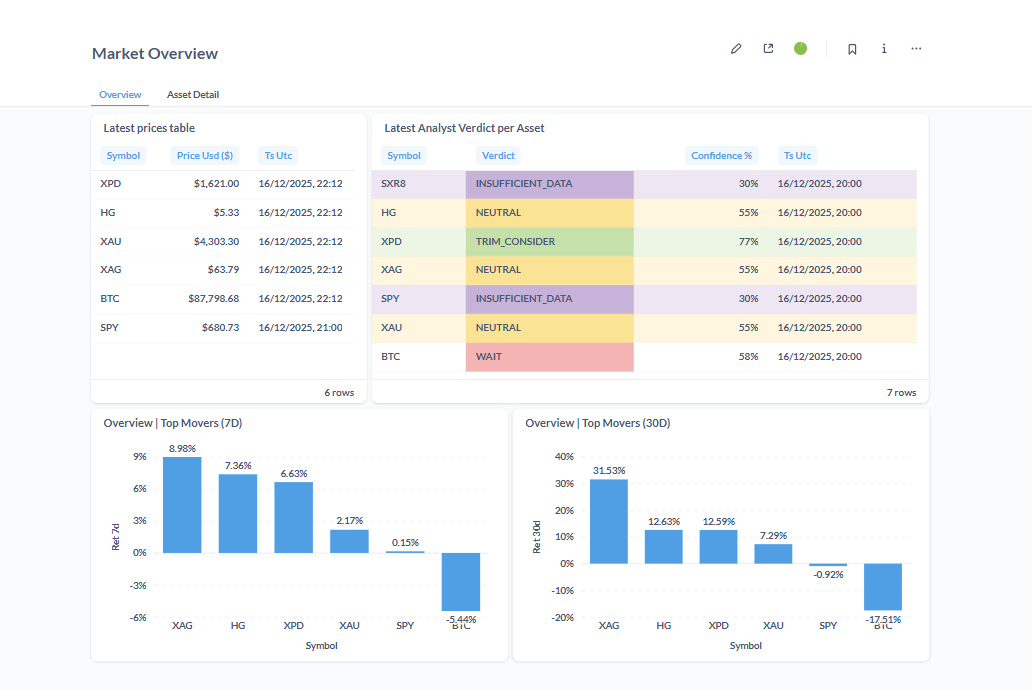
ECO MDA SPT SQ SQLShark Part 8 — Building a Near-Real-Time Market Dashboard in Metabase By the time you have a “feeds → signals” pipeline running, the next step is obvious: you want a place where you can see what’s happening…
TCH SPT SQ SQLShark Configuring my private Nextcloud running on Ubuntu Once Nextcloud is running, the temptation is to start uploading files and call it a day. I did that… and then quickly realised the admin…
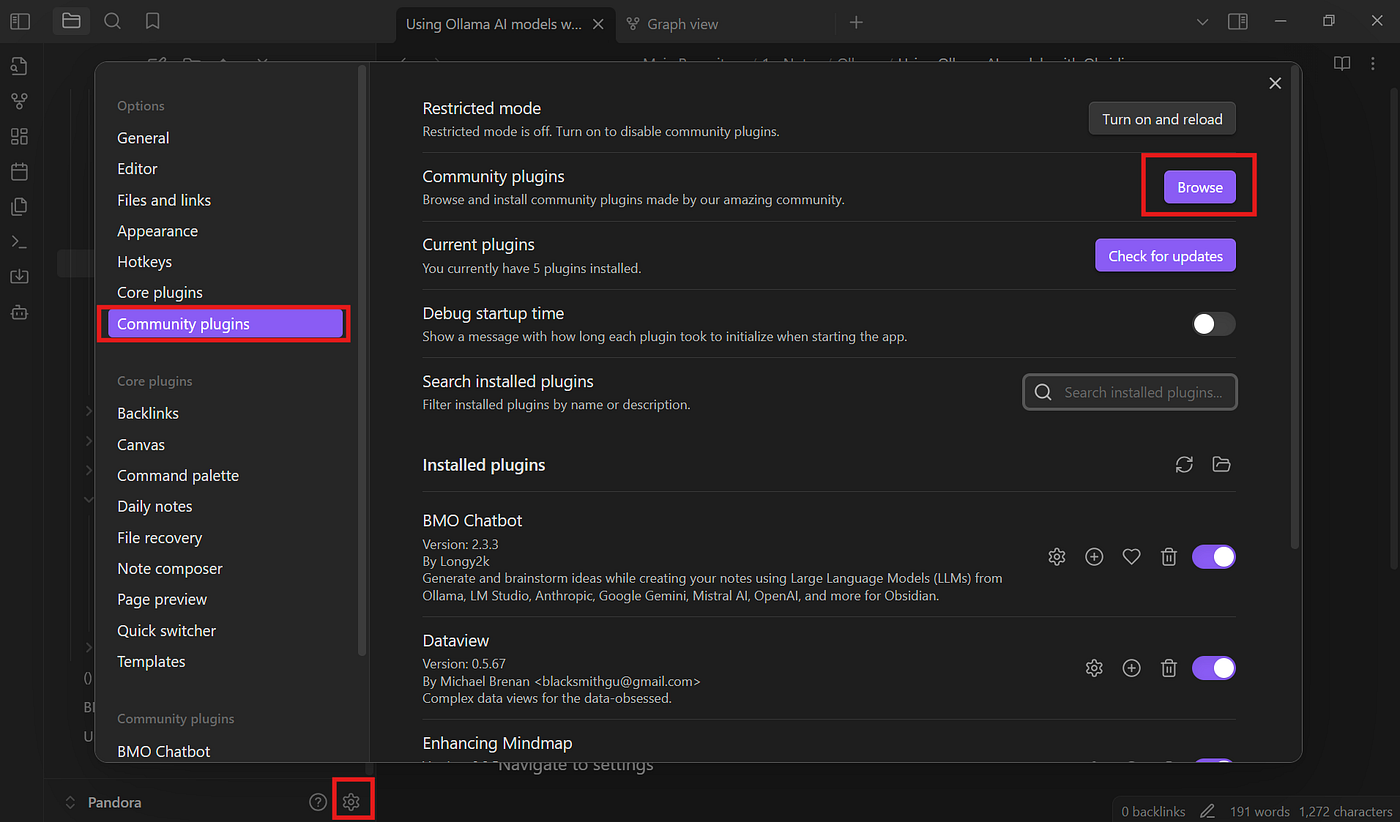
AI LIF SPT SQ SQLShark Maximising Productivity and Creativity: Leveraging Ollama AI Models with Obsidian In my last couple of articles, we took a look at running AI models locally and getting cosy with Obsidian. Now, it’s time to dive deeper…
TCH SQ SQLShark Article 1: How to Set Up Prometheus and Grafana on Ubuntu, and Why I’m Using Them for My Home… If you run a home server seriously, you eventually need answers to very practical questions: which service is using CPU, which mount point…
TCH MDA SQ SQLShark Article 2: Building an Ubuntu Host Overview Dashboard in Grafana Once the stack is up, the first dashboard I recommend building is the host view. The reason is simple: before you look at containers or…
MDA TCH SQ SQLShark Article 3: Building the Disk & Network Dashboard in Grafana The host overview tells you whether the machine is healthy in general. The disk and network dashboard tells you where slow problems are…
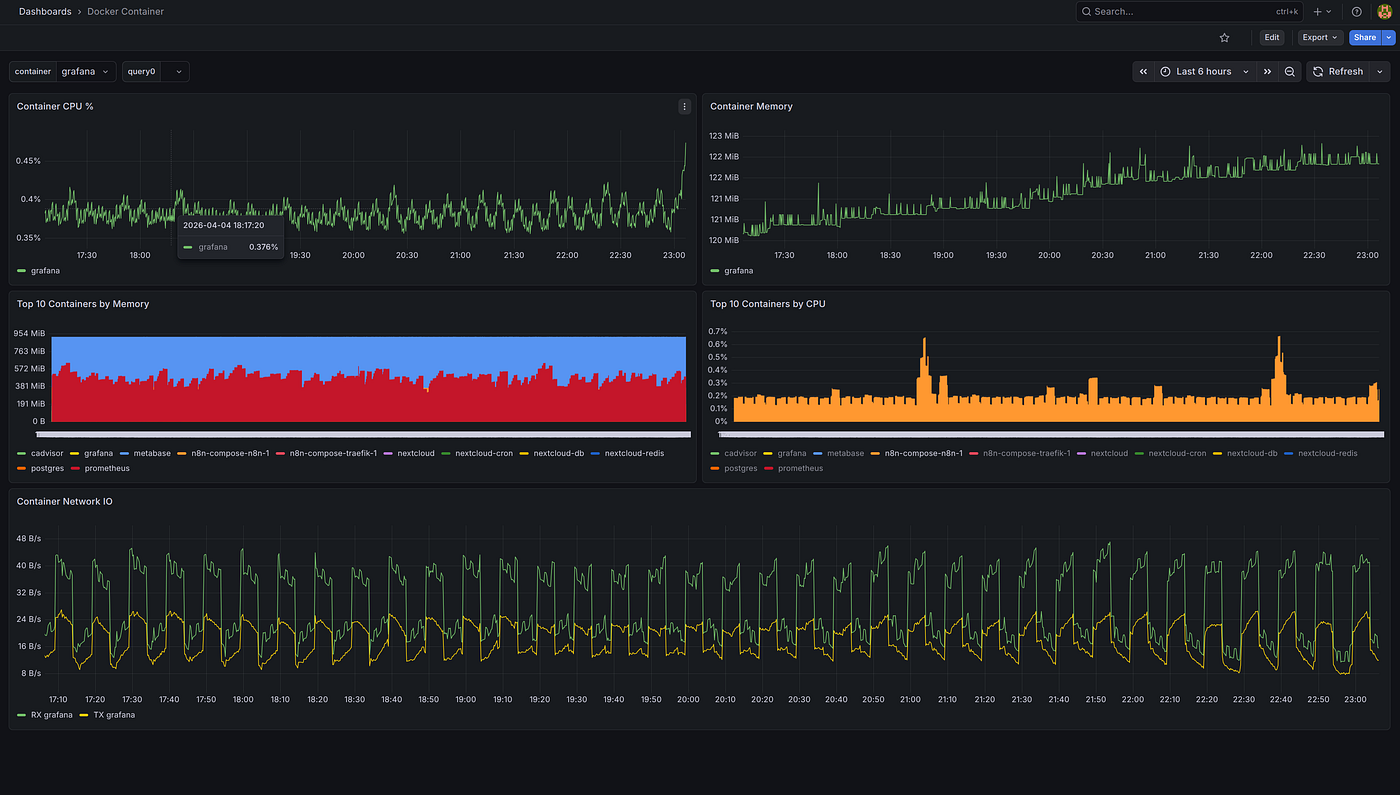
TCH MDA SQ SQLShark Article 4: Building the Docker Containers Dashboard in Grafana Once you can see the host and the network, the final step is to make Docker itself observable. This is where cAdvisor becomes valuable…