Implementing Drilldown Charts with CanvasJS
Data visualization becomes truly powerful when users can interact with charts to explore deeper layers of information. Drilldown charts…
Implementing Drilldown Charts with CanvasJS
Data visualization becomes truly powerful when users can interact with charts to explore deeper layers of information. Drilldown charts allow users to click on high-level data points to reveal more detailed, related data — creating an intuitive exploration experience. In this article, we’ll explore how to implement drilldown functionality using CanvasJS Charts.
What Is a Drilldown Chart?
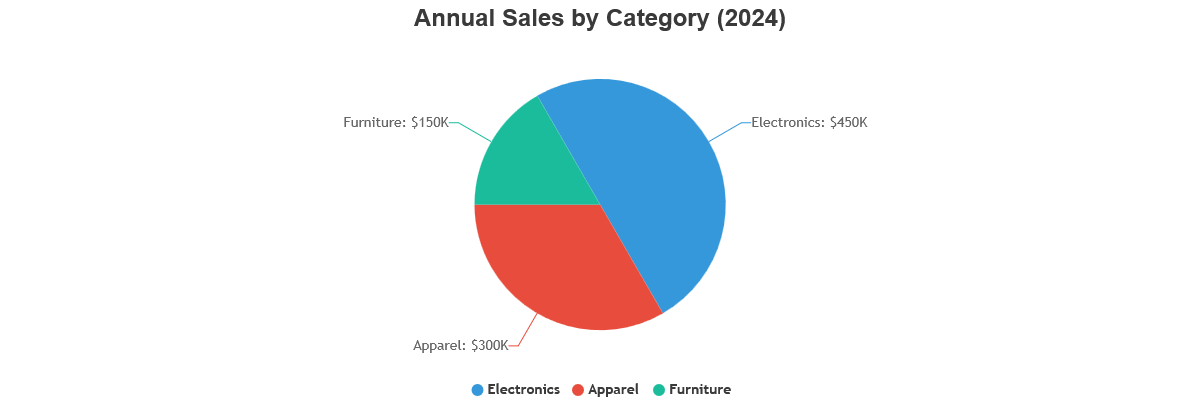
A drilldown chart starts by displaying summarized data, like total sales by category. When a user clicks on a category, the chart transitions to show a more detailed breakdown — such as monthly sales within that category. This interactive experience helps users navigate from broad overviews to specific details without cluttering the initial visualization.
Implementation Approach
While CanvasJS doesn’t have built-in breadcrumb navigation for drilldowns, we can create a more flexible solution by separating our navigation controls from the chart itself. This approach gives us greater control over the user experience.
1. Set Up Your HTML Structure
<h1 class="chart-title">Sales Data Drilldown Chart</h1>
<div class="navigation-container">
   <div class="breadcrumb" id="breadcrumb">Home</div>
   <button class="back-button" id="backButton">← Return to Overview</button>
</div>
<div class="chart-subtitle" id="chartSubtitle">Click on segments to view monthly breakdown</div>
<div id="chartContainer"></div>
2. Create the Navigation System
The navigation system consists of:
- A breadcrumb trail showing the current drilldown path
- A back button for moving up one level
- A subtitle that provides context about the current view
let navigationPath = [];
const breadcrumbElement = document.getElementById('breadcrumb');
let backButton = document.getElementById('backButton');
const chartSubtitle = document.getElementById('chartSubtitle');
function setupBackButtonListener() {
   const newBackButton = backButton.cloneNode(true);
   backButton.parentNode.replaceChild(newBackButton, backButton);
   backButton = newBackButton;
   backButton.addEventListener('click', function () {
      if (navigationPath.length > 0) {
         navigationPath.pop();
         if (navigationPath.length === 0) {
            renderMainChart();
         } else {
            const previous = navigationPath[navigationPath.length - 1];
            const tempPath = [...navigationPath];
            navigationPath.pop();
            drilldownHandler(previous.id, previous.name, previous.color);
         }
      }
   });
}
3. Update Navigation UI
We need a function to keep the navigation UI in sync with the current state:
function updateNavigation() {
   setupBackButtonListener();
   let breadcrumbHTML = '<span data-level="home">Home</span>';
   navigationPath.forEach((item, index) => {
      breadcrumbHTML += ' > <span data-level="' + index + '">' + item.name + '</span>';
   });
   breadcrumbElement.innerHTML = breadcrumbHTML;
   backButton.style.display = navigationPath.length > 0 ? 'block' : 'none';
   if (navigationPath.length === 0) {
      chartSubtitle.textContent = 'Click on segments to view monthly breakdown';
   } else if (navigationPath.length === 1) {
      chartSubtitle.textContent = 'Monthly sales breakdown for ' + navigationPath[0].name;
   } else {
      chartSubtitle.textContent = 'Daily sales breakdown for ' + navigationPath[1].name;
   }
   const breadcrumbItems = breadcrumbElement.querySelectorAll('span');
   breadcrumbItems.forEach(item => {
      const newItem = item.cloneNode(true);
      item.parentNode.replaceChild(newItem, item);
      newItem.addEventListener('click', function () {
         const level = this.getAttribute('data-level');
         if (level === 'home') {
            navigationPath = [];
            renderMainChart();
         } else {
            const levelIndex = parseInt(level);
            navigationPath = navigationPath.slice(0, levelIndex + 1);
            const current = navigationPath[levelIndex];
            drilldownHandler(current.id, current.name, current.color);
         }
      });
   });
}
4. Initialize the Main Chart
Your main chart represents your top-level data:
function renderMainChart() {
   navigationPath = [];
   updateNavigation();
   const mainChart = new CanvasJS.Chart("chartContainer", {
      animationEnabled: true,
      exportEnabled: true,
      theme: "light2",
      title: {
         text: "Annual Sales by Category (2024)",
         fontFamily: "Arial",
         fontSize: 24
      },
      legend: {
         cursor: "pointer",
         itemclick: function (e) {
            if (typeof e.dataSeries.visible === "undefined" || e.dataSeries.visible) {
               e.dataSeries.visible = false;
            } else {
               e.dataSeries.visible = true;
            }
            e.chart.render();
         }
      },
      data: [{
         type: "pie",
         showInLegend: true,
         toolTipContent: "<b>{name}</b><br>Sales: ${y}K",
         indexLabel: "{name}: ${y}K",
         cursor: "pointer",
         click: function (e) {
            drilldownHandler(e.dataPoint.drilldownId, e.dataPoint.name, e.dataPoint.color);
         },
         dataPoints: [
            { y: 450, name: "Electronics", drilldownId: "electronics",  color: "#4661EE" },
            { y: 300, name: "Apparel", drilldownId: "apparel", color: "#EC5657" },
            { y: 150, name: "Furniture", drilldownId: "furniture", color: "#1BCDD1" }
         ]
      }]
   });
   mainChart.render();
   currentChart = mainChart;
}
5. Create Your Drilldown Handler
The drilldown handler manages state transitions between chart levels:
function drilldownHandler(drilldownId, categoryName, baseColor) {
   const existingIndex = navigationPath.findIndex(item => item.id === drilldownId);
   if (existingIndex >= 0) {
      navigationPath = navigationPath.slice(0, existingIndex + 1);
   } else {
      navigationPath.push({ id: drilldownId, name: categoryName, color: baseColor });
   }
   updateNavigation();
   const drilldownData = getDrilldownData(drilldownId);
   const detailChart = new CanvasJS.Chart("chartContainer", {
      animationEnabled: true,
      animationDuration: 1000,
      exportEnabled: true,
      theme: "light2",
      title: {
         text: `Monthly ${categoryName} Sales (2024)`,
         fontFamily: "Arial",
         fontSize: 24
      },
      axisX: {
         title: "Month",
         titleFontFamily: "Arial",
         labelFontFamily: "Arial"
      },
      axisY: {
         title: "Sales (in $K)",
         titleFontFamily: "Arial",
         labelFontFamily: "Arial",
         includeZero: true,
         prefix: "$",
         suffix: "K"
      },
      data: [{
         type: "column",
         color: baseColor,
         yValueFormatString: "$#,###K",
         dataPoints: drilldownData,
         click: function (e) {
            if (drilldownId === "electronics" && e.dataPoint.productId) {
               drilldownToProduct(e.dataPoint.productId, e.dataPoint.label, baseColor);
            }
         },
         cursor: function (e) {
            return drilldownId === "electronics" ? "pointer" : "default";
         }
      }]
   });
   detailChart.render();
   currentChart = detailChart;
}
6. Prepare Your Drilldown Data
You’ll need detailed data for each category:
function getDrilldownData(drilldownId) {
   if (dataCache[drilldownId]) {
      return dataCache[drilldownId];
   }
   const datasets = {
      "electronics": [
         { label: "Jan", y: 35, productId: "electronics-jan" },
         { label: "Feb", y: 40, productId: "electronics-feb" },
         // Additional months...
      ],
      "apparel": [
         { label: "Jan", y: 25 },
         { label: "Feb", y: 28 },
         // Additional months...
      ],
      // Additional categories...
   };
   // Cache the result
   dataCache[drilldownId] = datasets[drilldownId] || [];
   return dataCache[drilldownId];
}
Enhancing the User Experience
Enhance user experience by having a separate interactive navigation elements. Also, handle multiple drilldown levels with proper path tracking management.
[embed]
Creating drilldown charts with CanvasJS becomes much more powerful when you have separate navigation — breadcrumbs. This modular approach gives you greater flexibility to customize the user experience, handle multiple drilldown levels, and manage state transitions more effectively.
메타데이터
- post_id
- 0ee2e2df8e69
- slug
- implementing-drilldown-charts-with-canvasjs-0ee2e2df8e69
- url
- https://medium.com/@vishwas-r/implementing-drilldown-charts-with-canvasjs-0ee2e2df8e69
- canonical_url
- https://medium.com/@vishwas-r/implementing-drilldown-charts-with-canvasjs-0ee2e2df8e69
- author_url
- https://medium.com/@vishwas-r
- status
- ok
- fetched_at
- 2026-06-24 04:09:36