Building a Centralized Alerting Framework for Data Quality Monitoring and Incident Management
Building a Centralized Alerting Framework for Data Quality Monitoring and Incident Management
Before We Knew Better
As our data platform grew, so did the number of pipelines, scheduled tasks, and data quality checks running every day.
While Snowflake provided a reliable platform for storing and processing data, operational monitoring was fragmented across multiple systems. Data quality failures were often discovered only after downstream reports showed inconsistencies. Pipeline issues sometimes required engineers to manually inspect logs, query tables, and trace execution paths before identifying the root cause.
The challenge wasn’t detecting failures — we already had mechanisms to identify them.
The real challenge was ensuring the right people were notified quickly, with enough context to take action.
Questions during on-call incidents were often similar:
- Did the pipeline fail or was data simply delayed?
- Which validation check triggered the alert?
- Who should respond to the issue?
- How can we ensure critical failures don’t get missed overnight?
As the number of pipelines increased, manually monitoring these failures became increasingly difficult.
We needed a centralized alerting framework.
What We Actually Needed
Our goal wasn’t simply to send more notifications.
We wanted a system that could:
- Detect data quality issues automatically
- Notify engineers through channels they already use
- Escalate critical incidents to on-call responders
- Provide actionable context instead of generic failure messages
- Scale across multiple pipelines and monitoring use cases
Most importantly, we wanted to keep the solution as close to the data platform as possible.
Since our monitoring logic already lived in Snowflake, it made sense for the alerting framework to live there as well.
The Architecture We Chose
To address these challenges, we designed a centralized notification and incident management framework using Snowflake’s native Alerting capabilities, combined with Email, Slack, and Splunk On-Call integrations.
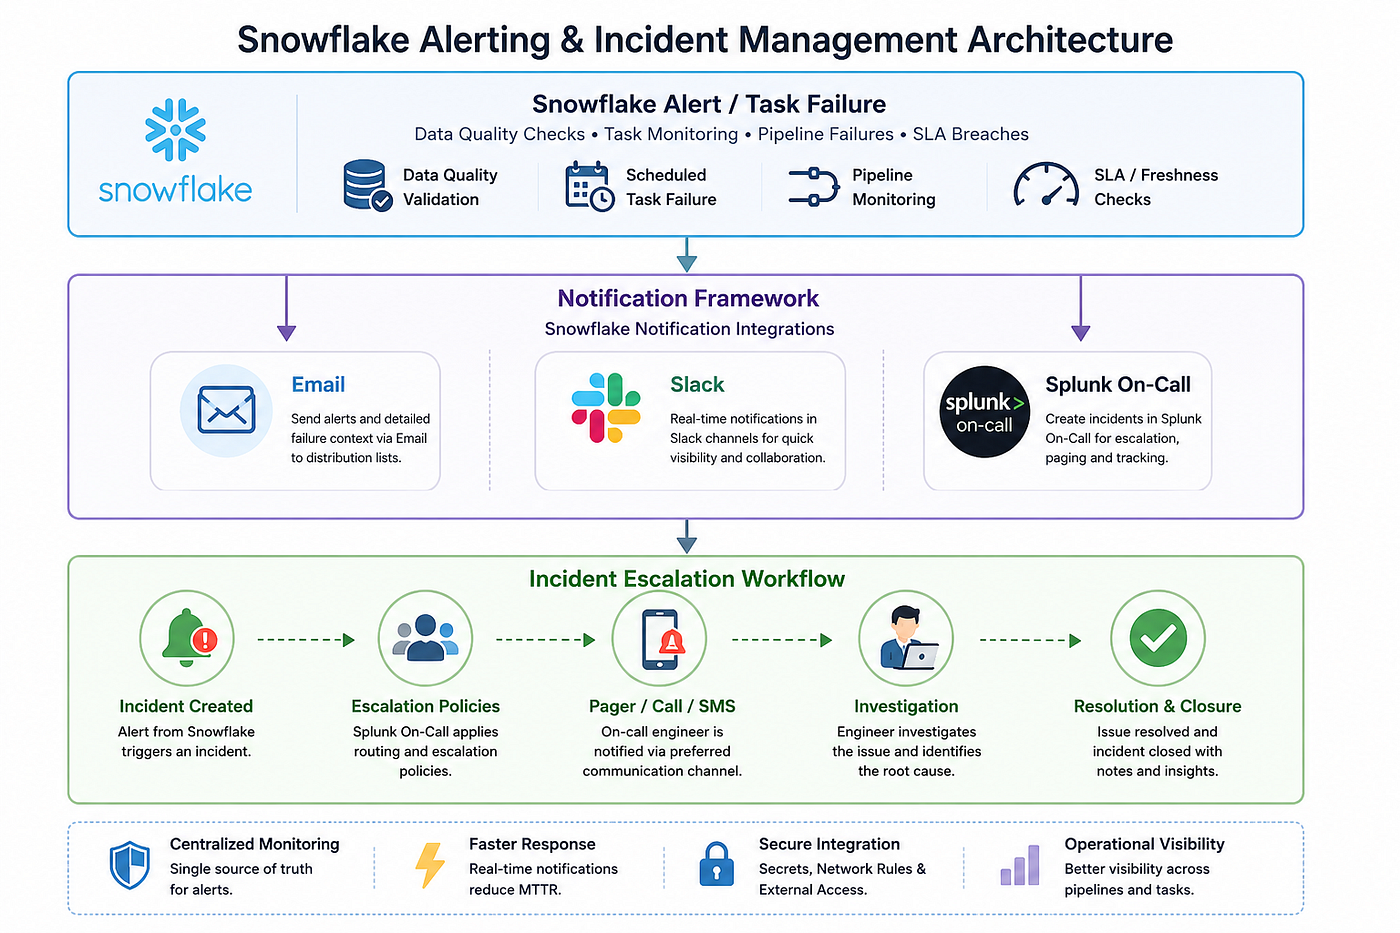
Rather than introducing another monitoring platform, we chose to build the framework directly within Snowflake, where our data quality validations, task executions, and operational metadata already resided. This allowed us to keep monitoring logic close to the source of truth while minimizing operational complexity.
At a high level, the framework follows three core responsibilities:
Detection
Snowflake Alerts continuously evaluate operational and data quality conditions such as:
- Missing data partitions
- Data freshness violations
- Duplicate records
- Invalid or null values
- Snowflake task failures
Once a failure is detected, the alert generates contextual information describing the issue and its impact.
Notification
The next step is delivering the alert to the appropriate audience.
To support multiple communication channels, we leveraged Snowflake’s native Notification Integration framework.
For Slack notifications, we created a dedicated webhook-based integration that routes alerts directly into our engineering channels.
CREATE OR REPLACE NOTIFICATION INTEGRATION DATAPLATFORM_SLACK_NOTIFICATION
TYPE = WEBHOOK
ENABLED = TRUE
...
This integration allows Snowflake Alerts and Stored Procedures to publish messages directly to Slack without requiring intermediary services.
For email notifications, Snowflake’s native Email Notification Integration provides a straightforward mechanism for notifying stakeholders and distribution groups.
Escalation
While Slack and Email provide visibility, critical incidents require escalation management.
For this purpose, we integrated Splunk On-Call directly with Snowflake.
Unlike Email and Slack integrations, Splunk On-Call requires outbound API communication. To enable this securely, we implemented three Snowflake security components:
1. Network Rules
Network Rules define which external endpoints Snowflake is allowed to communicate with.
CREATE NETWORK RULE SPLUNK_ONCALL_NETWORK_RULE
MODE = EGRESS
TYPE = HOST_PORT
VALUE_LIST = ('alert.victorops.com');
This ensures outbound traffic is restricted to approved destinations.
2. External Access Integrations
External Access Integrations provide a controlled mechanism for Snowflake Stored Procedures to communicate with external services.
CREATE EXTERNAL ACCESS INTEGRATION
SPLUNK_ONCALL_ACCESS_INTEGRATION
...
This layer acts as a security boundary between Snowflake and external APIs.
3. Snowflake Secrets
Sensitive credentials such as API keys are stored securely using Snowflake Secrets rather than being embedded directly within code.
This allows credentials to be rotated independently while maintaining strong governance controls.
Automated Incident Creation
Once the secure connectivity layer was established, we implemented a Python Stored Procedure responsible for creating incidents in Splunk On-Call.
The procedure performs the following steps:
- Retrieves API credentials securely from Snowflake Secrets.
- Builds the incident payload.
- Invokes the Splunk On-Call REST API.
- Creates an incident automatically.
- Triggers the appropriate escalation policy.
Conceptually, the workflow looks like:
Snowflake Alert
       │
       ▼
Python Stored Procedure
       │
       ▼
Snowflake Secrets
Network Rules
External Access Integration
       │
       ▼
Splunk On-Call REST API
       │
       ▼
Incident Created
The procedure sends information such as:
- Message type
- Entity identifier
- Alert description
- Dataset information
- Monitoring source
allowing incidents to contain actionable operational context from the moment they are created.
Putting Everything Together
The final architecture provides a clean separation of concerns between detection, notification, and escalation.
Snowflake Alert / Task Failure
            │
            ▼
 Notification Framework
   ├── Email
   ├── Slack
   └── Splunk On-Call
            │
            ▼
 Incident Escalation Workflow
This modular design allows each layer to evolve independently.
For example:
- New Data Quality validations can be added without modifying notification channels.
- Additional messaging platforms can be integrated without changing alert logic.
- Escalation policies can be updated without impacting Snowflake Alerts.
Most importantly, the framework transforms operational failures into actionable incidents automatically, ensuring that engineers spend less time discovering problems and more time resolving them.
Detecting Data Quality Issues
The first step was defining what constitutes a failure.
Photo by Brett Jordan on Unsplash
For one of our event ingestion pipelines, we identified three high-value validations:
Missing Hour Detection
The pipeline is expected to process data for every hour of the day.
Missing hours usually indicate:
- Delayed ingestion
- Upstream failures
- Partial processing
Duplicate Record Detection
Every event should have a unique identifier.
Duplicate records typically indicate:
- Replay events
- Reprocessing issues
- Upstream inconsistencies
Mandatory Field Validation
Several fields are required for downstream processing.
Missing values can lead to:
- Broken reporting
- Incomplete analytics
- Incorrect business metrics
Instead of creating separate monitoring jobs for each validation, we consolidated them into a single Snowflake Alert.
Why Detailed Alerts Matter
One lesson we learned quickly was that generic notifications are rarely useful.
A message saying:
“Data Quality Check Failed”
doesn’t help an engineer understand what actually happened.
Instead, our alerts generate contextual information that includes:
- Which validation failed
- Missing hours
- Duplicate record counts
- Invalid row counts
- Affected dataset
This significantly reduces investigation time during incidents.
Delivering Notifications
Once an issue is detected, the next challenge is getting that information to the right audience.
Different stakeholders consume alerts differently.
Email for Visibility
Email serves as the broadest notification channel.
It provides:
- Auditability
- Historical records
- Distribution lists
- Organizational visibility
For production incidents, email ensures alerts remain discoverable even after real-time conversations have ended.
Slack for Collaboration
While email provides visibility, Slack provides speed.
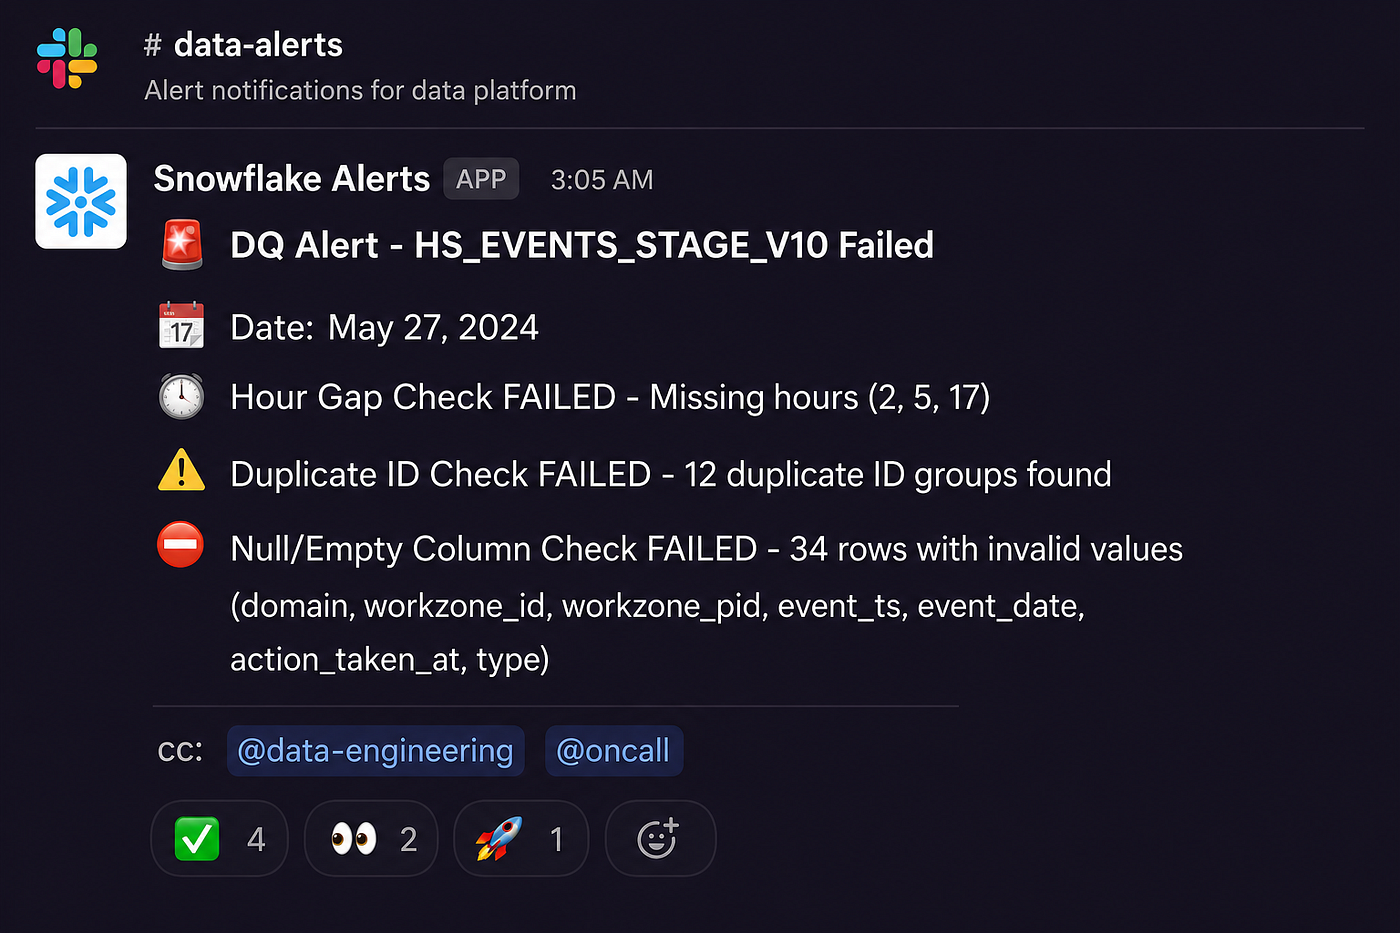
Engineers can:
- Discuss incidents immediately
- Share findings
- Coordinate fixes
- Acknowledge issues quickly
This dramatically improves response times compared to email-only workflows.
Introducing Splunk On-Call
Email and Slack are excellent communication tools, but they don’t solve escalation management.
For critical production issues we needed:
- On-call routing
- Escalation policies
- Pager notifications
- Incident tracking
This led us to integrate Splunk On-Call into the workflow.

Whenever a critical alert is triggered:
- A Splunk On-Call incident is created automatically.
- Escalation policies determine who gets paged.
This ensures that critical failures are never dependent on someone noticing a Slack message.
Securely Connecting Snowflake to External Systems
One of the most interesting aspects of this implementation was enabling Snowflake to communicate with external services securely.

Rather than exposing credentials directly inside procedures, we leveraged:
- Snowflake Secrets
- Network Rules
- External Access Integrations
This allowed us to securely invoke external APIs while maintaining governance and security standards.
The result was a clean architecture where alert logic remained inside Snowflake while incident management systems remained external and independently managed.
End-to-End Alert Flow
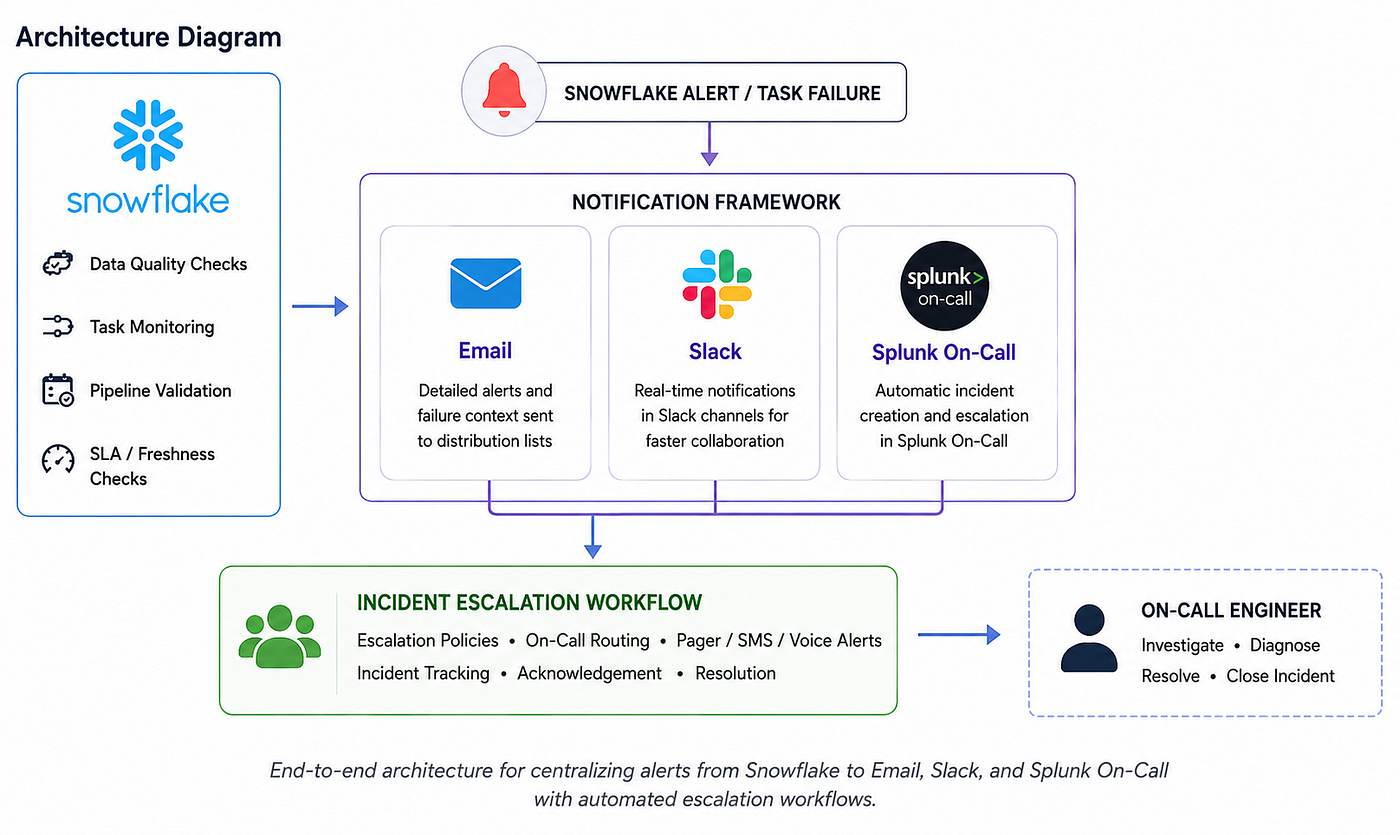
This architecture ensures every critical failure follows a consistent response path.
Benefits We Observed
Centralized Monitoring
Monitoring logic remains close to the data.
Faster Detection
Failures are identified immediately after validation.
Reduced MTTR
Detailed notifications help engineers identify root causes quickly.
Better Operational Visibility
Teams gain a single source of truth for pipeline health.
Improved Reliability
Critical incidents automatically trigger escalation workflows.
Recommended Use Cases
This framework can be extended beyond data quality monitoring.
Examples include:
- ETL / ELT pipeline failures
- Snowflake Task monitoring
- Data freshness checks
- SLA monitoring
- Cost anomaly detection
- Infrastructure health monitoring
- Business KPI threshold alerts
Key Takeaways
Building an alerting system is not just about detecting failures.
It’s about delivering the right information to the right people at the right time.
A few principles stood out during implementation:
- Contextual alerts are far more valuable than generic notifications.
- Detection and notification should remain loosely coupled.
- Multiple communication channels improve operational resilience.
- Secure integrations are essential when communicating with external systems.
- Incident escalation should be automated whenever possible.
Conclusion
As data platforms continue to grow in scale and complexity, observability becomes just as important as data processing itself.
By combining Snowflake Alerts, Notification Integrations, Slack, Email, and Splunk On-Call, we built a centralized alerting framework that improves visibility, accelerates incident response, and reduces operational overhead.
More importantly, it enables engineers to spend less time searching for failures and more time solving them.
메타데이터
- post_id
- 2f90d93a65b5
- slug
- building-a-centralized-alerting-framework-for-data-quality-monitoring-and-incident-management-2f90d93a65b5
- url
- https://medium.com/helpshift-engineering/building-a-centralized-alerting-framework-for-data-quality-monitoring-and-incident-management-2f90d93a65b5
- canonical_url
- https://medium.com/helpshift-engineering/building-a-centralized-alerting-framework-for-data-quality-monitoring-and-incident-management-2f90d93a65b5
- author_url
- https://medium.com/@manavmehta2031
- status
- ok
- fetched_at
- 2026-06-21 15:33:18