Covid Effects In India
“Covid Effects In India” through Data Analysis.
Covid Effects In India
“Covid Effects In India” through Data Analysis.
This comprehensive report delves into the multifaceted impacts of the COVID-19 pandemic on India, with a meticulous focus on the economic, environmental, and public health domains. Through meticulous data analysis, the report presents a comparative analysis of the pre- and post-pandemic periods, shedding light on the profound shifts in the nation’s dynamics.
This report was collaboratively produced by myself and four team members, each of whom conducted an in-depth analysis of distinct case studies related to the effects of COVID-19 in India. Leveraging the knowledge acquired from our coursework at RV University in Data Analysis with Python, we have compiled this report as our project.
It is essential to note that the majority of our datasets were sourced from the internet, and their utilization is strictly for educational purposes. The references we have used are at the end of this report for anyone seeking to consult them.
Brief Overview of Case Studies:
Mortality Impact: The report meticulously analyzes mortality rates. By uncovering patterns and trends, it provides valuable insights into the toll the virus has taken on human lives.
Economic Impact: The report scrutinizes India’s economic landscape before and after the onset of COVID-19, unraveling the repercussions on key indicators such as GDP growth. A nuanced exploration of government responses and economic stimulus measures is undertaken to provide a holistic understanding of the economic fallout.
Pollution Impact: An in-depth examination of pollution levels in major Indian cities prior to the pandemic sets the stage for evaluating the environmental consequences of COVID-19. The report analyzes how lockdowns and restrictions affected pollution, investigating whether the observed reductions in industrial activities and transportation were sustained or if pollution levels rebounded post-lockdown.
Mental Health Impact: With a focus on the human aspect, the report explores the pandemic’s toll on mental health. Increased stress, anxiety, and depression due to factors such as isolation and economic uncertainties are scrutinized.
Case Study 1: Mortality Rate
-
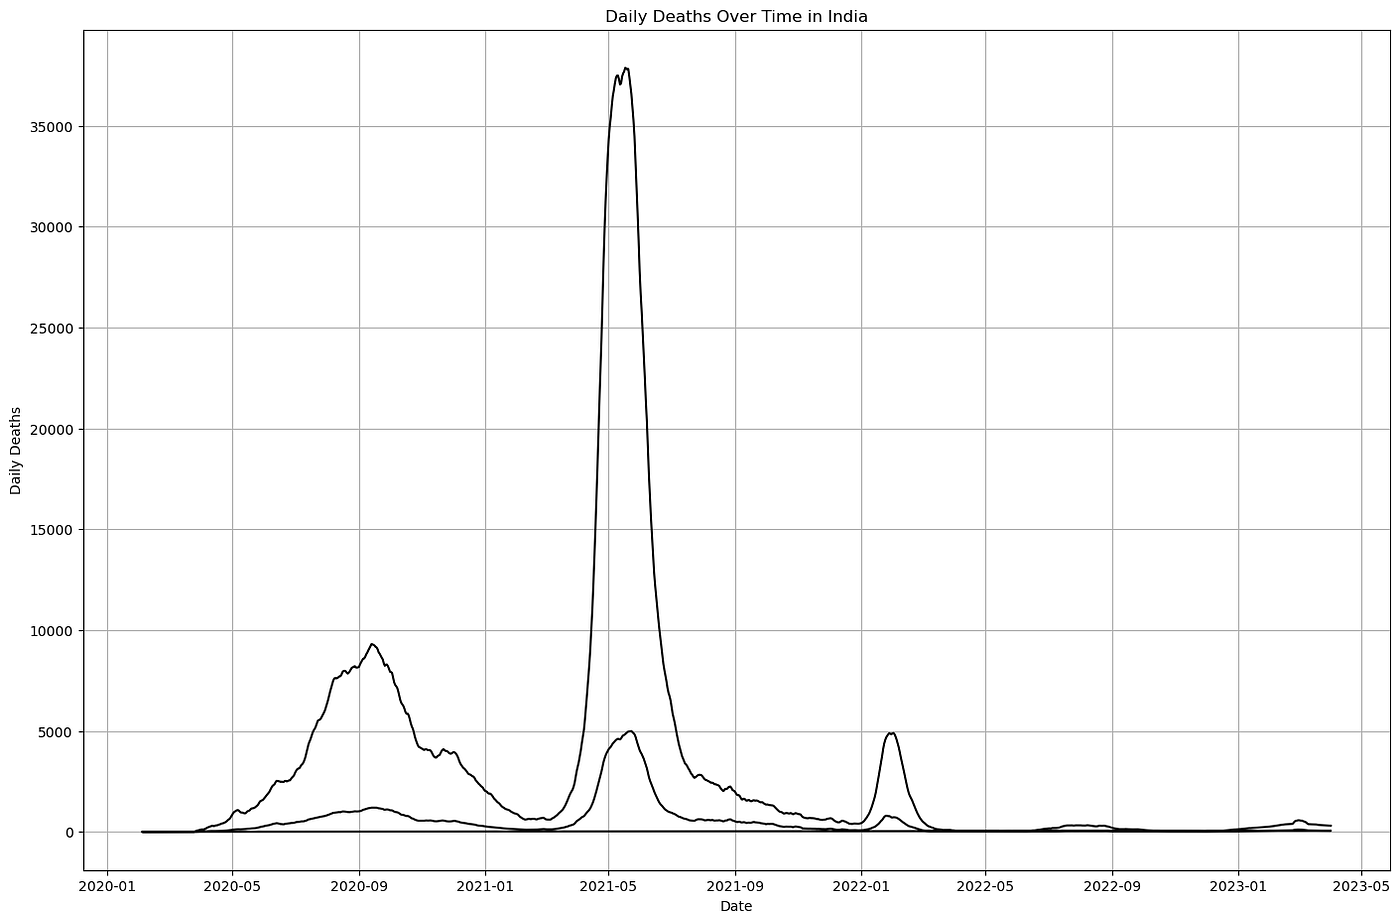
Peak in COVID Deaths (May 2021): The highest number of COVID-19 deaths occurred notably in May 2021, marking a critical period during the pandemic.
-
Stabilization Post-January 2021: After January 2021, the data indicates a trend towards stabilization, suggesting that the situation gradually improved, and the rate of new deaths started to decline.
-
Onset of Deaths (May 2020): The dataset reveals the onset of COVID-19-related deaths from May 2020, signifying the beginning of a challenging phase during the pandemic.
-
Rampant Increase in Overall Deaths: A substantial and sustained increase in overall deaths is evident throughout the analyzed period, highlighting the severity of the pandemic’s impact on mortality.
-
Gradual Worsening and Time to Fatality: The progression of deaths over time reflects a gradual worsening of individuals’ conditions, indicating that COVID-19 didn’t result in immediate fatalities but rather unfolded over an extended period. This underscores the prolonged and serious nature of the health crisis
During the COVID-19 pandemic, India faced varying mortality rates, influenced by factors such as healthcare infrastructure, demographics, the spread of the virus in different regions, and the availability of medical resources.
The reported mortality rate in India due to COVID-19 fluctuated throughout the pandemic. At different stages, it was affected by factors such as testing capacity, data accuracy, and variations in reporting methods among different states and regions.
As of last update in January 2022, the overall mortality rate in India was estimated to be around 1.3–1.4%. However, these numbers can vary based on when and how data was collected, as well as the actual number of COVID-19 cases and related fatalities.
It’s important to note that mortality rates can change over time due to advancements in medical treatments, vaccination drives, changes in virus variants, and other factors affecting the course of the pandemic. For the most recent and accurate figures, it’s advisable to refer to current reports or official health department statistics.
Case Study 2: Economic Impact
-
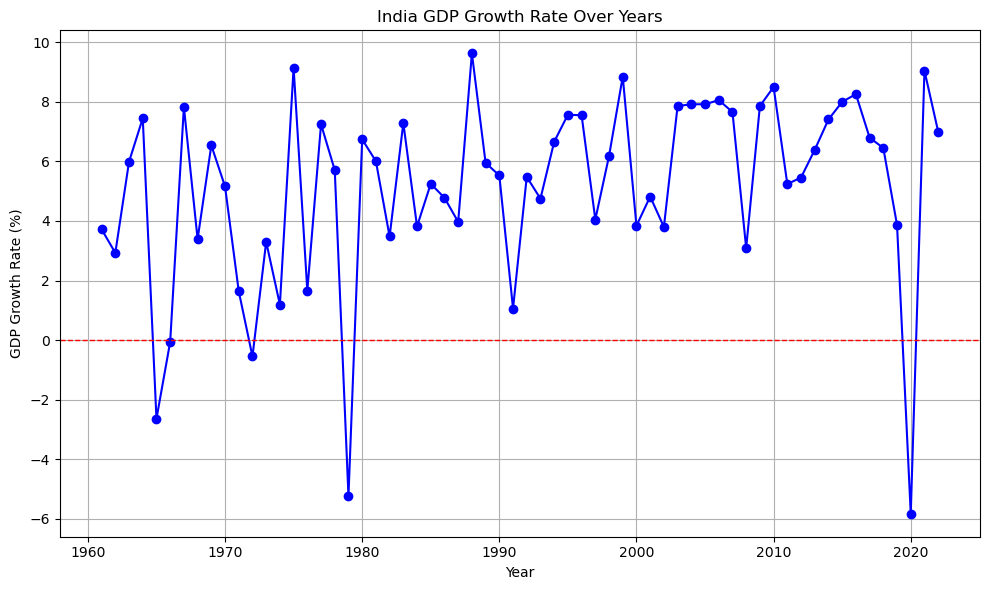
The graph illustrates India’s GDP trends from 1960 to 2023.
-
Economic challenges were notable with fluctuations, marking four distinct periods of crisis.
-
The pandemic induced a severe economic downturn, reflected in the lowest GDP point, yet India demonstrated resilience with a swift recovery within a year or two. Notably, the post-1990s era saw a peak in GDP.
-
Presently, the GDP is on a declining trajectory, suggesting a return to more typical economic patterns.
-
The graph underscores the remarkable resilience of the Indian people, evident in the swift recovery from the COVID-induced economic downturn and similar resilience demonstrated in past economic challenges. This resilience has played a pivotal role in propelling the country back on track during periods of adversity.
During the COVID-19 pandemic, the Indian economy faced a significant downturn. In the financial year 2020–2021, India experienced a historic contraction in its Gross Domestic Product (GDP). The GDP contracted by around 7.3% during this period, primarily due to the stringent lockdown measures imposed to curb the spread of the virus.
However, as the economy gradually reopened and adapted to the new normal, subsequent quarters showed signs of recovery. In the following financial year 2021–2022, there was a rebound in economic activity, and the GDP growth rate turned positive. The exact figures varied across different quarters and sectors, showcasing a mix of challenges and resilience in different segments of the economy.
The government implemented various fiscal and monetary measures to support businesses and individuals affected by the pandemic, aiming to stimulate economic growth and recovery. The trajectory of GDP growth continued to evolve, influenced by factors such as vaccination drives, global economic conditions, and the effectiveness of policies to reignite economic activity across sectors.
Case Study 3: Pollution Impact
-
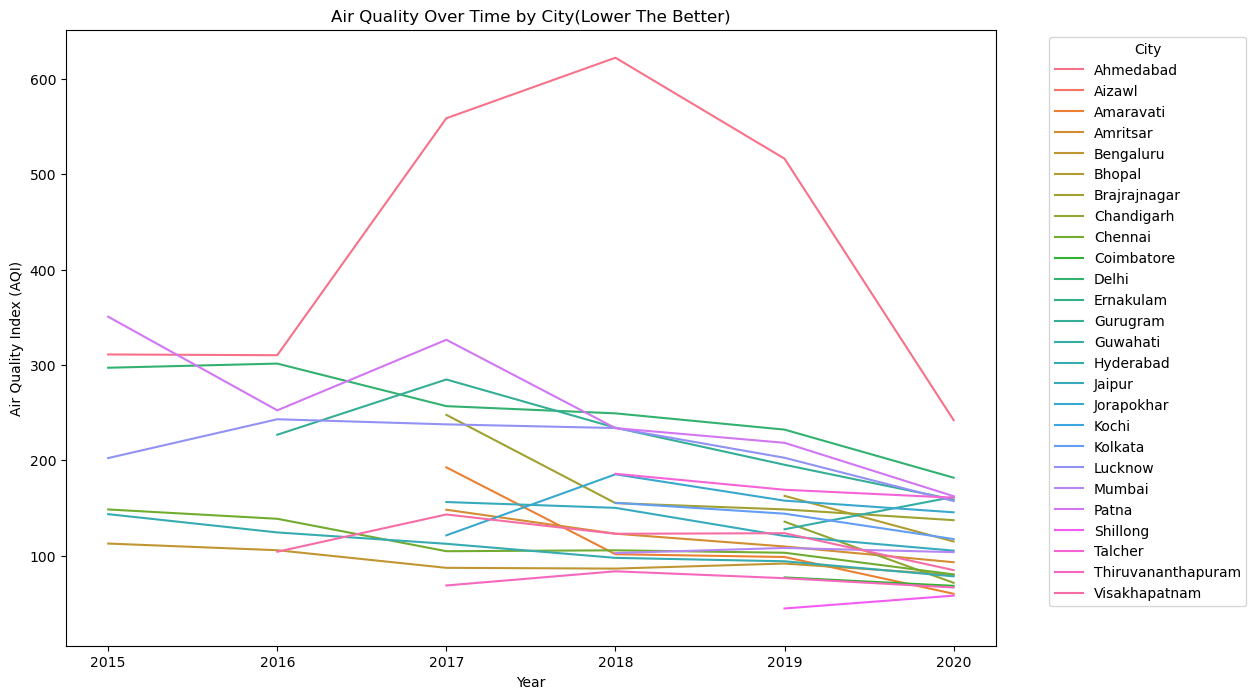
The line plot depicts the air quality index trend from 2015 to 2020, offering a concise overview of the variations during this perod.
-
A notable drop in the air quality index from 2018 to 2020 indicates improved air quality during the COVID-19 period. This suggests a reduction in individual transportation, likely due to lockdown measures.
-
Ahmedabad shows the most significant improvement in air quality compared to other cities.
-
Some cities lack air quality data for certain years, evident from gaps in the plot.
-
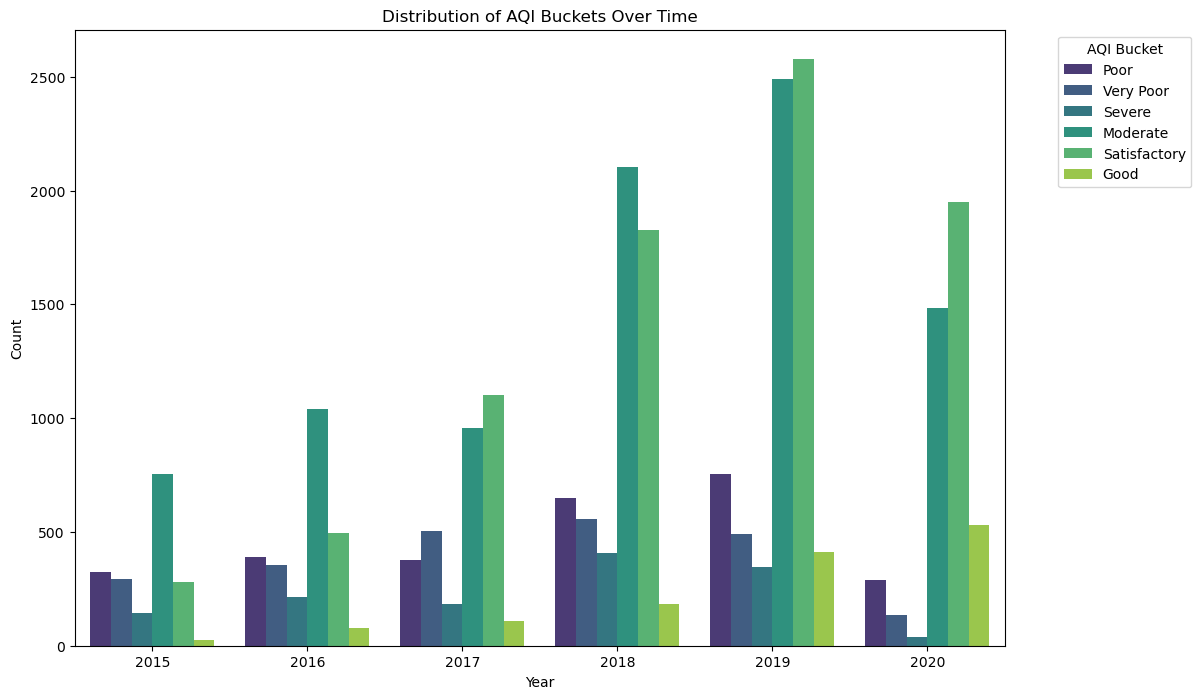
The presented countplot illustrates reviews reflecting people’s sentiments regarding the air quality index changes from 2015 to 2020.
-
A noticeable surge in opinions is evident during the COVID-19 lockdown period, indicating a heightened awareness and concern for air quality. This suggests that, despite the substantial costs associated with the pandemic, there were discernible benefits in terms of increased environmental consciousness.
-
It’s essential to acknowledge that the rise in reviews during this timeframe may also be attributed to increased internet accessibility, providing a more extensive insight into public opinions.
-
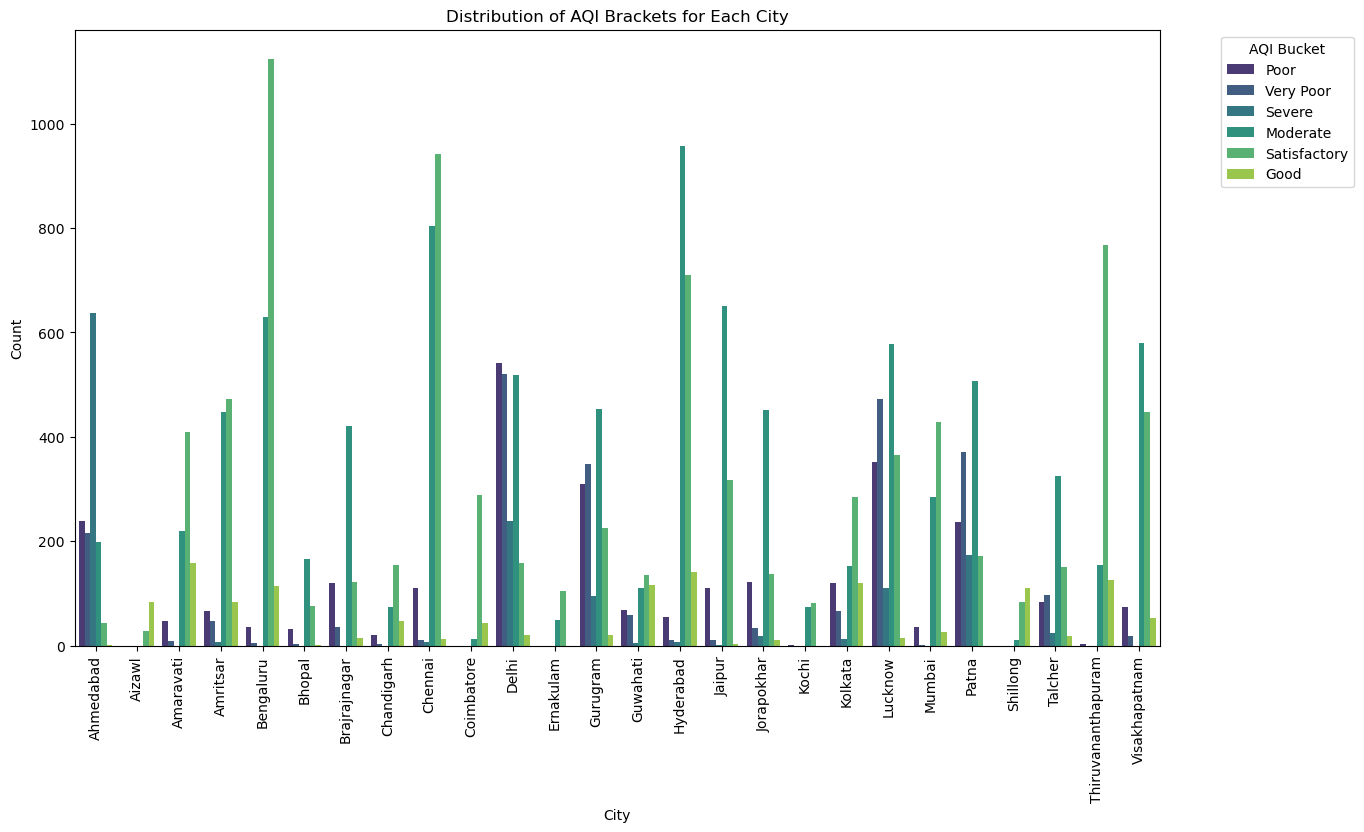
The presented count plot provides a comprehensive overview of reviews per city in India concerning the air quality index spanning from 2015 to 2020.
-
Notably, the reviews reveal that Bengaluru stands out with the highest count of positive reviews, suggesting a relatively favorable perception of air quality. In contrast, Delhi receives the majority of negative reviews, indicating significant concerns regarding air quality in the capital.
-
The higher count of reviews for Bengaluru may be attributed to its status as the Silicon Valley of India, with a tech-savvy population more likely to share opinions online. This insight adds a nuanced layer to the interpretation of the reviews and their distribution across cities.
India grappled with severe air pollution, earning many of its cities notorious positions on the list of the world’s most polluted. The onset of the COVID-19 pandemic prompted an unprecedented response from the government, leading to a nationwide lockdown. As transportation came to a standstill, an unexpected transformation occurred. The once-obscured vistas became crystal clear, unveiling distant horizons that had long been shrouded in smog — an extraordinary spectacle for a generation accustomed to hazy skylines.
In a meticulous analysis of data, a pronounced and favorable drop in the Air Quality Index was evident, eliciting predominantly positive responses from the public. The tangible improvement in air quality served as a testament to the immediate environmental impact of reduced human activity.
However, with the gradual return to normalcy and the resumption of personal transportation, there is a looming concern that pollution levels may revert to their former, alarming state. Despite the adversities imposed by the pandemic, the period of lockdown also offered a unique window for individuals to witness and appreciate positive changes in their immediate environment. The juxtaposition of the before-and-after scenarios highlights not only the vulnerability of our ecosystems but also the potential for positive change when human activities are moderated.
Case Study 4: Mental Health Impact
-
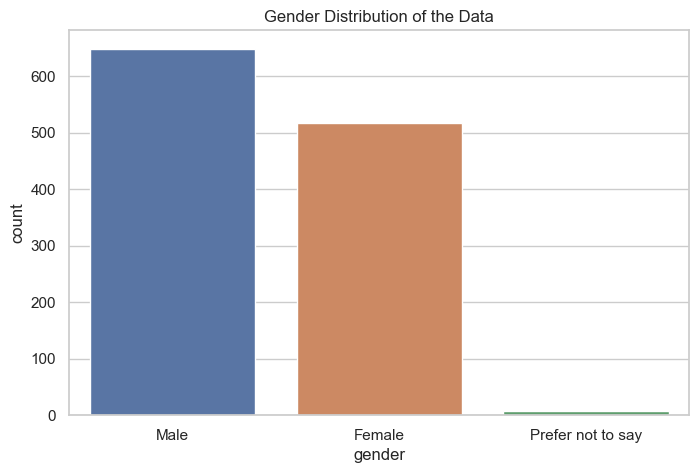
The presented count plot offers insights into the gender distribution within the dataset under consideration.
-
A noticeable trend is that the count of males surpasses that of females and individuals with other gender identifications during the COVID period. This could be attributed to a variety of factors, including potential imbalances in the recorded data, where the number of recorded female individuals might be comparatively lower than males.
-
Specifically, among the 1175 individuals, it is apparent that over 600 are identified as male, while females constitute more than 500. The representation of other genders in the dataset is notably minimal.
-
This visual representation is crucial for comprehending the gender breakdown in the dataset, laying the groundwork for more in-depth gender-related analyses in subsequent examinations.
-
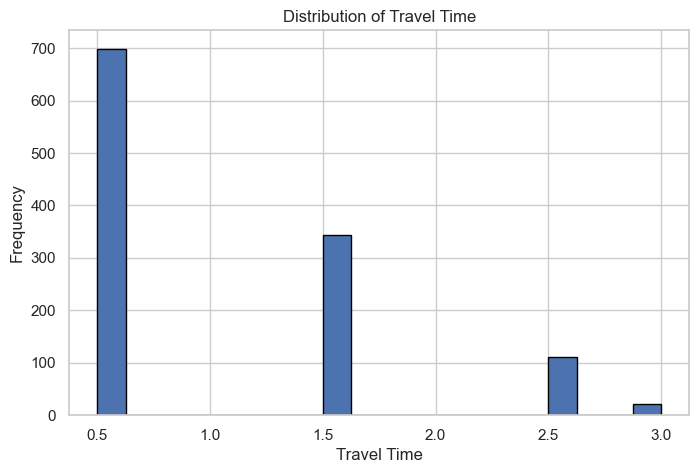
The provided histogram depicts the distribution of the ‘Travel Time’ variable within the dataset.
-
The graph categorizes data into distinct time intervals, showcasing the frequency or count of occurrences during the pandemic.
-
By examining the distribution of travel time, valuable insights emerge regarding the prevalence of different time intervals during this period.
-
Peaks in the histogram signal time intervals with high frequency, while valleys indicate intervals with lower occurrence rates. The visual aids in understanding the patterns and variations in travel time during the pandemic.
-
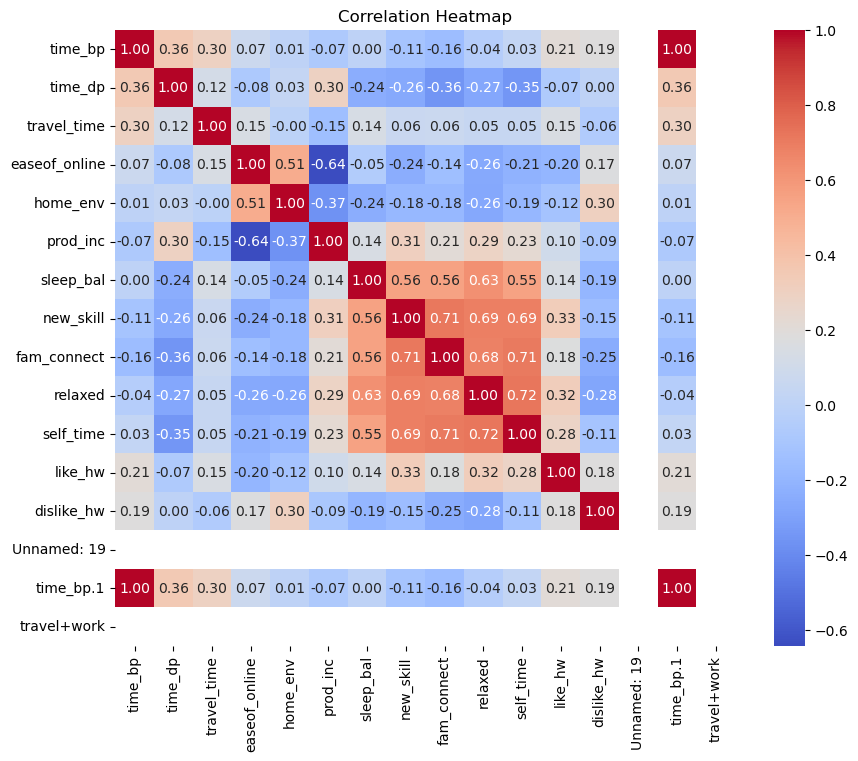
The presented visualization is a Correlation Heatmap, offering insights into the relationships between various categorized data pairs within the dataset.
-
The color gradient, ascending from bottom to top, signifies both the strength and direction of correlations. Shades of red indicate positive correlations, while shades of blue denote negative correlations.
-
The heatmap reveals significant correlations with coefficients such as 0.72, 0.71, indicating the strength of associations among different aspects of people’s mental mindset and behavioral patterns during the observed period.
-
Notably, the analysis underscores that strong correlations exist, for instance, between family connections and individuals engaging in skill development and self-care. Higher correlation coefficients suggest a notable influence of family bonds on these aspects of well-being.
-
Amid the challenges of the pandemic, the study highlights a dual narrative. While people faced hardships, the data suggests a positive aspect as well, with individuals experiencing a break from routine and exploring new activities, contributing to an overall shift in mental health patterns.
The COVID-19 pandemic had profound psychological effects on people in India, impacting individuals across various age groups and socioeconomic backgrounds. Uncertainty surrounding the virus, health concerns, financial insecurities, and the constant influx of distressing news contributed to heightened stress and anxiety levels among the population.Strict lockdowns, social distancing measures, and limited social interactions led to increased feelings of isolation and loneliness, particularly among those living alone or separated from families.Fear of contracting the virus or witnessing its impact on loved ones created widespread panic, affecting mental well-being and leading to hypervigilance about health and safety. Many people faced the loss of family members, friends, or livelihoods due to the pandemic. Coping with grief and mourning under restrictive conditions added to emotional distress. Access to mental health services became challenging during the pandemic due to restrictions on movement and overwhelmed healthcare systems, exacerbating existing mental health conditions for some individuals.
The pandemic highlighted the importance of mental health support and prompted conversations about the need for greater awareness and access to mental health resources in India. Efforts were made by various organizations, mental health professionals, and the government to provide support and guidance to individuals dealing with the psychological impact of the pandemic.
CONCLUSION
India’s recovery post-COVID has been a journey set with challenges and progress. Initially due to the pandemic, the nation mobilized its resources and implemented strategies to secure the health conditions and retrieve the economy. Vaccination campaigns were a massively organized contributing to a gradual decrease in positive cases.
Economically, India set its goals by encouraging digitalization and supporting sectors like healthcare, technology, and e-commerce. However, challenges such as inequalities in healthcare access and economic crisis persist, requiring sustained efforts for inclusive recovery.
The road ahead involves continued vaccination drives, strengthen healthcare infrastructure, and foster economic growth as well as ensure equitable distribution of resources. The path of India’s recovery post-COVID reflects the nation’s ongoing need for comprehensive strategies to address the hard hit sectors due to pandemic.
People’s mindset has changed deliberately by living in the lockdown, as they strive to get things back to normal, and the pollution, which had shown us a part of India that the current generation didn’t know, will all be brought to what was before COVID. Some things may change forever, while some will revert back to normal.
Team Members:
- MOHAN CHANDRA S S
- PRABHAT M MASALI
- MUNNALURI RISHIKESH
- NOOTHAN K T
Course Professor — Prof.Ashwini Kumar Mathur
REFERENCES / DATASETS LINKS :
- Dataset for Mortality Rate : https://www.healthdata.org/research-analysis/health-by-location/profiles/india
- Dataset for Economy: https://www.macrotrends.net/countries/IND/india/gdp-growth-rate
- Dataset for Pollution: https://www.kaggle.com/code/parulpandey/breathe-india-covid-19-effect-on-pollution
- Dataset for Mental Health Impact: https://www.kaggle.com/datasets/hemanthhari/psycological-effects-of-covid
Disclaimer:
The datasets employed in this project are solely utilized for educational purposes. This project is a non-commercial endeavor and aims to contribute to academic learning and research. The data used is either publicly available or used under appropriate licenses for educational use only. No part of this project intends to infringe upon copyrights, trademarks, or any intellectual property rights. The project creator explicitly disclaims any intention of unauthorized commercial use or distribution of copyrighted material. If any unintended use has occurred, it is purely accidental, and the creator expresses a commitment to address and rectify such instances promptly. Users are urged to respect copyright laws, licensing agreements, and the terms of use associated with each dataset. This disclaimer is provided in good faith to underscore the project’s educational nature and to mitigate any inadvertent misuse of data.
메타데이터
- post_id
- 36361ddf5b65
- slug
- covid-effects-in-india-36361ddf5b65
- url
- https://medium.com/@mohanchandrass/covid-effects-in-india-36361ddf5b65
- canonical_url
- https://medium.com/@mohanchandrass/covid-effects-in-india-36361ddf5b65
- author_url
- https://medium.com/@mohanchandrass
- status
- ok
- fetched_at
- 2026-06-26 12:24:55



