Apple Silicon Futurology
Apple’s new endeavour seems to have caught the imagination of so many.
Apple Silicon Futurology
Apple’s new endeavour seems to have caught the imagination of so many.
How much performance will Apple be able to deliver with its rumoured new SoCs that everyone expects over the next months? Will Apple be able to compete with the likes of AMD Threadripper? These are questions in many people’s mind, and some have already tried their own predictions, while others have discarded Apple’s chances.
I too have succumbed to this rush of attempting to predict the future, imagining how I could estimate the mythic M1X performance, even though I have no expertise in this area. Even if M1X doesn’t materialize as a SoC from the same M1 core generation, ending up as “M2X“ SoC instead, we can always guesstimate the different possibilities, focusing on Mark Gurman’s rumoured new Apple Silicon SoCs: 8 high-performance (P) cores plus 2 efficiency (E) cores [8+2], 16 P cores plus 4 E cores [16+4], and 32 P cores plus 8 E cores [32+8].
So, what is necessary to make futurology…? We need some basic understanding of what we want to guesstimate. Then we need Data! Enough historical data so that we can identify reasonable patterns to build a model of behaviour, and a set of assumptions to make that model work in a realistic way. Of course, I cannot assume that this model follows reality with absolute fidelity, that would involve too many variables and actually knowing things of which I don’t know, which would make it too hard to come up with a conclusion… this is just supposed to be a rough approximation.
My interest is to predict reasonable score intervals for Cinebench and Geekbench. These benchmarks are widely used and more or less understandable, which makes it easier to get public Data. There is enough data to model these benchmarks’ behaviour with increasing number of cores, to see how well the multithreading tests scale.
Since Apple has never produced 10, 20 or 40 core SoC, we can look at AMD processors instead, using its behaviour as a model for what Apple could achieve in terms of efficiency of scaling, though it could be better or worse. What we can forecast from Apple’s history, is single threaded performance growth for M2 family of SoCs.
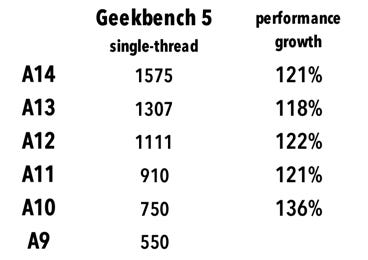
Looking at these values, a conservative estimate would be at least 15% growth in the next generation. The [16+4] and [32+8] SoCs will almost certainly be part of this next generation, and I believe [8+2] SoC will too.
Using data from CPU-Monkey database for various AMD processors, we can calculate a ratio between per core multi-threaded score and clock speed adjusted single-threaded score. This gives an estimate for multiplier efficiency that we can then use to model possible Apple Silicon SoCs.
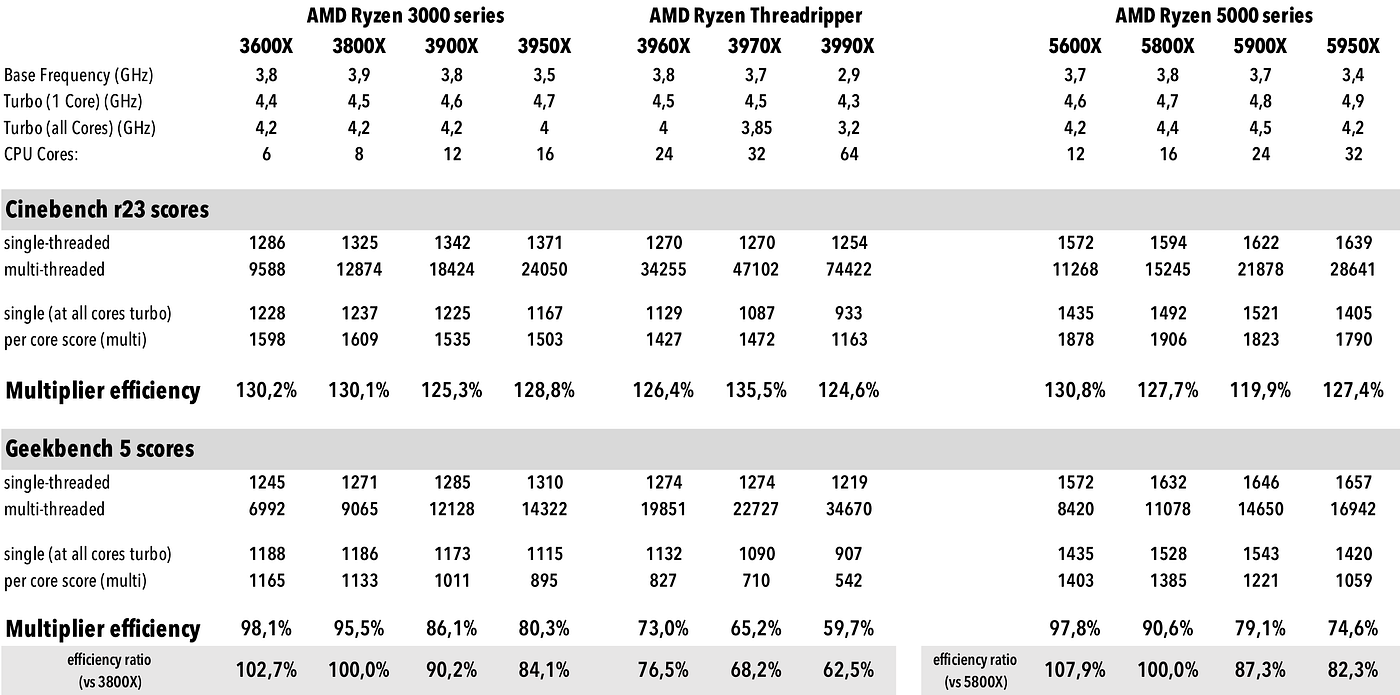
We can see from the table that Cinebench scales quite well. Geekbench on the other hand not so much. Geekbench is composed by 21 separate tests and each one scales differently, with some quite poorly depending of the processor characteristics. There seem to be some differences between Ryzen 3000 and Ryzen 5000 efficiencies, but I think the efficiency ratio values versus the 8-core processor seem more or less in agreement.
From here we can start to build a model for our predictions. Since Apple SoCs use 2 different cores, and we only have individual scores for the P core, that complicates things. We need first to come up with an estimate for E cores contribution.
Cinebench
Luckily Ars Technica run Cinebench R23 with different number of cores, which helps us make that estimate.
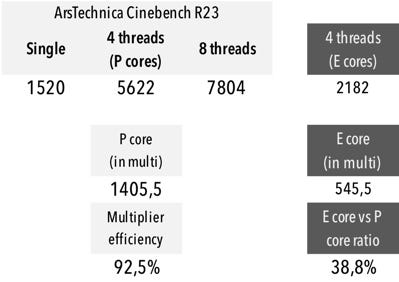
Subtracting 4-thread from 8-thread score gives the E core estimate. From these values we can also calculate a multiplier efficiency for P cores which will be necessary to establish an interval for our guesstimate. Considering what we saw with AMD processors we an interval between 85 and 92,5% seems reasonable. As stated previously I believe these new SoCs will be part of a new family (M2) of SoCs with a probable 15% boost, so I also focus on those values. Considering that these would be used on Macs with better thermals, and Apple cores consume relatively low power I don’t envision Apple lowering clock speeds when all cores are running.
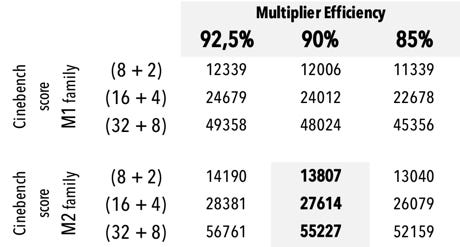
Anyone can make their own mind, but I expect that Cinebench scores for the rumoured new SoC will be around 13 800 (8+2), 27 600 (16+4) and 55 000 (32+8).These would seem to be quite competitive considering how little they would consume. For example, a (8+2) SoC CPU would consume less than 40W; in Cinebench would actually be closer to 28W considering M1’ behaviour.
GeekBench
Geekbench becomes far more complicated because of Apple Silicon heterogenous cores. Though A14 scores would seem they should help, the fact is the A14 SoC does not represent the [2+4] SoC equivalent in the M1 family, even when we take into account clock speed differences.
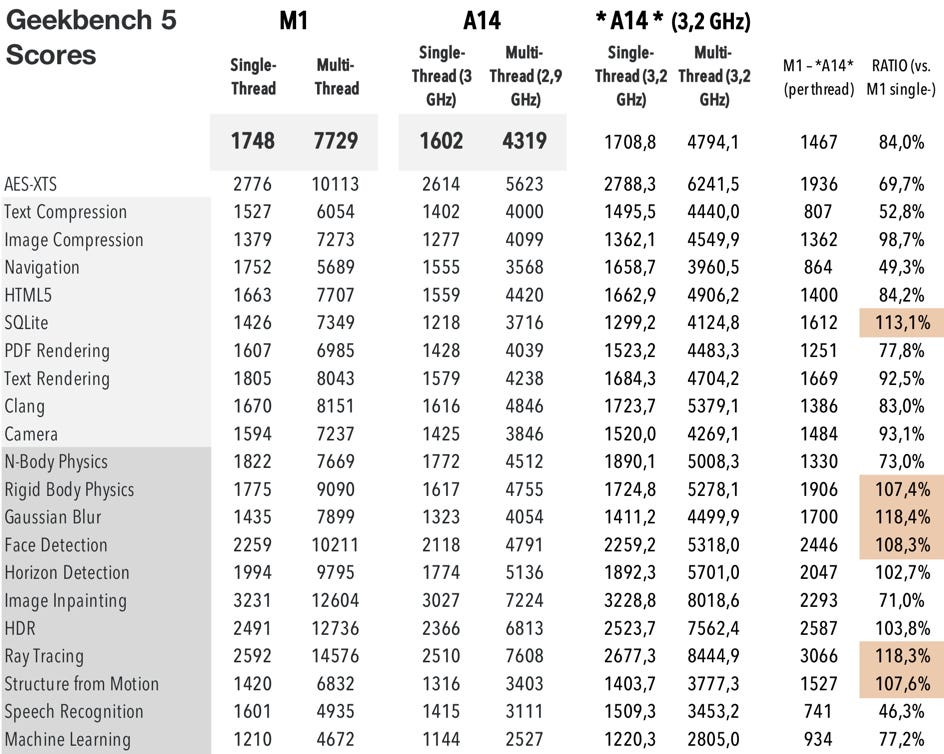
Picking some of the best individual scores (not averages) from Geekbench database for each SoC, we see there are a few tests where there is a clear boost in performance that goes beyond the extra cores and clock speed, when we compare the M1 with A14 scores adjusted for clock speed. The per core difference between them is higher than what should be possible. This could be due to differences in cache and how the E cores are used, for example.
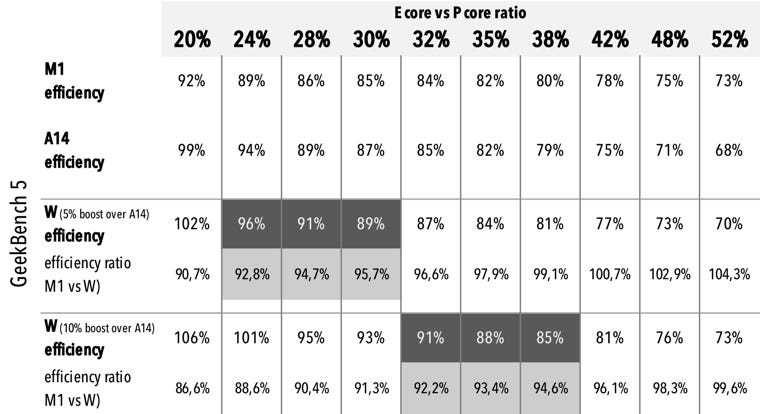
This means that we need to simulate a boosted score for a A14 equivalent (W), to compare it with the M1, and try to figure out what should be the E cores contribution to GeekBench benchmark final score.
There is uncertainty with this method, but using some common sense and the previous AMD data, we can make some assumptions. We should not see a W’s boost higher than 10% and using AMD’s data we can assume that the efficiency ratio between these SoC should be somewhere around 90–96%. The W SoC should definitely have a multiplier efficiency of less than 95% considering that many of the Geekbench tests don’t scale well.
We these assumptions I believe it is reasonable to estimate that the E cores score contribution should be somewhere between 24% and 42%. Being conservative I start my estimate at 28% which is closer to what Cinebench gives (though it’s different benchmark so it might not mean anything).
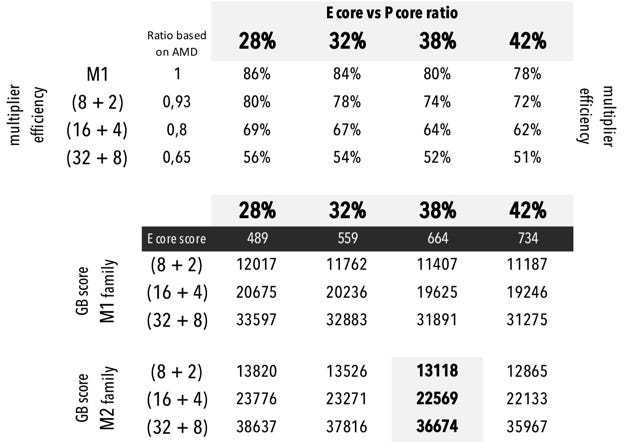
Picking AMD’s efficiency ratios, and 4 different E core contribution estimates, we can calculate score estimates, just by adding all core scores with the corresponding multiplier efficiency.
In the end we get a [8+2] SoC score somewhere between 12 900 and 13 800; [16+4] would be between 22 100 and 23 800; [32+8] between 36 000 and 38 600. So maybe around 13 300, 23 000 and 37 300 respectively, which would not be that bad, would it!?
메타데이터
- post_id
- 39cf18059fcc
- slug
- apple-silicon-futurology-39cf18059fcc
- url
- https://medium.com/@ppietra/apple-silicon-futurology-39cf18059fcc
- canonical_url
- https://medium.com/@ppietra/apple-silicon-futurology-39cf18059fcc
- author_url
- https://medium.com/@ppietra
- status
- ok
- fetched_at
- 2026-07-28 06:17:56