They Bought Homes, We Bought Loans: A Data-Driven Look at Millennial vs Gen Z Wealth Gaps
How rent, debt, and income shaped two generations differently, with Python code and real FRED data
They Bought Homes, We Bought Loans: A Data-Driven Look at Millennial vs Gen Z Wealth Gaps
How rent, debt, and income shaped two generations differently, with Python code and real FRED data
1. Introduction: The Silent Wealth Gap Between Generations
Walk through almost any American city today and you can see the outlines of a generational divide. The apartment listings are priced at levels that mock the word “starter home.” Leasing agents now demand credit scores above 720 just for the privilege of renting a studio. College graduates return to their parents’ houses, not out of nostalgia but out of necessity. TikTok is filled with Gen Z humor about never owning property, but the laughter conceals something else: an unease that effort may no longer translate into stability.
Every generation has endured obstacles. The Great Depression scarred the Silent Generation, and the 1970s brought stagflation for Boomers. Yet the terrain facing Millennials and Gen Z is different in kind, not just degree. Wages froze while asset prices soared. The institutions that once opened doors to mobility, such as college degrees, full-time jobs, and homeownership, mutated into toll gates.
This article will not offer optimism or prescriptions. It will offer evidence. Because signals of structural change already appear in the data, and numbers whisper warnings long before crises are visible.
Collapse is not sudden. It begins when societies grow deaf to the quiet signals that their foundations are shifting.
We will track four dimensions that reveal how the ground shifted beneath Millennials and Gen Z: housing affordability, student debt, rent burden, and down payment barriers. Each section uses real FRED data and Python visualizations. This is not nostalgia for the past but recognition of a present that increasingly feels rigged.
The story is not just about money. It is about time, choice, and the quiet erosion of security. Let us decode how the system changed while we were living in it.
2. The Data Pipeline: Real Sources, Real Pain
🔍 Method Note:
The visualizations in this piece are built directly from FRED API calls. The modular Python code is Colab-ready and styled for dark backgrounds, with publication-quality figures saved at high DPI.
Code Block:
# Set global graph styling
plt.rcParams.update({
    "figure.facecolor": "black",
    "axes.facecolor": "black",
    "savefig.facecolor": "black",
    "text.color": "white",
    "axes.edgecolor": "#aaaaaa",
    "axes.labelcolor": "white",
    "xtick.color": "white",
    "ytick.color": "white",
    "grid.color": "#444444",
    "font.size": 12,
    "axes.titlesize": 14,
    "axes.labelsize": 12,
    "legend.fontsize": 10,
    "figure.dpi": 150
})
💡 Portfolio Tip:
Make your code speak for you. Plotting is not enough. Annotation, styling, and explicit documentation of assumptions distinguish a portfolio project from a hobby. Reproducibility is not an extra. It is the foundation of credibility.
3. Graph-by-Graph Analysis: What the Numbers Reveal
G1. Homeownership Is a Moving Target Now
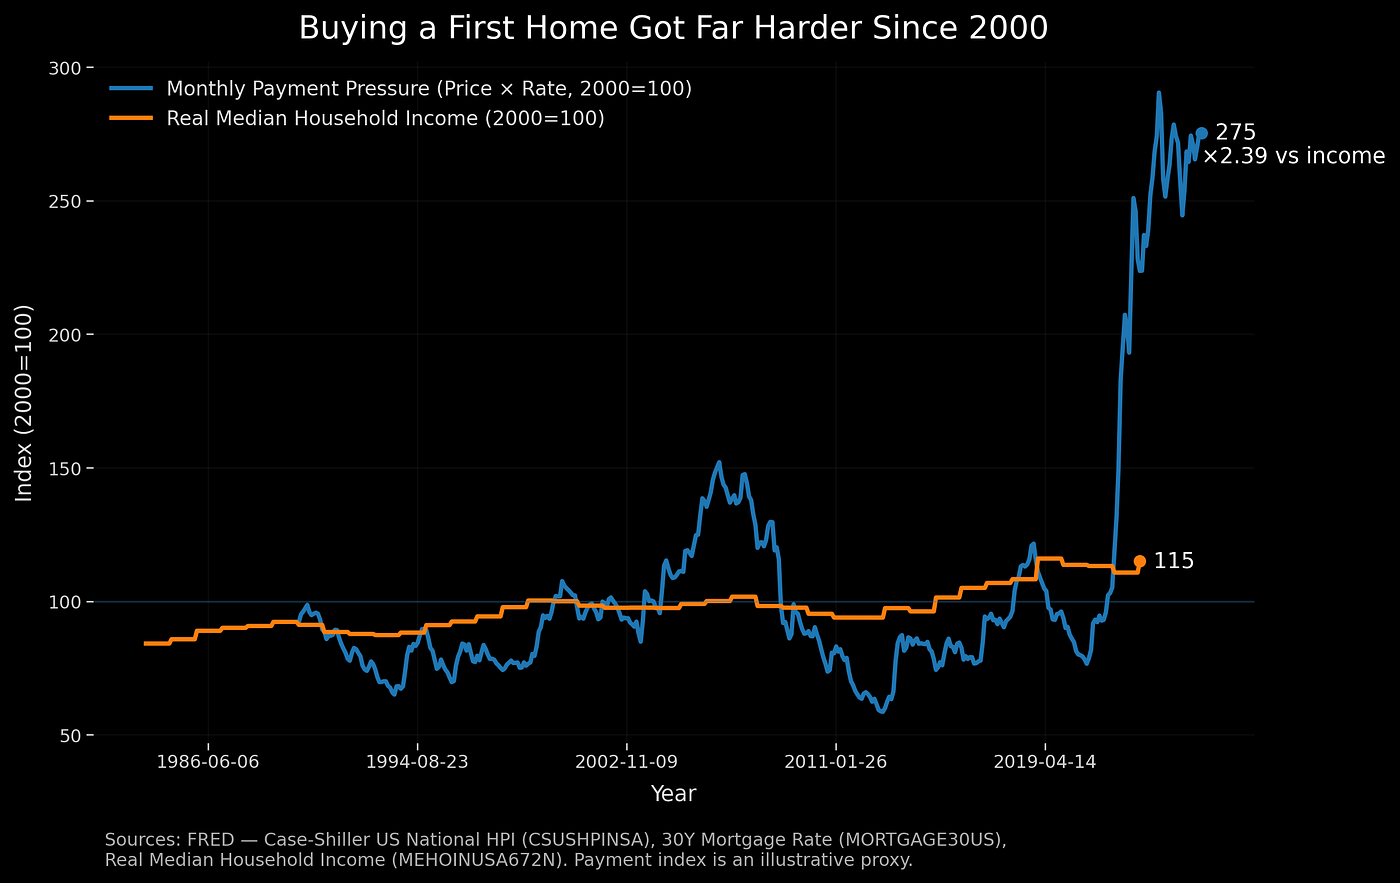
Graph 1) Buying a First Home Got Far Harder Since 2000
Key Insight:
Owning a first home was once framed as the natural progression of adulthood. A steady job, some savings, and discipline were usually enough to cross the threshold. That sequence has broken down.
- Since 2000, the monthly payment pressure index has surged to 275, while real household income lingers around 115. The divergence is not simply about higher prices. It reflects a structural decoupling between the cost of ownership and the earnings of the people expected to pay it.
- For Millennials who entered the housing market before 2008, timing often determined everything. Those who bought before the crash locked in generational wealth. Those who waited lost the window. Gen Z faces a harsher reality: both housing prices and mortgage rates climbed simultaneously, producing a squeeze unseen in previous decades.
- The sociological effect is profound. Housing is not just an asset. It anchors families to communities, stabilizes schooling, and shapes retirement security. When ownership shifts from a norm to a rarity, the downstream consequences ripple across generations.
The American Dream has not disappeared, but it has relocated. It moved away from effort and toward incumbency. The longer one delays entry, the more the system rewards those who already hold property and penalizes those trying to enter.
Code Block:
# Build monthly payment pressure index
pay = monthly_payment_index(home_m, rate_m)
pay_i = to_index(pay, base_date=pd.Timestamp("2000-01-01"))
🧠 Insight Box:
The dream of ownership did not vanish. It changed its gatekeepers. Timing and assets now matter more than wages and effort.
⚠️ Structural Alert:
Housing policy that assumes productivity leads to ownership is outdated. In today’s market, incumbency creates wealth and wages barely keep pace. The structure rewards holding property, not building it.
G2. Student Loans Took Over Where Income Stopped Growing
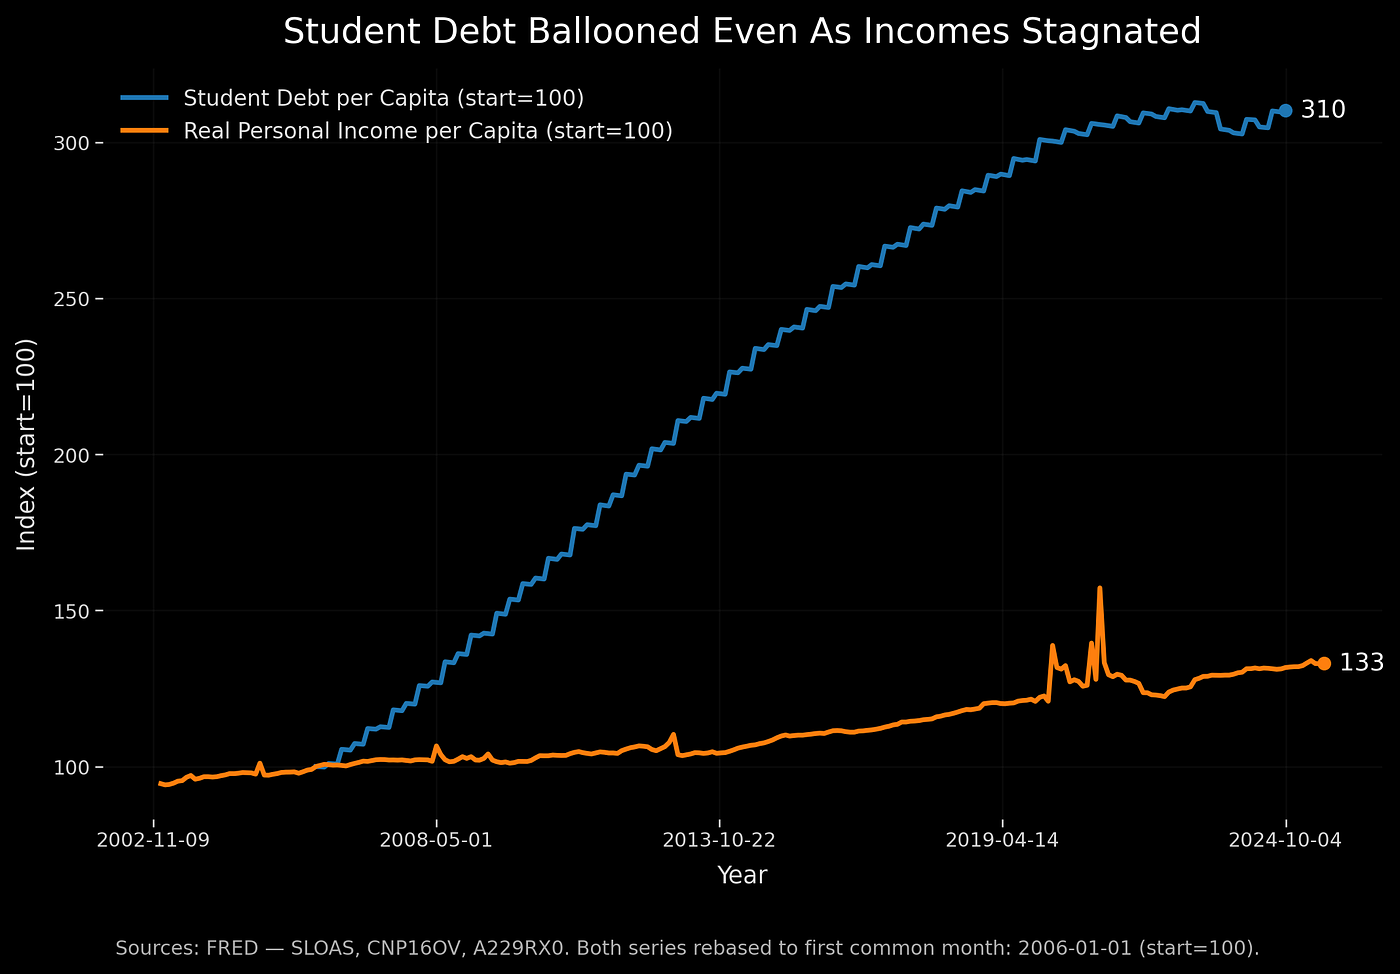
Graph 2) Student Debt Ballooned Even As Incomes Stagnated
Key Insight:
Student debt was once framed as an investment in the future, a temporary weight that would be offset by higher wages and professional stability. That promise broke down.
- Since 2006, student debt per capita has soared by 210 percent, while real income barely grew 33 percent. The gap is not just numerical, it is structural.
- For Millennials, loans were a heavy but plausible bridge into the middle class. For Gen Z, they function more like a subscription fee for entering the economy itself, a recurring cost with no cancellation button.
- Unlike mortgages, which at least build equity, education loans often outlive their economic return. A generation now begins adult life with negative net worth, watching compound interest work against them rather than for them.
- The opportunity cost is immense. Every extra dollar sent to a loan servicer is a dollar not invested in retirement, not saved for a down payment, not circulated into the local economy.
What was once marketed as mobility has hardened into immobility. Debt has ceased to be a stepping stone. It has become a moat, and the castle on the other side — stable employment and ownership — keeps pulling further away.
Code Block:
# Calculate debt per capita
student_debt_pc = (debt_m["value"] * 1_000_000_000) / (pop_m["value"] * 1_000)
🧠 Insight Box:
Debt today does not only borrow from future income. It borrows from future trust in institutions. A society that turns education into a liability corrodes the very belief that effort leads to mobility.
⚠️ Structural Alert:
Federal backing of student loans without wage-linked tuition caps created a market where tuition floats upward without limit, while the payoff potential remains anchored to stagnant wages.
G3. Rent Is the New Tax on the Poor
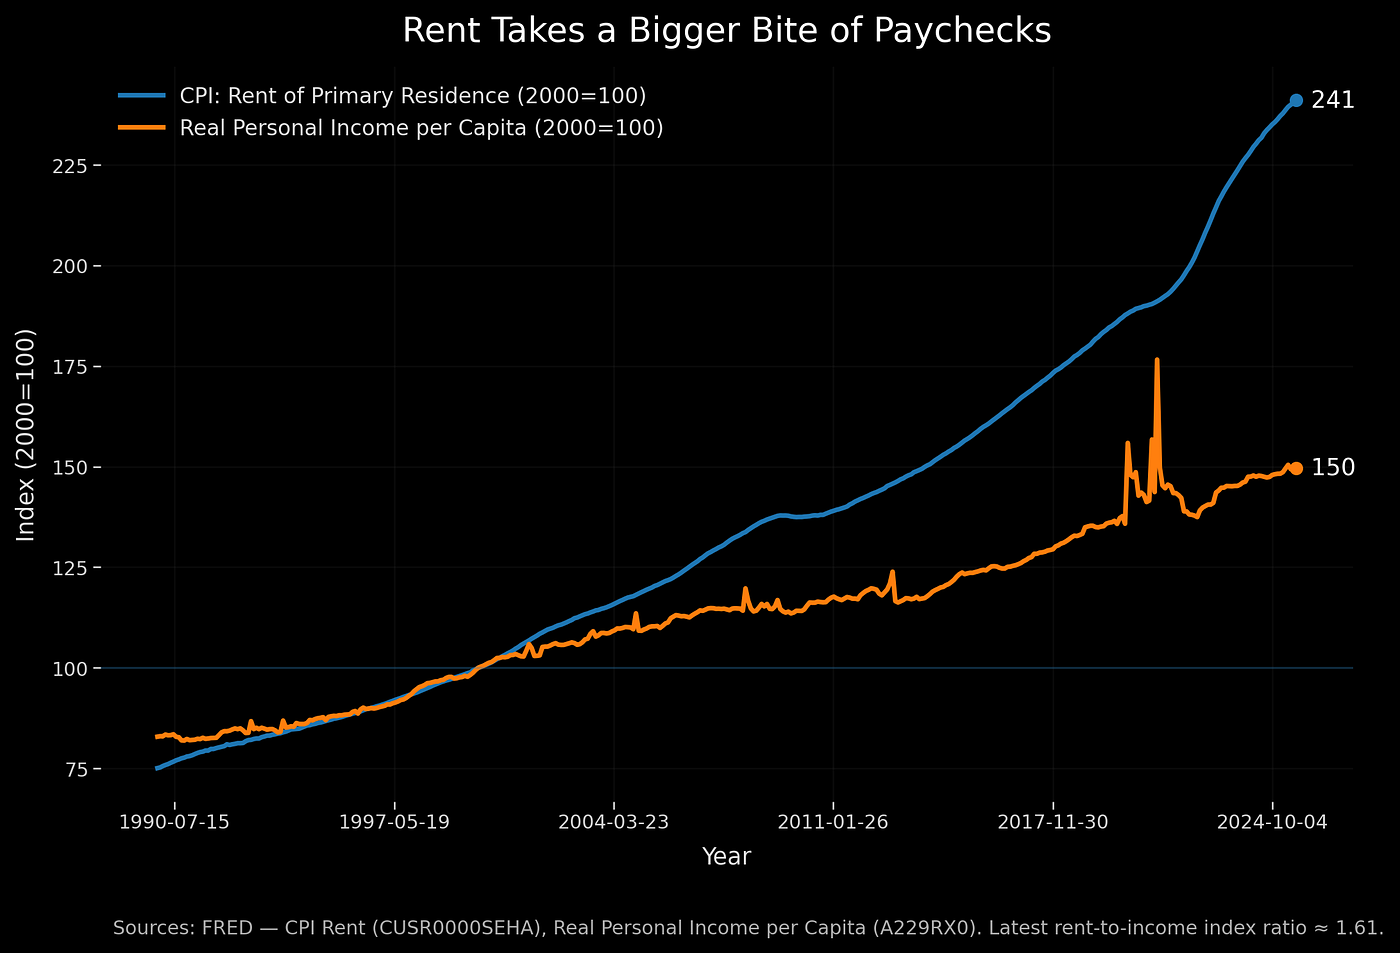
Graph 3) Rent Takes a Bigger Bite of Paychecks
Key Insight:
Rent has always been part of the cost of living, but in the twenty-first century it has become something more corrosive. It is no longer just the price of shelter. It is the toll exacted for being locked out of ownership.
- Since 2000, rent costs have climbed nearly 2.5 times, while income only rose about 50 percent. The imbalance compounds silently each month.
- Millennials entered adulthood during a housing boom, often missing the window to buy before prices soared. Gen Z entered during a rent surge, facing record-high monthly costs that prevent them from saving toward ownership at all.
- The rent-to-income index ratio now sits at 1.61x, the highest in modern history. That means the average renter is committing a far larger share of wages to housing than their parents ever did, without gaining equity in return.
- Rent payments vanish into a system that rewards landlords and asset holders. Unlike a mortgage, which converts monthly outflows into long-term equity, rent functions as a permanent transfer of wealth upward.
This is why rent has been called a “shadow tax.” It does not appear in federal tables, but it drains wealth more relentlessly than most visible levies. And unlike income taxes, it does not scale progressively with ability to pay. It scales regressively with exclusion from ownership.
Code Block:
# Rent-to-income ratio calculation
merged["rent_income_ratio"] = merged["index_x"] / merged["index_y"]
🧠 Insight Box:
Rent is not just shelter cost. It is an extraction mechanism that continuously transfers wealth from those without property to those who already hold it.
⚠️ Structural Alert:
Economic policy often treats rent as one CPI component among many. But rent burden is not a matter of inflation. It is a structural imbalance in asset distribution. Policies that address rent only as “price movement” ignore its true role: the invisible engine of inequality.
G4. The Down Payment Dream Is Slipping Away
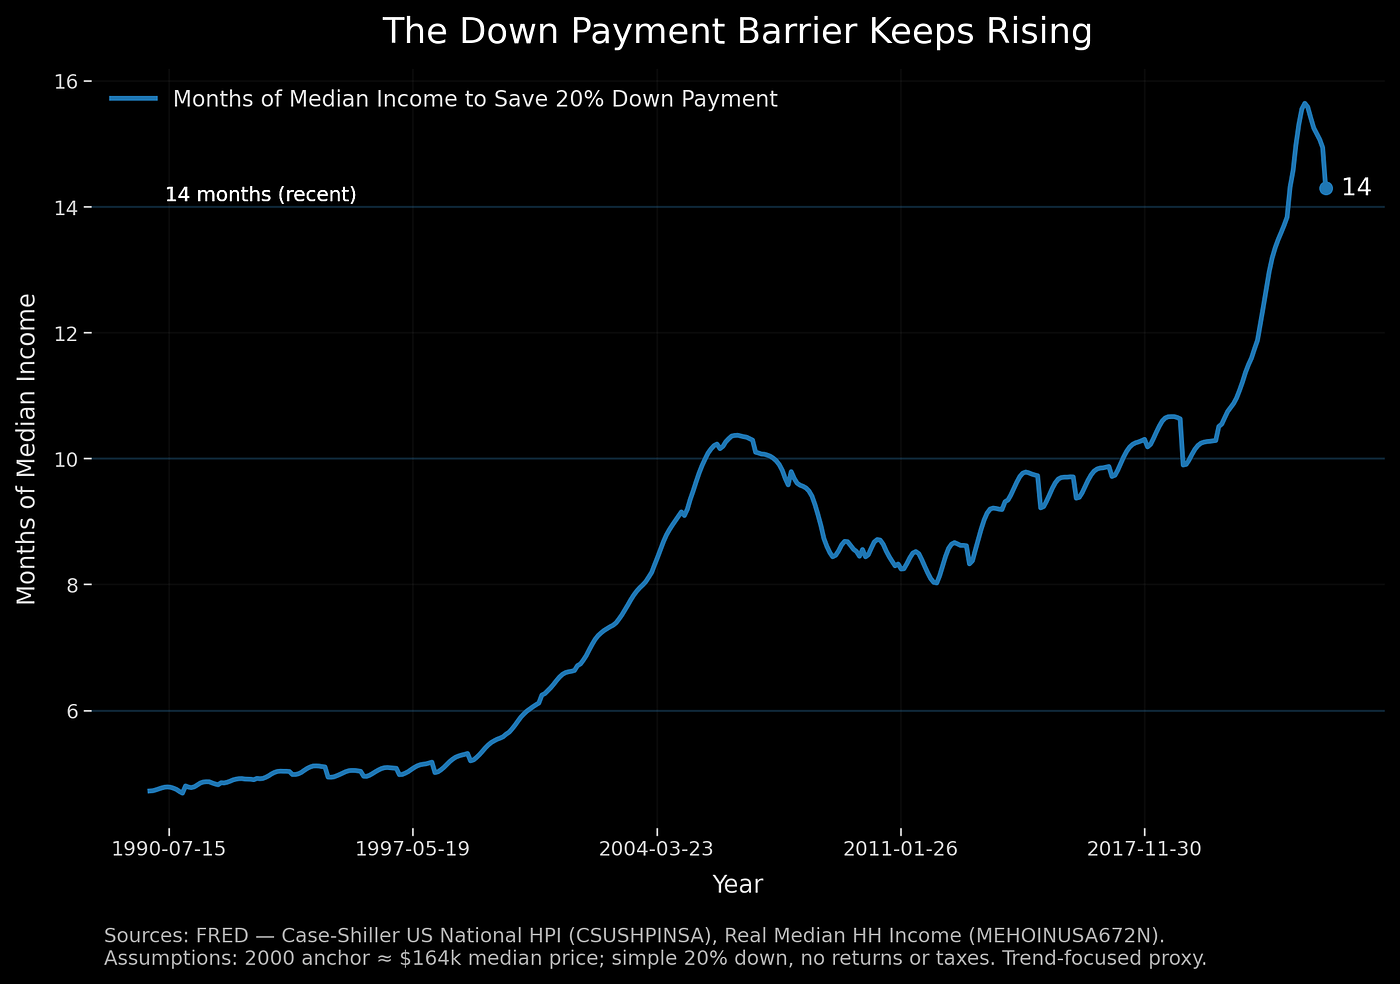
Graph 4) The Down Payment Barrier Keeps Rising
Key Insight:
For much of the twentieth century, the down payment was a hurdle that discipline and savings could realistically overcome. Today, it has morphed into a barrier that moves faster than most people can chase it.
- In the 1990s, saving for a 20 percent down payment required the equivalent of 5 months of household income. By 2024, that figure ballooned to 14 months.
- The difference is not only mathematical. It is psychological. For Millennials, the goal of homeownership felt just barely out of reach, something that could be clawed toward with sacrifice. For Gen Z, the goal feels more like a mirage, drifting farther the closer one walks.
- Inflation and wage stagnation widened the gap, but asset inflation is the real culprit. As housing prices raced ahead, the time-based cost of entry multiplied, converting years of effort into little visible progress.
- The deeper effect is the erosion of future planning. A household saving for a down payment cannot easily save for retirement, invest in skills, or even weather medical emergencies. The down payment barrier is not just about homes. It diverts resources away from every other dimension of life stability.
In effect, the barrier is no longer just a financial checkpoint. It has become a structural filter, sorting who enters ownership based on inheritance, early asset timing, or family transfers rather than effort alone.
Code Block:
merged["months_of_income"] = (
    merged["down_payment"] / (merged["real_median_hh_income_annual"] / 12.0)
🧠 Insight Box:
The barrier is not locked. It is simply moving faster than wages. In practice, that is the same as a lock for most households.
⚠️ Structural Alert:
Traditional models assume that income is the bottleneck to ownership. Today, the bottleneck is time itself. Every year that passes without entry multiplies the disadvantage, making generational inequality self-reinforcing.
4. Why This Matters: Real-World Impacts
Numbers are never just numbers. They reappear in budgets, in risk models, and in family choices. Here are two sectors where these generational shifts matter deeply:
Healthcare and Insurance
High debt-to-asset ratios reshape how risk is priced. Insurers already use financial stress scores as proxies for health outcomes. A generation carrying disproportionate student debt and rent burden looks more volatile on actuarial tables. This means higher health insurance premiums, stricter credit terms, and higher life insurance rates. The wealth gap feeds directly into a health gap.
The logic is circular. Stress and financial insecurity worsen actual health, which then validates the higher risk scores. For Millennials and Gen Z, debt is not just an entry fee into education. It is an anchor that drags health and financial security together.
Urban Policy and Housing
City budgets are shaped by assumptions about rent burdens. If rent consumes 40 percent of young workers’ income, that leaves less spending power for local consumption and less tax revenue for municipalities. Infrastructure funding models based on stable middle-class homeownership become outdated.
The consequences cascade. Transportation planning becomes mismatched when younger residents are renters without cars. School funding falls when young families cannot afford to settle in one place. Labor mobility erodes when moving costs include not just rent deposits but also the loss of fragile healthcare or childcare arrangements.
⚠️ Structural Alert:
Metrics that ignore wealth composition inevitably generate policies that preserve stability at the top while deepening precarity at the bottom. Averages hide the generational fractures shaping the economy.
5. What Analysts Should Do Differently
🔍 Method Note:
The wrong question is “what went up or down.” The right question is “what got harder.” Indexes are directional, but inequality is relational.
Common PlotBetter Paired AnalysisDebt over timeDebt vs income by cohortRent CPIRent vs wage indexWage growthWage vs mortgage pressure index
💡 Portfolio Tip:
Tell stories through constraints. A powerful exercise: ask “If I were born 20 years later, what would this plot mean to me?” That reframing turns technical charts into living signals of inequality.
🧠 Insight Box:
Data does not just record history. It encodes the future, and the future belongs to those who can interpret constraint rather than simply count growth.
6. Conclusion: The Future Is Already Speaking
This analysis is not a generational complaint. It is a structural diagnosis.
Gen Z did not lose the game. The game added rules without announcing them. Debt replaced wages as the gatekeeper. Rent replaced savings as the tax on existence. The down payment stretched out until the gate became invisible.
The future does not arrive in a single dramatic event. It leaks slowly through numbers. And sometimes, when I analyze data, it feels less like looking back at the past and more like the future itself transmitting signals to us, warnings encoded in numbers that we are only beginning to decipher.
🧠 Insight Box:
Collapse does not always take the form of a crash. Sometimes it takes the form of a freeze: a generation frozen out of ownership, frozen out of upward mobility, and frozen in its trust toward institutions.
Yet acknowledging the freeze does not mean surrendering to it. If structures can produce barriers, they can also be redesigned to open doors again.
Housing policy can shift from privileging ownership to ensuring stability through long-term rental security.
Education financing can be linked to future wages rather than abstract interest tables.
Even more importantly, younger generations may redefine what stability means, experimenting with cooperative housing, shared assets, and new forms of wealth that are not tethered to the twentieth-century model of the single-family home.
Hope does not come from returning to a past that no longer exists. It comes from rewriting the terms of stability itself. If one generation cannot inherit the old dream, it has the power to invent a new one.
Stay Connected with AriaData
If this project sparked your curiosity, there’s more to explore:
- **Want more real-world data stories?** Subscribe on Substack for weekly deep dives.
- **Need visuals and insights for your portfolio or team?** Download the full report on Gumroad.
- **Looking for custom impact content?** Explore AriaData’s B2B storytelling services.
“Data is everywhere. But insight is rare. Let’s tell better stories.” — AriaData

AriaData
메타데이터
- post_id
- 97c6fe5c4506
- slug
- they-bought-homes-we-bought-loans-a-data-driven-look-at-millennial-vs-gen-z-wealth-gaps-97c6fe5c4506
- url
- https://medium.com/@ariadata/they-bought-homes-we-bought-loans-a-data-driven-look-at-millennial-vs-gen-z-wealth-gaps-97c6fe5c4506
- canonical_url
- https://medium.com/@ariadata/they-bought-homes-we-bought-loans-a-data-driven-look-at-millennial-vs-gen-z-wealth-gaps-97c6fe5c4506
- author_url
- https://medium.com/@ariadata
- status
- ok
- fetched_at
- 2026-07-17 20:17:52