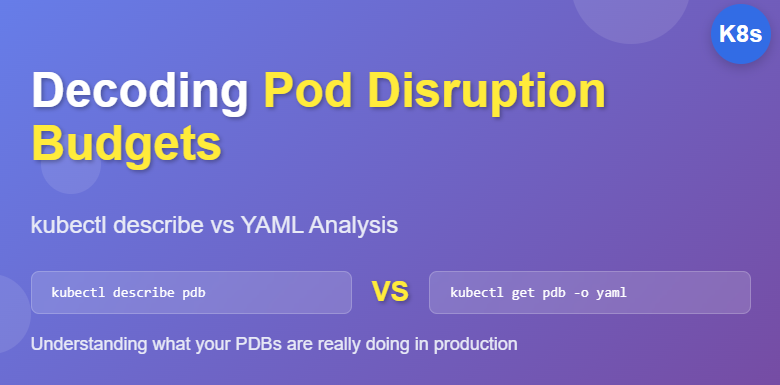
Decoding Pod Disruption Budgets: A Complete Analysis of kubectl describe vs YAML Output
Understanding what your PDBs are really doing in production
Decoding Pod Disruption Budgets: A Complete Analysis of kubectl describe vs YAML Output
Understanding what your PDBs are really doing in production
In my previous article about Pod Disruption Budgets, I covered the basics of why you need them and how to configure them. Today, let’s dive deeper into understanding what your PDBs are actually doing in production by analyzing real kubectl output from a live AKS cluster.
We’ll examine both the kubectl describe output and the full YAML manifests for six critical PDBs protecting system components. This comparison will help you understand not just what PDBs do, but how to interpret their status and troubleshoot issues when they arise.
The Power of Two Perspectives
When working with PDBs, you have two primary ways to inspect them:
**kubectl describe pdb** - Gives you a human-readable summary focused on current status

**kubectl get pdb -o yaml** - Shows the complete resource definition with full metadata and detailed status
Both views are essential for different scenarios. Let’s explore through real examples.

Critical Infrastructure: CoreDNS PDB
The Quick View: kubectl describe
Name:           coredns-pdb
Namespace:      kube-system
Min available:  1
Selector:       k8s-app=kube-dns
Status:
  Allowed disruptions:  1
  Current:             2
  Desired:             1
  Total:               2
Events:                <none>
This tells us the essentials: CoreDNS has 2 pods running, needs at least 1, and currently allows 1 disruption. Clean and simple.
The Complete Picture: YAML Output
apiVersion: policy/v1
kind: PodDisruptionBudget
metadata:
  annotations:
    kubectl.kubernetes.io/last-applied-configuration: |
      {"apiVersion":"policy/v1","kind":"PodDisruptionBudget"...}
  labels:
    addonmanager.kubernetes.io/mode: Reconcile
  name: coredns-pdb
  namespace: kube-system
  resourceVersion: "16538552"
status:
  conditions:
  - lastTransitionTime: "2025-07-08T13:30:32Z"
    message: ""
    observedGeneration: 1
    reason: SufficientPods
    status: "True"
    type: DisruptionAllowed
  currentHealthy: 2
  desiredHealthy: 1
  disruptionsAllowed: 1
  expectedPods: 2
  observedGeneration: 1
The YAML reveals critical details the describe output omits:
- Management: The
addonmanager.kubernetes.io/mode: Reconcilelabel shows this PDB is managed by AKS itself - History: The
lastTransitionTimeshows when the PDB last changed states - Conditions: The
DisruptionAllowed: Truecondition withSufficientPodsreason confirms healthy status - Generation tracking:
observedGeneration: 1helps detect if the controller has processed recent changes
Why this matters: If CoreDNS PDBs start failing, you’d see the condition change to DisruptionAllowed: False with reasons like InsufficientPods. The timestamp helps correlate issues with cluster events.

Observability: Metrics Server PDB
The Quick View
Name:           metrics-server-pdb
Namespace:      kube-system
Min available:  1
Selector:       k8s-app=metrics-server
Status:
  Allowed disruptions:  1
  Current:             2
  Desired:             1
  Total:               2
Events:                <none>
Identical pattern to CoreDNS — 2 pods, need 1, can disrupt 1.
The Deep Dive: YAML Analysis
status:
  conditions:
  - lastTransitionTime: "2025-07-18T14:24:31Z"
    message: ""
    observedGeneration: 1
    reason: SufficientPods
    status: "True"
    type: DisruptionAllowed
  currentHealthy: 2
  desiredHealthy: 1
  disruptionsAllowed: 1
  expectedPods: 2
Key insight: Notice the lastTransitionTime is much more recent (July 18th vs July 8th for CoreDNS). This suggests the metrics-server PDB experienced a state change more recently, possibly during a pod restart or scaling event.
Pro tip: When troubleshooting HPA issues, check if the metrics-server PDB shows recent state changes. A DisruptionAllowed: False status here means your autoscaling is broken.
Cloud Integration: Azure Workload Identity PDB
The Summary View
Name:           azure-wi-webhook-controller-manager
Namespace:      kube-system
Min available:  1
Selector:       azure-workload-identity.io/system=true,kubernetes.azure.com/managedby=aks
Status:
  Allowed disruptions:  1
  Current:             2
  Desired:             1
  Total:               2
Events:                <none>
Notice the more complex selector — this PDB uses multiple labels for precise targeting.
The Full Context: YAML Deep Dive
metadata:
  annotations:
    meta.helm.sh/release-name: aks-managed-workload-identity
    meta.helm.sh/release-namespace: kube-system
  labels:
    app.kubernetes.io/managed-by: Helm
    azure-workload-identity.io/system: "true"
    helm.toolkit.fluxcd.io/name: workload-identity-adapter-helmrelease
    helm.toolkit.fluxcd.io/namespace: 6*********4ed00012eca0a
    kubernetes.azure.com/managedby: aks
spec:
  selector:
    matchLabels:
      azure-workload-identity.io/system: "true"
      kubernetes.azure.com/managedby: aks
Critical discoveries from the YAML:
- Helm management: The
meta.helm.shannotations show this is deployed via Helm - FluxCD integration: The
helm.toolkit.fluxcd.iolabels indicate GitOps management - Dual ownership: Both AKS and Helm manage this component
- Precise targeting: The selector uses two labels to avoid conflicts with other workload identity components
Why this matters: If your Azure pod identities start failing, check this PDB’s status. The complex management chain (GitOps → Helm → AKS) means issues could come from multiple sources.

Application Gateway: Ingress Controller PDB
The Quick Overview
Name:           ingress-ingress-nginx-controller
Namespace:      ingress
Min available:  1
Selector:       app.kubernetes.io/component=controller,app.kubernetes.io/instance=ingress,app.kubernetes.io/name=ingress-nginx
Status:
  Allowed disruptions:  1
  Current:             2
  Desired:             1
  Total:               2
Events:                <none>
Standard pattern, but note the three-label selector for precise ingress controller targeting.
The Detailed Analysis
metadata:
  labels:
    app.kubernetes.io/component: controller
    app.kubernetes.io/instance: ingress
    app.kubernetes.io/managed-by: Helm
    app.kubernetes.io/name: ingress-nginx
    app.kubernetes.io/part-of: ingress-nginx
    app.kubernetes.io/version: 1.10.1
    argocd.argoproj.io/instance: ingress
    helm.sh/chart: ingress-nginx-4.10.1
spec:
  selector:
    matchLabels:
      app.kubernetes.io/component: controller
      app.kubernetes.io/instance: ingress
      app.kubernetes.io/name: ingress-nginx
Key insights:
- Version tracking:
app.kubernetes.io/version: 1.10.1andhelm.sh/chart: ingress-nginx-4.10.1help track versions - ArgoCD deployment: The
argocd.argoproj.io/instancelabel shows GitOps deployment - Multi-component app: The
app.kubernetes.io/part-oflabel indicates this is part of a larger ingress system
Troubleshooting gold: If external traffic stops reaching your applications, check if this PDB’s status shows DisruptionAllowed: False. That would indicate insufficient healthy ingress pods.
Data Layer: Elasticsearch PDB
The Basic Status
Name:           elastic-es-default
Namespace:      elastic
Min available:  1
Selector:       elasticsearch.k8s.elastic.co/cluster-name=elastic
Status:
  Allowed disruptions:  1
  Current:             2
  Desired:             1
  Total:               2
Events:                <none>
Simple selector focusing just on cluster name.
The Operator-Managed Reality
metadata:
  labels:
    common.k8s.elastic.co/template-hash: "2299029585"
    common.k8s.elastic.co/type: elasticsearch
    elasticsearch.k8s.elastic.co/cluster-name: elastic
  ownerReferences:
  - apiVersion: elasticsearch.k8s.elastic.co/v1
    blockOwnerDeletion: true
    controller: true
    kind: Elasticsearch
    name: elastic
    uid: cf7***bc1-****-****-****-c0*****3894d
status:
  conditions:
  - lastTransitionTime: "2025-07-19T17:53:57Z"
    observedGeneration: 4
Operator magic revealed:
- Owner references: Shows this PDB is automatically managed by the Elasticsearch operator
- Template hash: The
template-hashlabel helps the operator track PDB versions - Recent activity: The very recent
lastTransitionTime(July 19th) andobservedGeneration: 4suggest active cluster management
Pro insight: Operator-managed PDBs like this often change more frequently than manually created ones. If your Elasticsearch cluster is having issues, check if the PDB’s observedGeneration is incrementing rapidly - it might indicate the operator is struggling with cluster stability.
Network Connectivity: Konnectivity Agent PDB
The Summary
Name:           konnectivity-agent
Namespace:      kube-system
Min available:  1
Selector:       app=konnectivity-agent
Status:
  Allowed disruptions:  1
  Current:             2
  Desired:             1
  Total:               2
Events:                <none>
Simple selector, critical function.
The Full Picture
Looking at the YAML status (following the same pattern as others), this PDB maintains the connection between the AKS control plane and worker nodes.
Critical insight: If you suddenly can’t run kubectl logs, kubectl exec, or kubectl port-forward, check this PDB's status. A DisruptionAllowed: False state here means you've lost connectivity between control plane and nodes.
Reading Between the Lines: Status Analysis Patterns
Healthy PDB Indicators
All our PDBs show these healthy patterns:
**DisruptionAllowed: True** - PDB is not blocking maintenance**reason: SufficientPods** - Enough pods are running**currentHealthy >= desiredHealthy** - Math checks out**disruptionsAllowed > 0** - Cluster can perform maintenance
Warning Signs to Watch For
Look for these patterns that indicate problems:
status:
  conditions:
  - lastTransitionTime: "2025-07-20T10:30:00Z"
    message: "Disruption budget elastic-es-default allows no pod eviction"
    reason: InsufficientPods
    status: "False"
    type: DisruptionAllowed
  currentHealthy: 1
  desiredHealthy: 2  # This is bad!
  disruptionsAllowed: 0
This would indicate:
- Only 1 pod healthy, but need 2 minimum
- No disruptions allowed (maintenance blocked)
- Recent state change suggests ongoing issues

Practical Troubleshooting Workflow
When PDBs cause issues, follow this analysis pattern:

1. Quick Health Check
kubectl get pdb -A
# Look for: 0 in ALLOWED DISRUPTIONS column
2. Detailed Status Analysis
kubectl describe pdb problematic-pdb -n namespace
# Check: Current vs Desired pod counts
3. Deep Dive Investigation
kubectl get pdb problematic-pdb -n namespace -o yaml
# Check: conditions, timestamps, generation numbers
4. Cross-Reference with Pods
kubectl get pods -l selector-labels --show-labels
# Verify: PDB selector actually matches running pods
The Management Story: Who Owns What
From our YAML analysis, we can see the management hierarchy:

- AKS-Managed (CoreDNS, Konnectivity, Metrics-Server, Azure WI)
- Automatically created and maintained
- Don’t modify these directly
2. Helm-Deployed (Ingress Controller)
- Managed through Helm charts
- Modify via chart values
3. Operator-Controlled (Elasticsearch)
- Created by Kubernetes operators
- Modify via CRDs, not PDBs directly
4. GitOps-Deployed (Various)
- ArgoCD/FluxCD labels indicate automated deployment
- Changes should go through Git workflow
Key Takeaways
**kubectl describe** is perfect for quick status checks and daily operations- YAML output reveals the full story — ownership, history and detailed conditions
- Timestamps and generations help correlate PDB state changes with cluster events
- Management labels tell you who owns the PDB and how to modify it safely
- Condition reasons provide specific troubleshooting direction
Understanding both views transforms PDBs from mysterious YAML files into powerful debugging tools. The next time your cluster maintenance hangs or your applications go down during updates, you’ll know exactly where to look and what the output means.
Your PDBs are working hard to protect your applications — now you know how to understand what they’re telling you.
메타데이터
- post_id
- cffd15da4c1f
- slug
- decoding-pod-disruption-budgets-a-complete-analysis-of-kubectl-describe-vs-yaml-output-cffd15da4c1f
- url
- https://medium.com/@sridharcloud/decoding-pod-disruption-budgets-a-complete-analysis-of-kubectl-describe-vs-yaml-output-cffd15da4c1f
- canonical_url
- https://medium.com/@sridharcloud/decoding-pod-disruption-budgets-a-complete-analysis-of-kubectl-describe-vs-yaml-output-cffd15da4c1f
- author_url
- https://medium.com/@sridharcloud
- status
- ok
- fetched_at
- 2026-06-21 07:44:09