Duke’s 45.4% Cut Rate Makes Marketing Name the Dollars
The 2026 CMO Survey shows marketing gets cut first when profit misses expose who can prove revenue movement.
Budget Proof
Duke’s 45.4% Cut Rate Makes Marketing Name the Dollars
The 2026 CMO Survey shows marketing gets cut first when profit misses expose who can prove revenue movement.

Duke’s 45.4% Cut Rate Makes Marketing Name the Dollars. Image created by the author with diffusion-synthesis and Python post-processing.
Duke’s 2026 CMO Survey reads less like a dashboard than a folder slid across a conference table: when executives choose cuts, marketing expenses take the hit 45.4% of the time. If your model cannot point to the dollars that move, finance can approve the loss before the report finishes loading.
That is the squeeze on founder-led CEOs, CMOs, and growth leaders in 2026. The Duke Spring 2026 Highlights and Insights Report says 53.1% of executives focus on cutting expenses when profits miss expectations, up from 46% one year earlier. Google’s Scenario Planner announcement shows the decision gap from the other side: nearly 40% of surveyed marketers struggle to connect marketing mix model outputs to real-world business decisions, with Google citing Harvard Business Review Analytic Services from October 2025.
The bar chart wears cufflinks, but it still cannot sign.
The Dashboard Does Not Own the Dollar
Duke’s number matters because it strips the romance from measurement. The problem is not whether marketing has enough reports. Most teams have a small museum of them: attribution dashboards, channel scorecards, media mix slides, vendor exports, and one heroic spreadsheet with too many tabs and one exhausted owner.
The problem is what happens when profit pressure enters the room. Duke’s 35th edition surveyed 308 marketing leaders at for-profit U.S. companies, with 97% at VP level or above. These are not interns guessing from a Slack poll.
They are the people who have to defend spend when the room stops admiring growth language and starts asking what can be removed by Friday.
The survey says marketing budgets fell to 9.0% of company revenue and 9.6% of overall budgets. Overall marketing spending grew only 1.7% over the prior 12 months, the smallest increase since 2021. That leaves less room for heroic ambiguity.
A dashboard that once looked like proof now has to act like an operating document.
This is where incentives get ugly. Finance rewards claims that name a tradeoff. Marketing often arrives with claims that name contribution.
Those are related, but they are not the same object. Contribution says a channel helped. A tradeoff says this dollar leaves paid social, this dollar enters YouTube, this target changes, and this executive owns the miss.
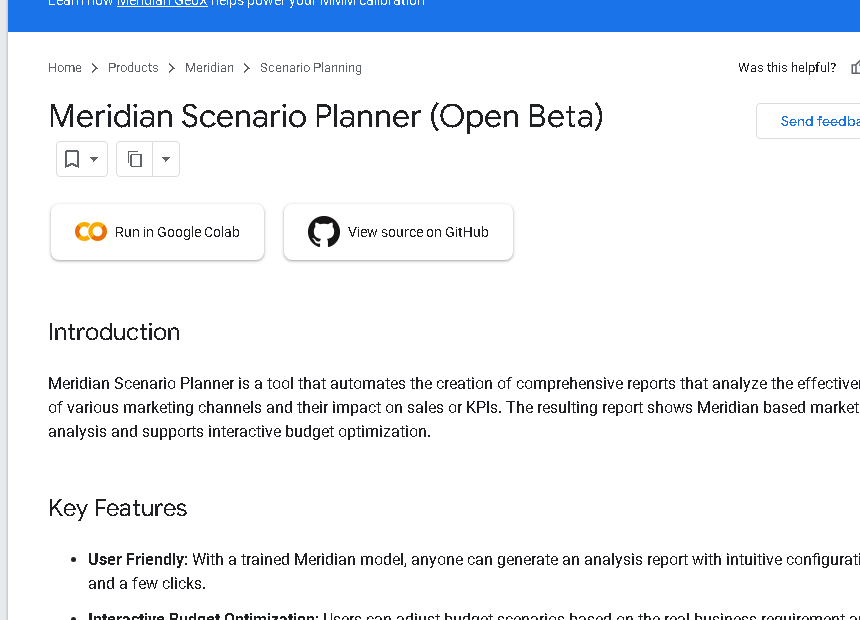
Figure 2. Proof of operating detail: The cited source, Meridian Scenario Planner documentation, gives the article the implementation surface teams must design around. Source: Google
A model without a signer becomes a cut target.
Duke adds another warning light. The CMO-CFO partnership scored only 4.5 on a 7-point scale for building a business case for marketing spending, and fewer than half of companies report marketing and finance working together on growth. That is not a personality problem.
It is a decision-rights problem wearing a quarter-zip.
Meridian Moves the Fight to the Slider
Google’s Meridian work is interesting because it moves the conversation from proof after the fact toward allocation before the bet. In January 2025, Google made Meridian available to everyone, framing it as an open-source marketing mix model built for budget decisions across modern channels.
The 2026 move is more direct. Scenario Planner is a user-facing interface for budget scenarios and real-time ROI estimates, no coding required. That sentence carries the whole story.
The expensive specialist model is being pulled closer to the person who has to approve the spend.
The Meridian Scenario Planner documentation, updated May 15, 2026, shows the object finance will care about: fixed and flexible budget constraints, target total ROI, target channel marginal ROI, channel spend bounds, optimized budget allocation, and response curves where the current spend and optimized spend become visible points.
That is progress. It also creates a sharper failure mode.
When a tool can show a recommended spend change by channel, the organization loses the old excuse that the model was too technical to discuss. The slider is now a small political machine. It asks which channel loses, which channel gains, what constraint was chosen, and who accepts the downside if the curve was too flattering.
Google is also bringing Meridian into Google Analytics 360, with predictive scenarios meant to guide smarter investments. That is product-market evidence that the measurement market has moved. The old fight was whether MMM could survive privacy changes and fragmented channels.
The new fight is whether MMM can survive a budget meeting.
The Budget Memo Beats the Model
The practical test is almost rude in its simplicity: can the dashboard produce a budget memo?
Not a 42-slide readout. Not a victory lap over attribution accuracy. A budget memo.
One page. Current spend, proposed spend, expected incremental outcome, constraints, owner, downside risk, and the date when the decision gets checked.
If the answer is no, the team does not have budget proof. It has measurement theater with better fonts.
The memo should answer these questions before finance asks them aloud:
-
The model names which dollars move, not only which channel performed.
-
The recommendation shows the constraint, such as fixed budget, flexible budget, target total ROI, or target channel marginal ROI.
-
The downside is written in plain money terms, not buried inside confidence intervals.
-
One executive owns the decision, and one metric defines a miss.
-
The rollback date is set before the spend moves, not after the apology deck appears.
That list is not bureaucracy. It is a game-theory repair. If everyone benefits from a good outcome and nobody owns a bad one, the rational behavior is to approve vague proof and argue later.
The memo changes the payoff. It makes authority visible before cash moves.
It also stops the oldest marketing argument from resurfacing in nicer clothes. Brand wants patience. Performance wants credit.
Finance wants a number that survives a miss. The budget memo does not settle every philosophical fight. It forces the fight onto one object that can be inspected.
That is the budget your dashboard can’t defend when the model stops at insight. The room does not cut marketing because every marketer is wrong. It cuts marketing because weak proof creates a low-friction savings target.
Ask for the Signer Before the Score
Before buying another measurement tool or approving another MMM project, leaders should ask a harder question than accuracy. Ask who gets the authority to move money when the model speaks.
A high-fit model can still be useless if it cannot cross that threshold. Google’s own documentation warns that model fit does not finish causal inference, because the unobserved baseline still matters. That warning belongs in the budget room, not only in the analyst’s notebook.
A clean expected-versus-actual chart can comfort the room while the baseline quietly steals the credit.
The operating move is straightforward. Pick one active budget decision and run it through the signer test. Choose a real reallocation, not a toy example.
Put the current channel spend next to the optimized recommendation. Write the constraint. Write the risk.
Write the owner. If the team cannot complete the memo in one meeting, the blocker is not analytics maturity. The blocker is authority.
Duke shows why that blocker has a price. When profits miss, marketing is already close to the knife. Google shows why the tool market is rushing toward scenario planning and no-code allocation.
Put those together and the lesson is blunt: measurement only protects money when it becomes a decision someone can defend.
If the dashboard cannot move a named dollar with a named owner, it is not evidence in a budget room; thank you for doing the harder work before the 45.4% line does it for you.
Figure 3. Proof of research footing: The cited source, Duke Spring 2026 Highlights and Insights Report, gives the article external evidence instead of campaign language. Source: Duke
Related reading
메타데이터
- post_id
- e66e77675bfc
- slug
- dukes-45-4-cut-rate-makes-marketing-name-the-dollars-e66e77675bfc
- url
- https://medium.com/kairi-ai/dukes-45-4-cut-rate-makes-marketing-name-the-dollars-e66e77675bfc
- canonical_url
- https://medium.com/kairi-ai/dukes-45-4-cut-rate-makes-marketing-name-the-dollars-e66e77675bfc
- author_url
- https://medium.com/@james.kuhman
- status
- ok
- fetched_at
- 2026-07-09 00:50:33