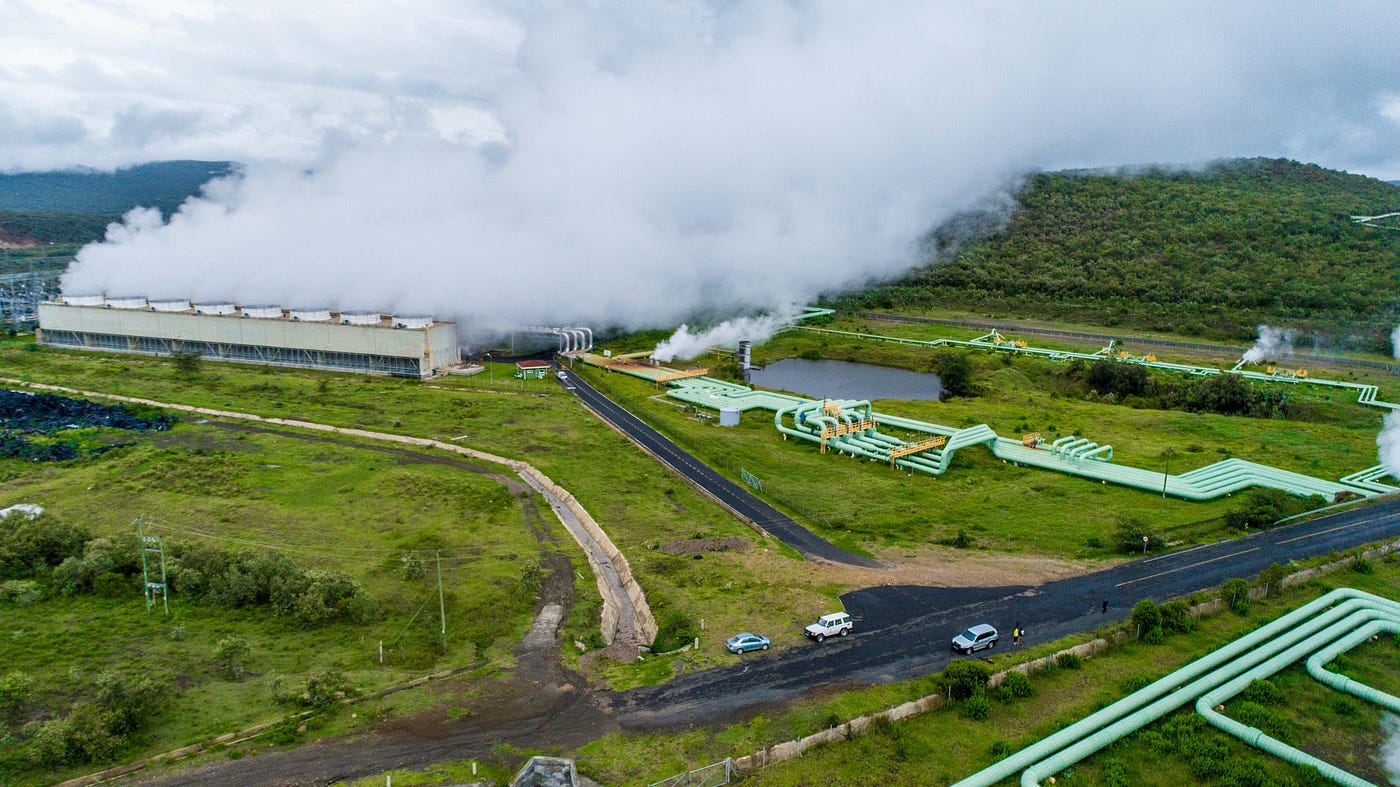
The Worst Climate News of the Year Is a Patch of Cold Water
A weakening AMOC left one blue scar on the map — and its consequences run pole to pole
The Worst Climate News of the Year Is a Patch of Cold Water
A weakening AMOC left one blue scar on the map — and its consequences run pole to pole
The Worst Climate News of the Year Is a Patch of Cold Water (photo by author)
Pull up NASA’s temperature map of the last 145 years and the planet glows like a stove ring. The Arctic burns dark red while the oceans simmer in orange. And then, south of Greenland and Iceland, west of the British Isles, there is a patch of blue. One single patch. The only region of the world ocean that has cooled significantly since the 19th century, while everything around it has heated.
I have crossed that water by ferry. From the deck it looks like any other gray Atlantic swell, indistinguishable from the sea outside Reykjavík or Bergen. The map says this is the strangest place on Earth.
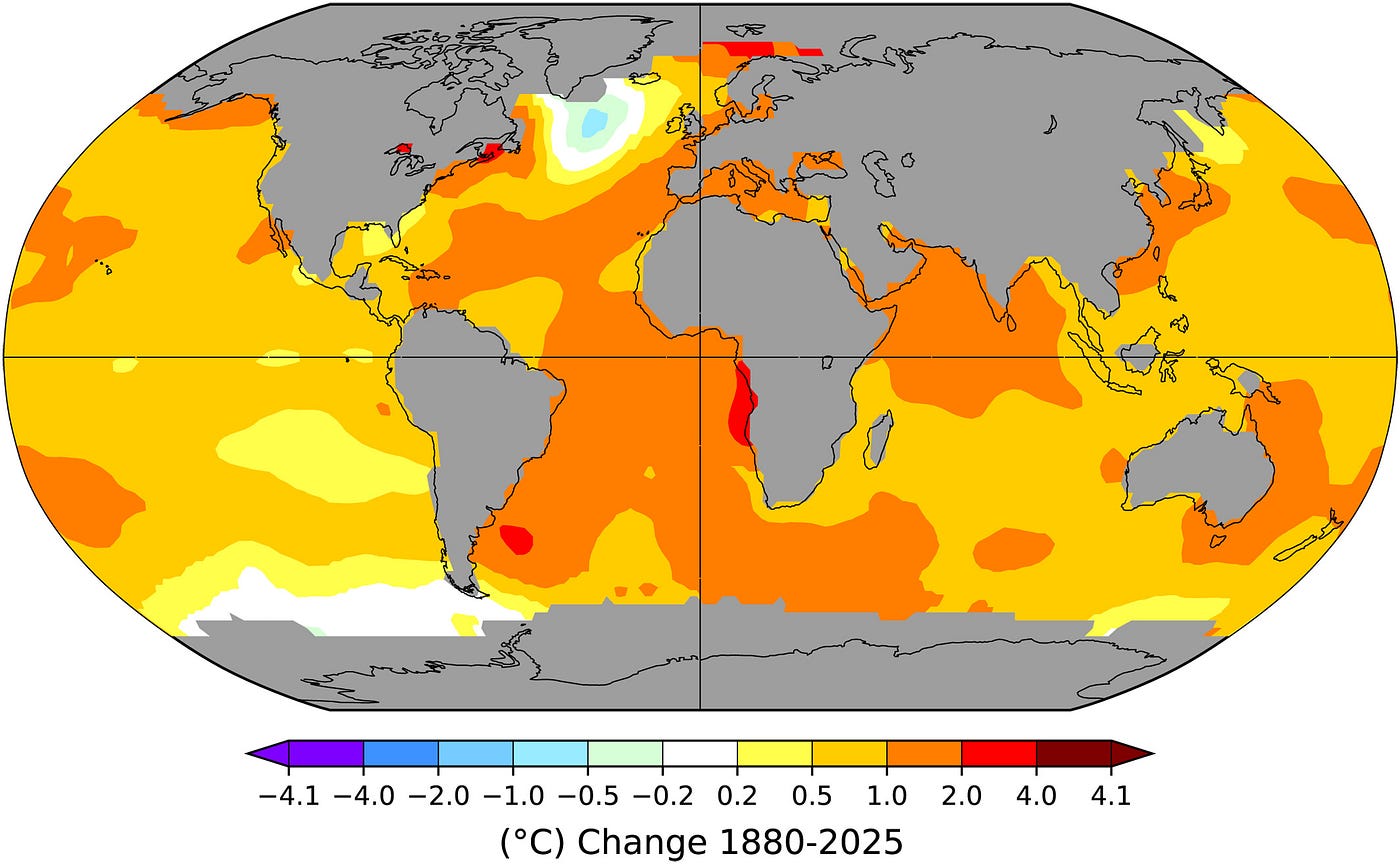
Sea-surface temperature linear trend (°C) from 1880 to 2025, NASA GISTEMP data (Source: Multidecadal Atlantic “Warming Hole” Heat Content Variations Are Caused by Ocean Heat Transport, Not by Surface Fluxes)
Scientists call it the “warming hole,” or the “cold blob.” For years, its existence allowed two competing stories. In the first, the Atlantic Meridional Overturning Circulation (the AMOC, the current system that carries tropical heat north, releases it into European air, sinks, and returns south along the seafloor) is weakening, delivering less warmth to the exact spot where it normally hands its heat to the atmosphere. In the second story, the current is fine, and the cold is just weather: stronger winds pulling more heat out through the surface, a regional quirk dressed up as a planetary signal.
The difference between those two stories is the difference between a draft in the kitchen and a crack in the foundation. One is uncomfortable. The other decides what kind of house you live in.
The Gauge From The Window
Professor Stefan Rahmstorf has spent more than three decades studying the AMOC. This May, he and five colleagues published a paper built like an autopsy: rule causes out until one remains.The team worked from observation-based data rather than model preference.
First finding: the cold blob runs deep. The heat loss reaches down through the top 1,000 meters of the water column, which happens to match the thickness of the AMOC’s warm northward-flowing layer. Below 2,500 meters, almost nothing changes. Weather works on the surface mixed layer; it does not rearrange heat a kilometer down. A current does.
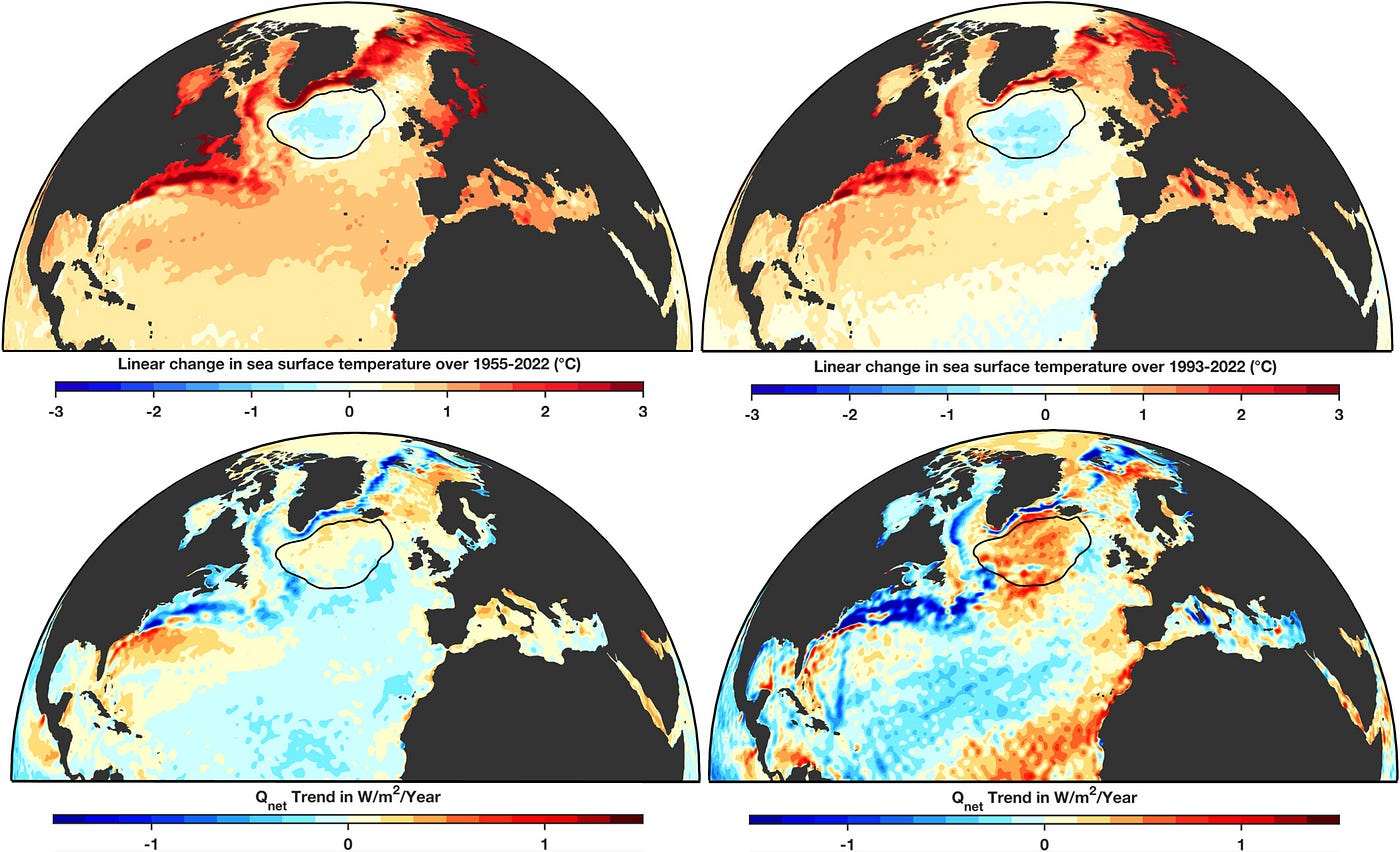
Trend in sea surface temperature over 1955–2022 and 1993–2022 (top panels), and trend in surface ocean heat flux over the same periods (bottom) (Source: Multidecadal Atlantic “Warming Hole” Heat Content Variations Are Caused by Ocean Heat Transport, Not by Surface Fluxes)
Second finding: between 1955 and 2024, while the global ocean accumulated heat at roughly one watt per square meter, the blob lost it. For the surface-flux story to survive, heat loss through the sea surface would need to have increased, winds and air stealing warmth faster than the current could deliver it. The reanalysis data show the opposite. Surface heat loss over the blob has decreased since 1993. The region releases less heat to the atmosphere for the simplest possible reason: less heat is arriving. The surface flux turns out to be a passenger; it responds to whatever the ocean transport delivers.
And the fingerprint comes with a twin. Along the US coast north of Cape Hatteras, the same datasets show a strip of intense warming with increasing surface heat loss, exactly what you would expect if the Gulf Stream shifted north, which ARGO floats confirm it has done since 2001. A weakening AMOC produces precisely this pair: a cold wound where the heat used to arrive, a hot scar where the displaced current now crowds the coast.
The rest of the evidence leans the same way. Salinity in the blob region sits at its lowest in 120 years of records, consistent with a current carrying less salt north. Paleoclimate proxies suggest the AMOC is at its weakest in a millennium. Direct measurement only began in 2004 with the RAPID array, twenty years of instruments watching a system that runs on centuries, and even that short record shows decline.
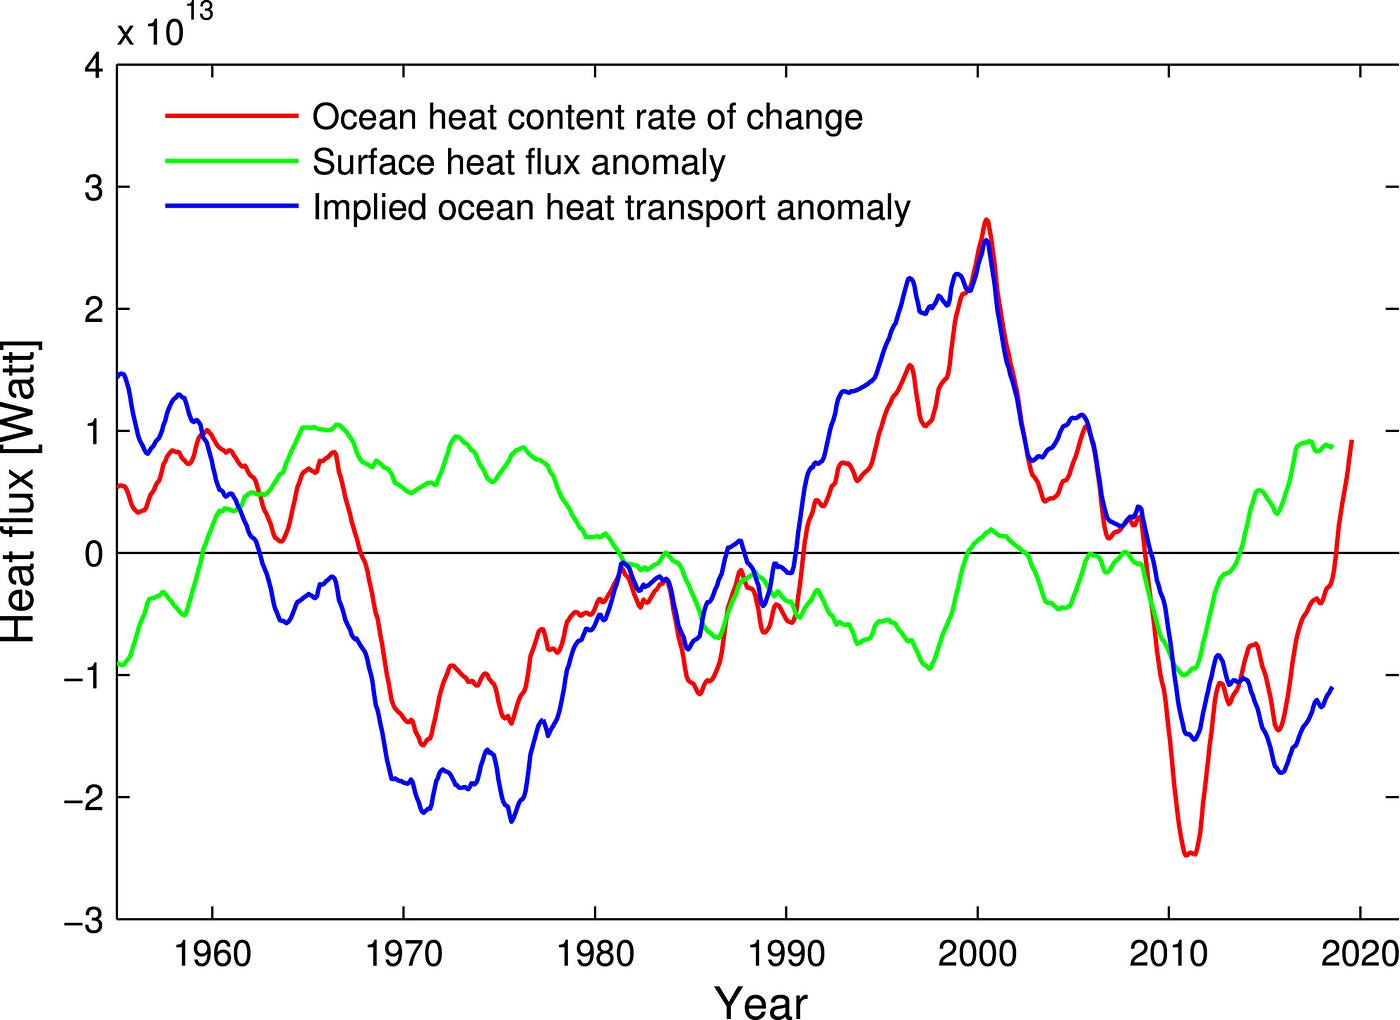
Heat content change, surface heat flux anomaly and implied heat transport anomaly (all given in Watt) (Source: Multidecadal Atlantic “Warming Hole” Heat Content Variations Are Caused by Ocean Heat Transport, Not by Surface Fluxes)
When researchers weighted climate models by how well they matched the observed Atlantic, the best-matching models projected a 42 to 58 percent weakening by 2100. A substantial subset of CMIP6 simulations crosses the tipping point around mid-century. Rahmstorf himself, who for thirty years put the odds of shutdown around 5 percent, now calls it closer to a coin flip.
Iceland read the same evidence and classified a possible collapse as a national security threat. The blue patch on the map sits just off their coast. They can see the gauge from their windows.
One Switch, Two Poles
Earth has done a version of this before. In the last ice age, huge slabs of ice would sometimes snap off northern ice sheets and drift into the Atlantic like a convoy of icebergs, melting as they went. Scientists call these episodes *Heinrich events*. All that meltwater freshened the ocean, making it harder for dense, salty water to sink, which is one of the key moves that keeps the AMOC running. When the sinking slowed, the whole conveyor belt collapsed, again and again.
Greenland’s ice records show what you would expect: the north got colder. But Antarctica’s ice tells a twist ending. In some of those shutdowns, the far south warmed fast, by about 2 to 3°C, and atmospheric CO₂ rose by roughly 15 ppm over a few hundred years. For a long time, climate models could not produce that “southern warming” pattern without forcing the answer.
In October 2025, a team at the Potsdam Institute finally did.
In their Earth system model, an AMOC shutdown is like pouring a slow-moving wave of fresher water into the deep ocean and watching it creep south. Roughly a thousand years later, that freshening helps pry apart the Southern Ocean’s layered structure. The usual “lid” breaks, and a kind of oceanic boiling kicks off in the Ross Sea, then spreads around Antarctica. Deep water that is warm, salty, and packed with stored carbon gets stirred up to the surface. Sea ice pulls back, Antarctica heats up quickly, and the deep ocean effectively burps out CO₂ it had been holding onto for millennia, releasing it into the atmosphere.
The authors call it a bipolar convection seesaw. Convection dies in the North Atlantic, so convection erupts around Antarctica. One switch, two poles. And the southern convection keeps running, venting heat and carbon, until the AMOC itself recovers. The off-switch in the north is the only thing that turns the southern engine off.
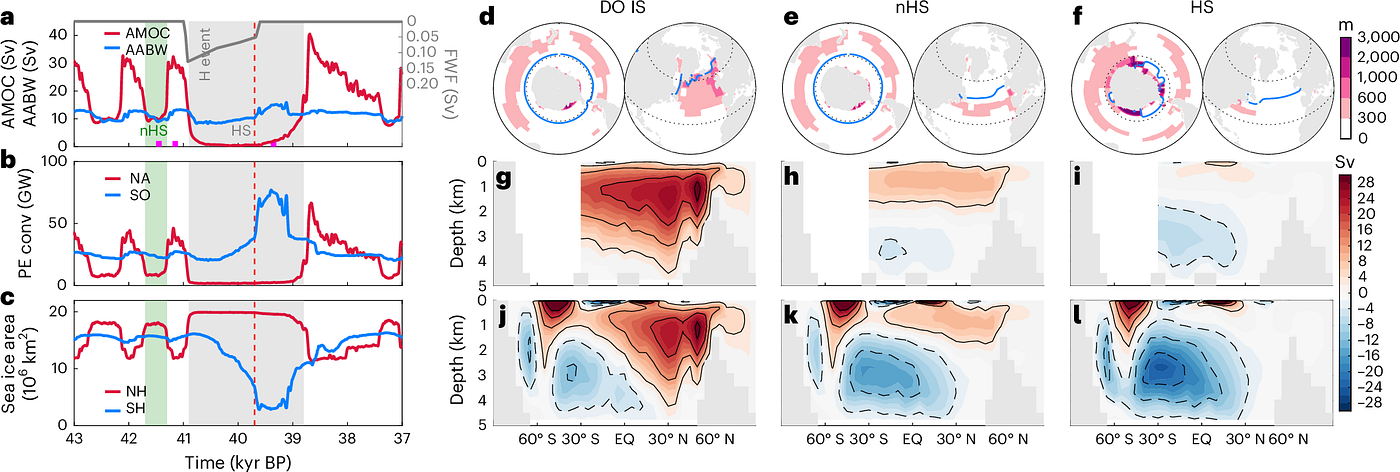
The bipolar convection seesaw (Source: Earth system response to Heinrich events explained by a bipolar convection seesaw)
What’s striking is that this “southern flip” showed up no matter how they tuned the model, even when they used today’s ice sheets. That is why the authors say it “could also operate in response to a possible future collapse of the AMOC under global warming.”
The ocean around Antarctica may have its own on-off switch. And it appears to be connected to the North Atlantic by an invisible, planet-spanning underwater cable. If the circulation in the north fails, the far south could “wake up” in a way that releases heat and, crucially, coughing back out carbon, potentially releasing up to 640 billion tonnes of CO₂ over the long run — roughly the equivalent of about 15 years of today’s global emissions, spilled back into the air slowly over time.
The popular AMOC story, when it gets told at all, is a story about cold: a frozen Europe, The Day After Tomorrow minus the Hollywood shortcuts. But the ice-core record says that if the AMOC collapses, the North Atlantic cools, while Antarctica can warm quickly and start leaking long-stored carbon back into the air, which would add heat to an already record-warm planet.
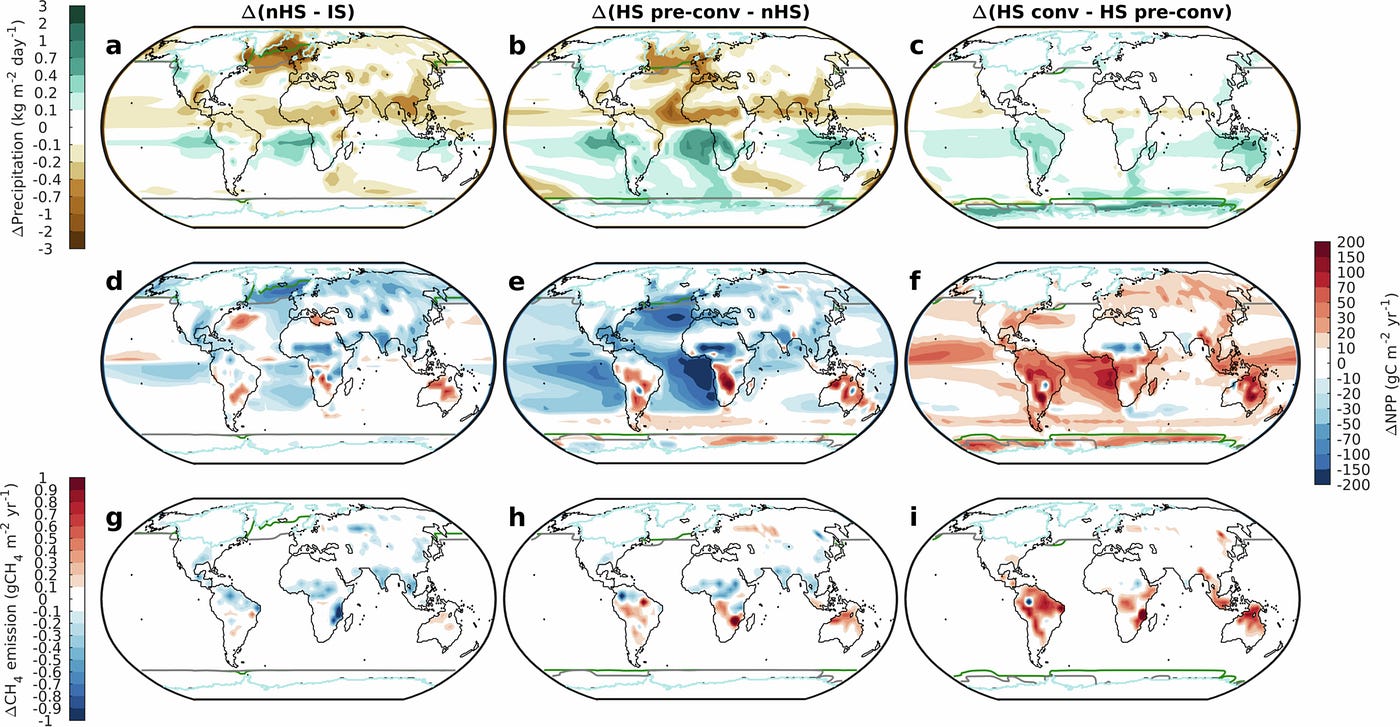
Changes in precipitation, net primary productivity and CH4 emissions between different time slices during the Dansgaard-Oeschger/Heinrich cycles (Source: Earth system response to Heinrich events explained by a bipolar convection seesaw)
The same current that warms my half of the world may also be helping keep a lid on the other half’s carbon “vault.”
Blue Speaks Much Louder
You would expect all of this to be front-page material. A century-old anomaly explained. A confirmed weakening of the planet’s largest heat distribution system. A newly discovered wire connecting it to an Antarctic carbon bomb. Instead, when researchers published the 42-to-58-percent projection this April, the Guardian and the Independent covered it, and most outlets ignored it. On the day the Guardian ran the story, it never cracked their most-read list. Meghan and Harry topped it.
A few weeks later, Britain logged its warmest May on record and the front pages ran photos of children leaping into lidos. Hotter than Barbados, said the headlines, joyfully. The water those children swam in connects, through one continuous ocean, to a blue patch south of Greenland that has been losing heat for a hundred years while the editors looked elsewhere.
Into that vacuum, the President of the United States posted that the UN’s own climate committee had admitted its projections were *“WRONG! WRONG! WRONG!”* He was referring to scientists retiring an old high-emissions scenario because there has been just enough lukewarm policy that the worst-case scenario from a decade ago is no longer the scenario we are running. The five-fold expansion of coal it required is not happening, because renewables undercut coal on cost in 91% of new projects last year.
Ensemble means of the AMOC strength and (below) total ocean heat transport at 26°N in the model simulations in which the northern AMOC shuts down. (Source: Shutdown of northern Atlantic overturning after 2100 following deep mixing collapse in CMIP6 projections)
The unchecked emissions growth it modeled flattened around 2014 and has been tracking RCP4.5 since. The nightmare world RCP8.5 was built to warn us about is the world we partially avoided. And the updated scenarios he celebrated still land the world between 2.5 and 4.3°C of heating by 2100.
Politics sets emissions trajectories. Physics sets the warming attached to them. Only people who profit from the confusion confuse the two.
The ocean does none of this. It does not read the room or count clicks. For 145 years it has been writing the same sentence into the temperature record, in the only ink it has: a patch of cold in a world on fire.
So next time someone shows you a map of the heating world, ignore what the red says — we already know the planet is burning.
The blue speaks much louder.
May the northern lights guide you, M.
If the story resonated, I’d really appreciate a repost. If something’s on your mind, reach out. [My inbox is always open.](mailto: martinah.awanderer@gmail.com)
메타데이터
- post_id
- 3c905f8f7cb0
- slug
- the-worst-climate-news-of-the-year-is-a-patch-of-cold-water-3c905f8f7cb0
- url
- https://medium.com/southern-winds/the-worst-climate-news-of-the-year-is-a-patch-of-cold-water-3c905f8f7cb0
- canonical_url
- https://medium.com/southern-winds/the-worst-climate-news-of-the-year-is-a-patch-of-cold-water-3c905f8f7cb0
- author_url
- https://medium.com/@martinah.awanderer
- status
- ok
- fetched_at
- 2026-06-14 11:28:49