How Likely Is Your Data? The Idea Behind Maximum Likelihood Estimation (MLE): Part-2
What if your data could vote on the most plausible explanation? That’s exactly what MLE does.
How Likely Is Your Data? The Idea Behind Maximum Likelihood Estimation (MLE): Part-2
What if your data could vote on the most plausible explanation? That’s exactly what MLE does.
This post continues the discussion from the **previous post on the same topic**. Here, we transition to the mathematical derivation of MLE.
We will use our criterion from **Part-1** as a starting point and generalize it to illustrate parameter estimation using MLE.
*Our goal is to find the single most probable value of p that makes our observed sample (H,H,T,H) most likely.*
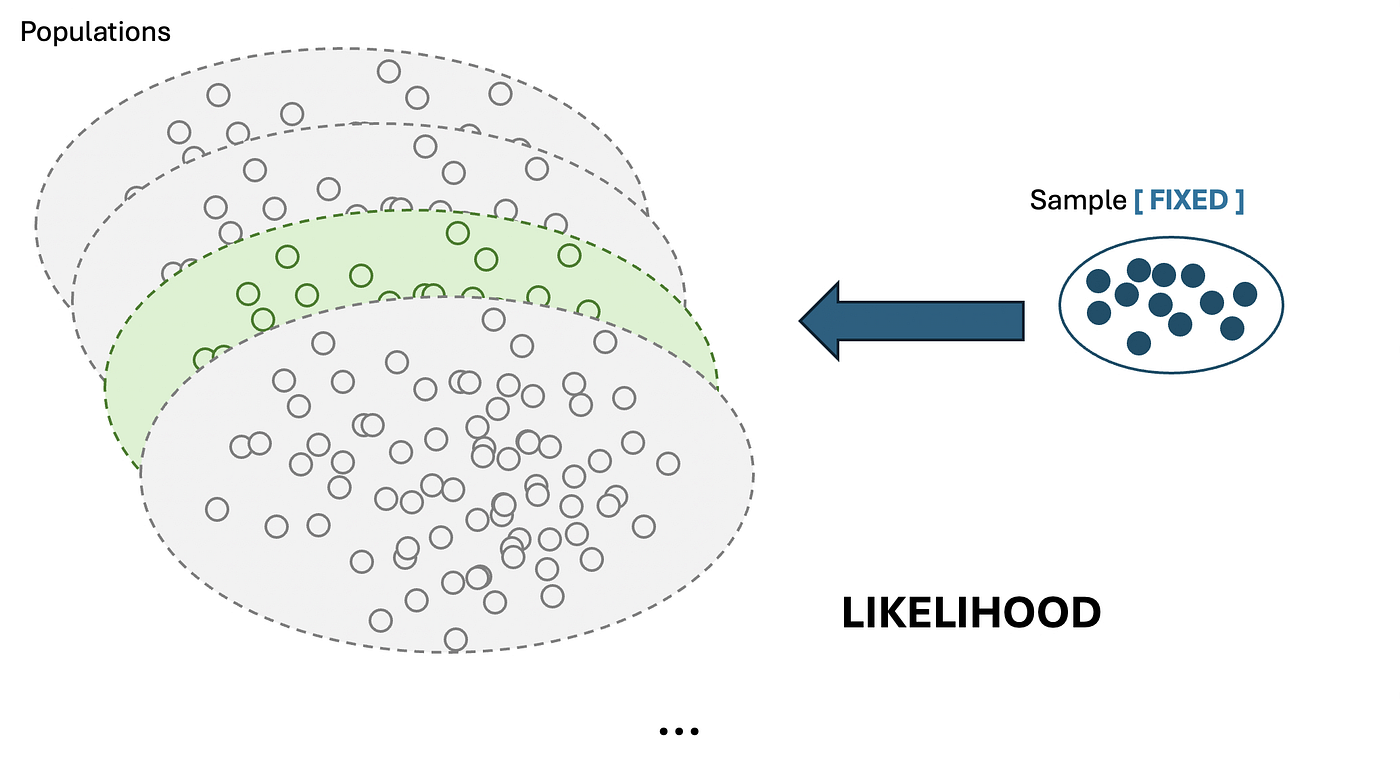
Figure 1. Identifying the most plausible population for the given sample
The Likelihood Function: Quantifying Fit
The core criterion remains the same as in the **Part-I: we assume a population (or a hypothetical **p) and calculate how well it explains our observations.
We assume the sample size as N and the number of heads in the sample as k. The probability of observing k heads and N-k tails is given by:
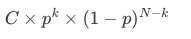
We refer to this potential function as Likelihood Function, L(p). Here, C represents a constant (specifically, the number of ways the sample could appear; this was 4 in our coin flipping example). This constant remains the same for the sample and can therefore be eliminated from the equation.

This is how likelihood was defined in the seminal paper of Ronald Fisher: The likelihood that any parameter (or set of parameters) should have any assigned value (or set of values) is proportional to the probability that if this were so, the totality of observations should be that observed (Fisher, 1922).
Our objective is now crystal clear: We seek the value of p that maximizes this function.
The MLE Goal: Locating the Peak
To find the point where the function reaches its maximum, we employ calculus. This is achieved by differentiating and equating the derivative to zero.
The Mathematics: Deriving the MLE Solution
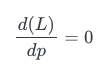
We employ calculus to find the value of p which maximizes the Likelihood Function. This is done by taking the derivative and equating it to zero.
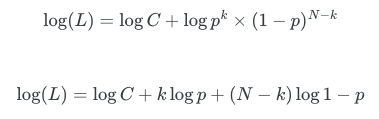
However, since direct differentiation of the product form is complex, we apply natural logarithm to transform multiplication into addition. This new likelihood function is known as log likelihood.
We find the maximum by setting the differentiation of log-likelihood with respect to p equal to zero.
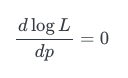
Applying the differentiation rules to log-likelihood, we get:
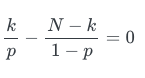
Next, we solve the equation to find the value of p.
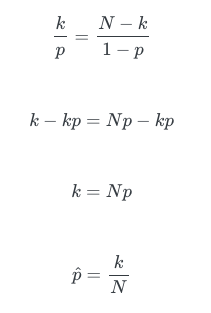
Here, we use the notation of p with hat to signify that it is an estimated parameter.
In conclusion, the MLE estimation is simply the observed sample proportion of heads.
References
- Fisher, Ronald A. 1922. “On the Mathematical Foundations of Theoretical Statistics.” Philosophical Transactions of the Royal Society of London. Series A, Containing Papers of a Mathematical or Physical Character 222 (594–604): 309–68.
메타데이터
- post_id
- 7204473bfd7c
- slug
- how-likely-is-your-data-the-idea-behind-maximum-likelihood-estimation-mle-part-2-7204473bfd7c
- url
- https://blog.devgenius.io/how-likely-is-your-data-the-idea-behind-maximum-likelihood-estimation-mle-part-2-7204473bfd7c
- canonical_url
- https://blog.devgenius.io/how-likely-is-your-data-the-idea-behind-maximum-likelihood-estimation-mle-part-2-7204473bfd7c
- author_url
- https://medium.com/@pankajchejara
- status
- ok
- fetched_at
- 2026-07-13 06:23:13