How We Cut P95 Latency From 480ms to 85ms (Without Touching Code)
A production guide to finding queueing delays, connection pool limits, and hidden performance bottlenecks
How We Cut P95 Latency From 480ms to 85ms (Without Touching Code)
A production guide to finding queueing delays, connection pool limits, and hidden performance bottlenecks
Production Debugging Diaries — Part 1
Your dashboard says everything is fine.
CPU is at 30%. Memory is stable. Database queries are fast.
But your P95 latency is sitting at 480ms, and 50 users every second are experiencing slowness.
You’ve added logging. You’ve profiled the hot path. You’ve checked every metric you know.
Nothing explains it.
This is the tail latency problem that haunts production systems.
The kind where the issue hides in the 5% of requests you’re not watching. The kind where traditional debugging methods fail because the problem doesn’t look like a problem.
I’ve seen this pattern across dozens of production systems. The root cause is almost never where you expect it to be.
Today, I’m walking you through a real debugging story — complete with false leads, the turning point, and the one-line fix that dropped latency by 400ms.
What You’ll Learn
By the end of this article, you will have:
- A repeatable method to debug tail latency in production
- Three specific graphs that surface hidden performance issues
- A hypothesis-driven approach that narrows root causes
- Practical instrumentation ideas you can apply immediately
- A new mental model for understanding where latency comes from
Think of this as performance engineering, not metrics watching.
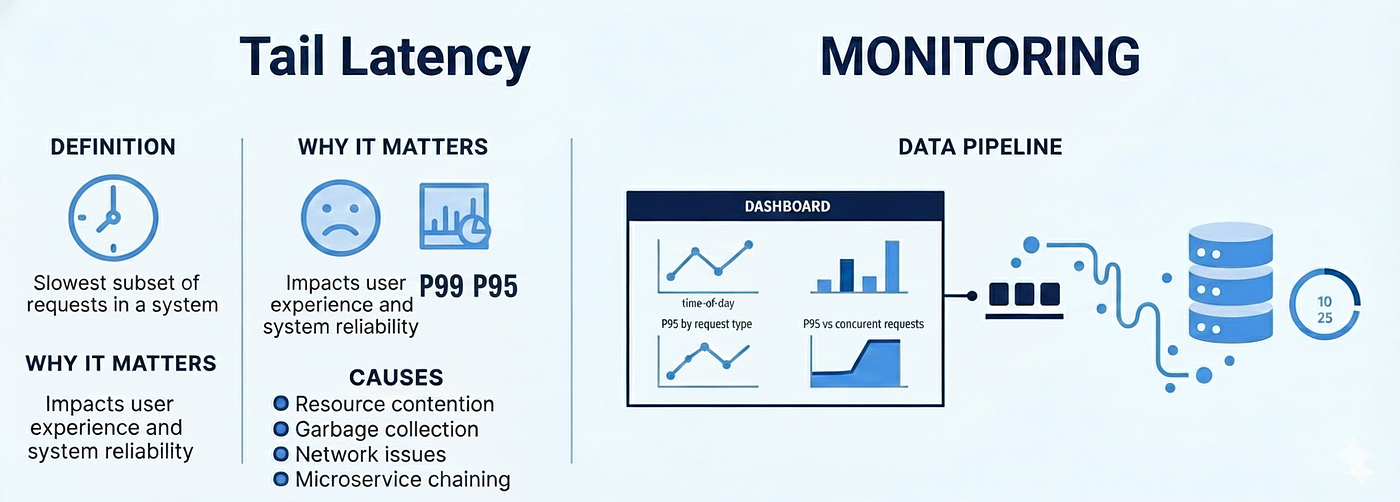
tail latency and monitoring
What Is Tail Latency (And Why It Matters)
Tail latency refers to the slowest requests in a system, measured using high percentiles like P95 or P99.
If your P95 latency is 480ms, that means 95% of requests complete faster than that — and 5% take longer.
That 5% is where users feel pain.
The Math Behind the Pain
At 1,000 requests per second:
- 5% equals 50 slow requests every second
- That’s 50 users per second experiencing noticeable slowness
This is why tail latency matters more than averages.
Users don’t experience averages. They experience outliers.
The Symptom: P95 Latency Is High but Metrics Look Normal
Here’s what the dashboard showed:
- P50 latency: 80ms
- P90 latency: 120ms
- P95 latency: 480ms
P50 looked excellent.
P90 looked acceptable.
P95 refused to move.
The Standard Checklist (That Didn’t Help)
We did what most teams do:
- Added more logging
- Checked database query times
- Profiled CPU usage
- Reviewed memory metrics
Everything looked healthy.
And yet, users kept complaining.
This is what makes tail latency so difficult — the problem hides in the 5% of requests you’re not staring at.
Here’s the hard truth: Most tail latency problems are not where you expect them to be.
Why Tail Latency Problems Hide So Well
Averages smooth out pain.
Percentiles reveal it — but only partially.
Tail latency issues usually:
- Do not show up in hot-path profiling
- Do not correlate with CPU or memory saturation
- Affect only a small subset of requests
- Stay flat instead of gradually worsening
They feel mysterious because they don’t look like traditional performance problems.
But they are not random.
They have structure.
The Investigation: When Everything You Check Looks Fine
The system was an API serving search results.
Symptoms
- P95 latency consistently ~400ms slower than expected
- No degradation over time
- No visible resource saturation
Initial Checks
- Database queries were fast
- CPU usage hovered around 30%
- Memory usage was stable
- No error rates or retries
At this point, it’s tempting to keep digging deeper into logs or tuning queries.
That’s not what unlocked this problem.
The Turning Point: Three Graphs That Changed Everything
Instead of staring at averages, we built three specific graphs.
1. P95 Latency by Time of Day
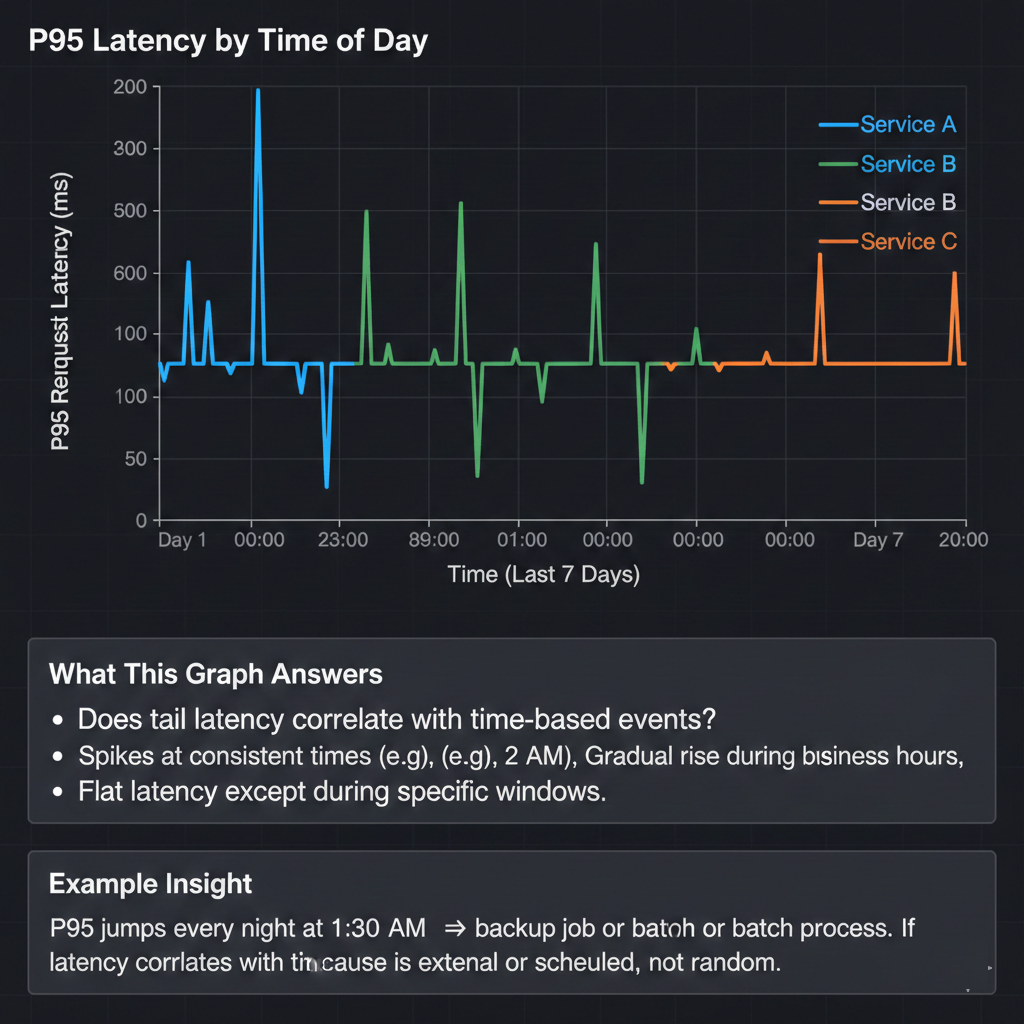
To learn: Does tail latency correlate with time-based events
This shows whether latency correlates with traffic patterns, cron jobs, or background processes.
Example insight
“P95 jumps every night at 1:30 AM → backup job or batch process”
If latency correlates with time, the cause is external or scheduled, not random.
2. P95 Latency by Request Type
This reveals whether a specific endpoint or code path is responsible.
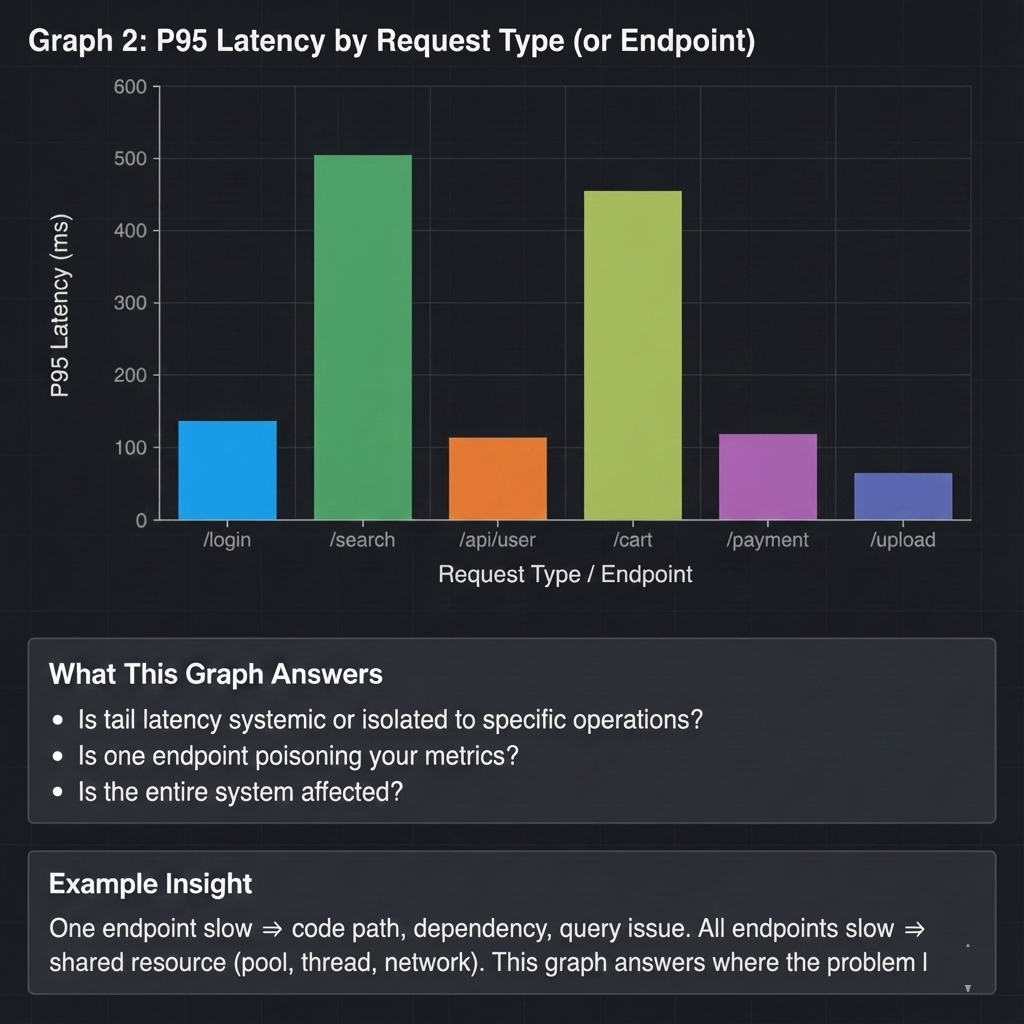
To Learn: Is tail latency systemic or isolated to specific operations
Example insight
One endpoint slow → code path, dependency, query issue All endpoints slow → shared resource (pool, thread, network)
3. P95 Latency by Concurrent Request Count
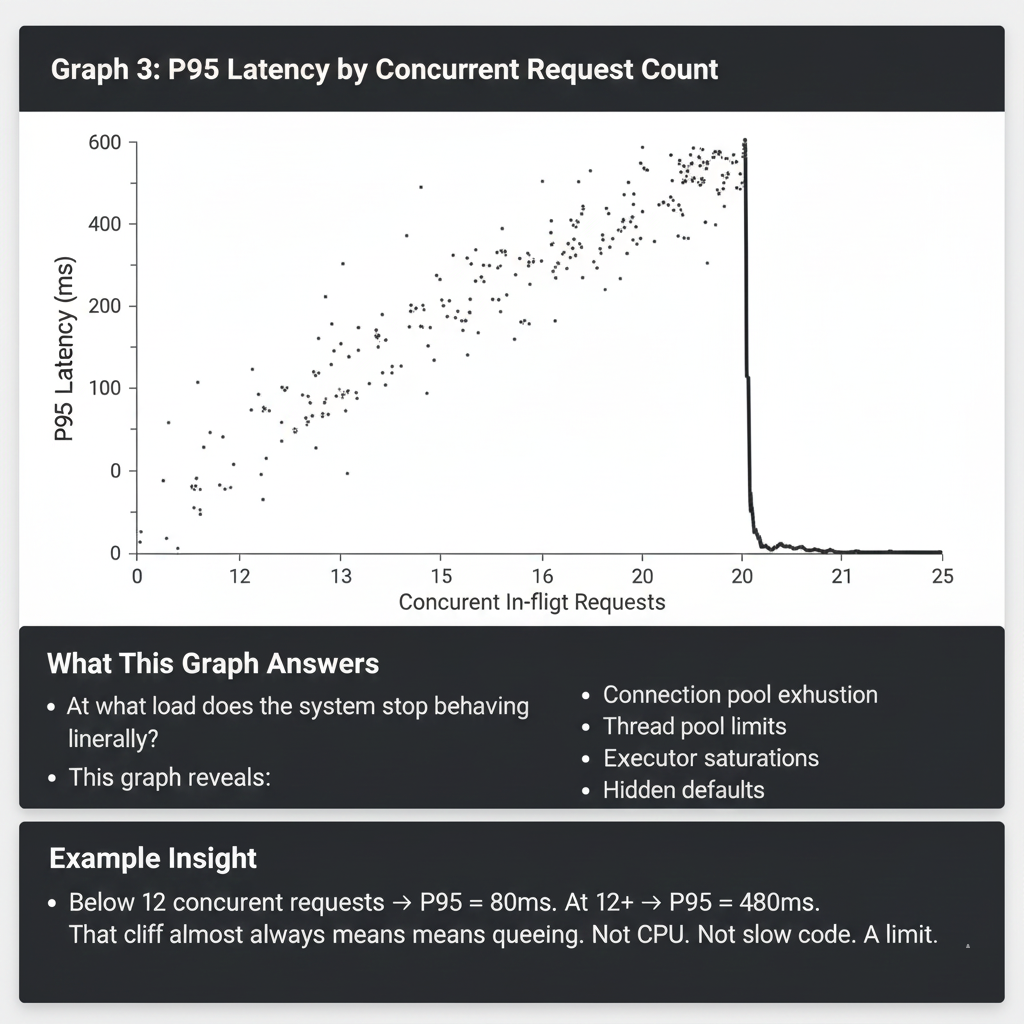
To learn : At what load does the system stop behaving linearly
This one exposed the real issue.
The result was striking:
- Below 12 concurrent requests: P95 latency ~80ms
- At 12 or more concurrent requests: P95 latency jumped to ~480ms
What to look for
- A sudden cliff where latency jumps
- A sharp bend instead of a smooth curve
Example insight
“Below 12 concurrent requests → P95 = 80ms At 12+ → P95 = 480ms” That cliff almost always means queueing.
Not CPU , Not memory, Not slow code.
The Confusion
This made no sense at first.
Load tests showed the system could handle far more than 12 concurrent requests.
CPU, memory, and database capacity all had headroom.
So why did latency collapse at exactly 12?
Root Cause: Queueing and Connection Pool Limits
This was not a capacity problem.
It was a queueing problem.
The database connection pool size was set to 10.
The default value from a framework scaffold created years earlier.
No one questioned it because:
- Individual queries were fast
- The database never appeared overloaded
- No alerts ever fired
What Was Actually Happening
At 12 concurrent requests:
- 2 requests had to wait for a free connection
- They weren’t slow because of execution
- They were slow because they were waiting
That wait time added roughly 400ms.
Once a connection became available, the query completed in about 30ms.
The database was fast.
The waiting was slow.
The Fix: One Configuration Change
The fix was simple:
Increase the connection pool size from 10 to 25
Results After Deployment
- P95 latency dropped from 480ms to ~85ms
- No code changes
- No database tuning
- No refactoring
This pattern appears repeatedly in production systems.
Common Queueing Sources
In practice, 30–40% of tail latency issues come from queueing:
- Database connection pools
- Thread pools
- Executor limits
- Queue depth caps
- Rate limits added long ago and forgotten
The work executes quickly.
The waiting does not.
How to Actually Find the Queue
Fixing the limit is easy.
Finding the queue is the hard part.
Instrument Gaps, Not Just Execution Time
Add timers around all external operations:
- Database calls
- HTTP requests
- Cache lookups
- Message queue interactions
But measure when the operation starts, not just how long it runs.
If you see hundreds of milliseconds where nothing happens before an operation begins, you’ve found your queue.
What We Saw in This Case
- Requests waited up to 450ms before the first database call started
- Once started, the query finished quickly
- The wait time correlated perfectly with concurrent load
That ruled out the database itself.
Other Common Queueing Sources
- Application server thread pools
- Upstream rate limiting
- DNS resolution when caches expire
Different root causes.
Same debugging method.
Time does not vanish. It is always hiding somewhere.
A Repeatable Method for Debugging Tail Latency
This approach now runs on every service we deploy.
The Five-Step Process
- Graph P95 latency across multiple dimensions, especially concurrent load
- Instrument gaps between operations, not just execution duration
- Form a hypothesis about where queueing might occur
- Add focused metrics around that area
- Validate or reject quickly
When you find the queue, the fix is usually boring:
- Increase a pool size
- Add workers
- Remove an artificial limit
The challenge is visibility, not complexity.
Why Most Tail Latency Problems Come from Queueing
Tail latency hides because:
- It does not affect averages
- Profilers focus on hot paths
- Only a small percentage of requests are impacted
But once you know where to look, the problem becomes mechanical.
The Standard Playbook
- Start with P95 latency by concurrent request count
- If you see a cliff, instrument the gaps
- Find the queue
- Adjust the limit
Many teams see immediate improvements, often cutting tail latency in half within hours.
Final Takeaway
The biggest lesson is simple:
Most production performance problems are not caused by slow work.
They are caused by waiting.
Tail latency lives in queues, limits, and defaults nobody remembers setting.
Three Key Principles
- Trust percentiles, not averages
- Question defaults, especially old ones
- Never assume “looks fine” means “is fine”
What’s Next
In Part 2, we’ll dig into another production issue that hides in plain sight: how thread pools silently cap throughput long before CPU is saturated.
Until then, I have a question for you:
What’s the one performance metric that’s been bothering you lately — the one that refuses to improve no matter what you try?
Drop a comment. I read every single one, and your answer might shape the next article in this series.
메타데이터
- post_id
- 7f85efcaa4e2
- slug
- how-we-cut-p95-latency-from-480ms-to-85ms-without-touching-code-7f85efcaa4e2
- url
- https://medium.com/@vinodbokare0588/how-we-cut-p95-latency-from-480ms-to-85ms-without-touching-code-7f85efcaa4e2
- canonical_url
- https://medium.com/@vinodbokare0588/how-we-cut-p95-latency-from-480ms-to-85ms-without-touching-code-7f85efcaa4e2
- author_url
- https://medium.com/@vinodbokare0588
- status
- ok
- fetched_at
- 2026-06-20 20:29:01