Instrumenting Java over TLS with eBPF: how OBI fills the gap the kernel can’t see
Getting Java instrumentation to work with eBPF across TLS-encrypted connections presented a real challenge for the OBI project — a…
Instrumenting Java over TLS with eBPF: how OBI fills the gap the kernel can’t see
Getting Java instrumentation to work with eBPF across TLS-encrypted connections presented a real challenge for the OBI project — a challenge that forced us to rethink the architecture of what “eBPF-only” even means.
Java is still the dominant language in enterprise software. Spring Boot, Quarkus, Hibernate, reactive messaging frameworks — the ecosystem is deep and the OpenTelemetry Java SDK offers some of the most comprehensive auto-instrumentation available for any runtime.
But there are real production scenarios where the OpenTelemetry Java agent can’t be used: third-party applications you can’t touch, legacy JVM versions, multiple agents are unsupported, financial systems where injecting code into a running runtime carries compliance risk, and applications compiled to native binaries with GraalVM where the agent can’t load at all.
The OpenTelemetry eBPF Instrumentation (OBI) project, which we at Grafana Labs donated to the OpenTelemetry project about a year ago, is designed for exactly these cases. No code changes, no JVM flags, no restarts. Install it as a system process (or a DaemonSet in Kubernetes), and your services start emitting traces and metrics.
This works nicely for most languages. It also works reasonably well for Java, until you need to worry about TLS.
Getting Java instrumentation to work with eBPF across TLS-encrypted connections presented a real problem for the OBI project — a problem that forced us to rethink the architecture of what “eBPF-only” even means.
Note: This blog post was inspired by a GrafanaCON 2026 talk I gave with Endre Sara, Co-founder of Causely. You can watch the full session below.
[embed]
Why Java and eBPF don’t naturally fit together
eBPF lets us attach probes to running Linux processes without modifying them. For compiled languages, user-space probes (uprobes) work because compiled code lives on disk as a real file: we probe the binary, intercept function calls, and extract data. But Java breaks this assumption in two ways.
First, JIT-compiled code lives in anonymous memory regions. There’s no file for a uprobe to attach to. We explored workarounds, including ptracing into a running process and remapping its memory regions to memory-mapped files. That technically worked, but only partially.
The deeper problem is that Java is a dynamically compiled language. The JVM starts by interpreting bytecode and collecting profiling and execution count data, then it JIT (just-in-time) compiles/recompiles the hot code multiple times. And those compilation decisions change from run to run depending on what the workload looks like. The native code executing is never the same from run to run of the same Java application, so building instrumentation at the binary level would require a sprawling net of probes. The result would be brittle: working in one run, silent in the next. We never considered this a viable path for OBI.
The TLS problem is bigger than it looks
When TLS first came up as a Java instrumentation challenge, I underestimated it. Most Java server setups would terminate TLS at the load balancer anyway — after all, how many Java TLS servers are directly exposed to the internet?
It turns out the more significant problem is on the client side. Almost every call from a Java application to an external managed service — cloud databases, message brokers, identity providers — goes over TLS. The Java servers may not be typically serving traffic over TLS, but Java clients are making encrypted connections constantly.
For most other languages and runtimes, we intercept TLS by hooking into OpenSSL or BoringSSL, the shared native library that handles encryption. We insert ourselves at the boundary where data is plaintext before encryption and after decryption. The kernel never needs to understand what the payloads are; we see them before they’re encrypted.
That approach doesn’t work for Java because the JDK standard library implements TLS in Java. Unless an application explicitly uses BoringSSL or OpenSSL through JNI, which is the exception, the TLS code is entirely JIT-generated code. There’s no shared native library in kernel space for us to hook into. The kernel only sees an opaque encrypted byte stream.
Thread correlation breaks the simple model
Before we get to TLS, there’s a second structural problem specific to Java: the most effective way to handle parallel execution is through thread pools and the executor framework.
In a typical Java service, an HTTP request arrives on a thread from one pool, gets processed, and dispatches an outgoing database or service call on a thread from a different pool. From the kernel’s perspective, those two operations are completely unrelated. The incoming HTTP request and the outgoing Postgres query look like independent events on independent connections-because they are. The exchange of context between the two threads happens all in userspace on the Java heap, completely invisible to the kernel layer.
For languages where a single thread handles the full request lifecycle, we correlate incoming and outgoing events by tracking the thread. For Java with multiple thread pools and async dispatch, that correlation breaks down entirely. We need to track not just kernel-level network events, but the application-level work unit that connects them.
OBI’s approach: a minimal Java agent as a bridge to eBPF
The solution we landed on is a small Java agent that can be dynamically injected into a running process. You don’t need any restarts, JVM flags, or code changes. And critically, this agent is deliberately narrow in scope.
It instruments two things: TLS (capturing plaintext buffers before encryption and after decryption) and Java thread pools (propagating correlation context across thread handoffs). Nothing else. No Spring Boot instrumentation, no Hibernate, no Netty, no application libraries.
The rest of OBI already handles protocol parsing at the kernel level. It identifies HTTP, gRPC, Postgres wire protocol, Kafka, and extracts the relevant attributes. The Java agent only fills in the two pieces the kernel can’t see on its own: the plaintext payloads that TLS hides, and the thread-level context that ties a distributed trace together across thread boundaries.
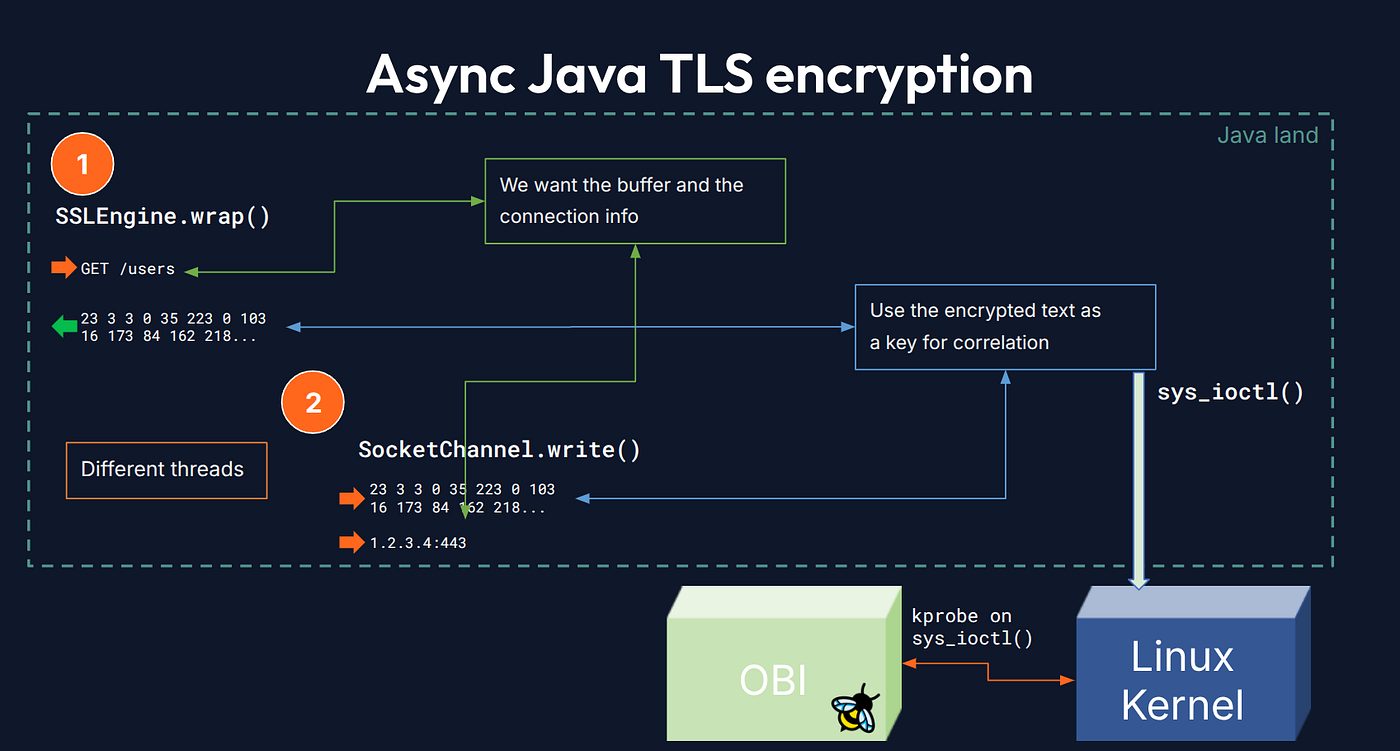
To communicate between the Java agent and the eBPF layer, we use sys_ioctl. When the agent intercepts a TLS operation, it makes an ioctl call that carries the buffer we want OBI to process. On the eBPF side, a kprobe intercepts that call, reads the buffer out of the Java process’s memory, and hands it to the rest of the OBI pipeline for protocol parsing. This keeps the agent minimal, acting as a bridge instead of an instrumentation library.
Two TLS modes required two different solutions
Java’s TLS implementation has two distinct operating modes, and we had to handle both of them differently.
The first is SSLSocket, the classic Java TLS implementation. Here a single class handles both the network communication and the SSL encryption. The connection metadata (IP addresses, ports) and the plaintext buffer are available from the same instrumentation point. That’s straightforward.
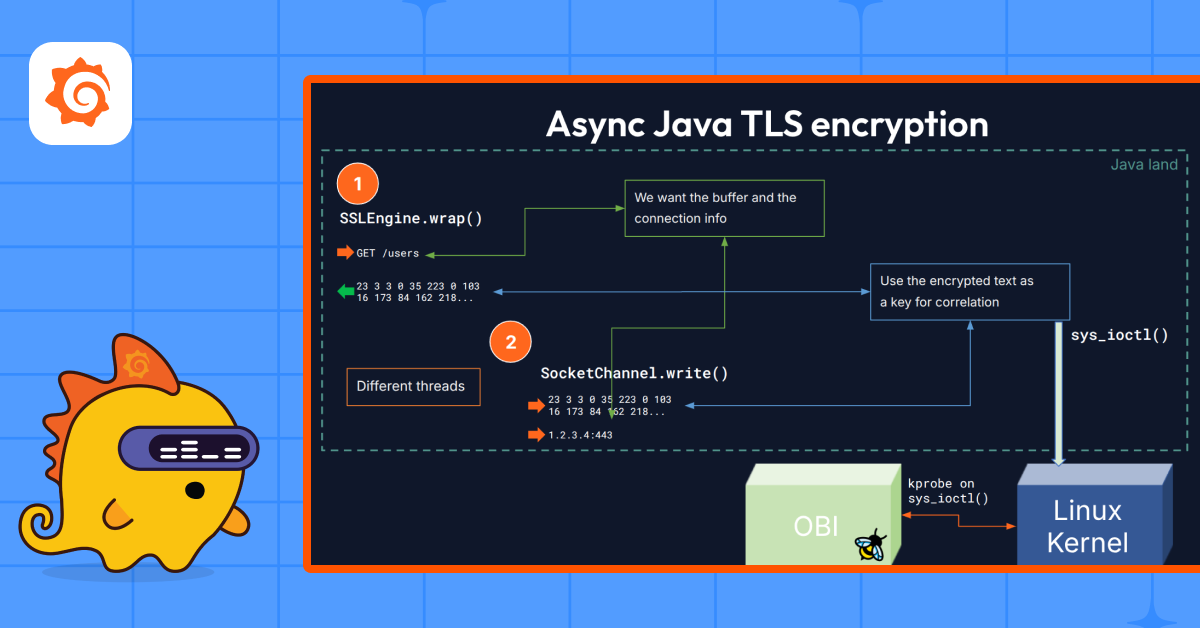
The second mode is what high-performance frameworks like Netty use. They implement their own socket layer for performance, but delegate encryption to the JDK’s SSLEngine. In this architecture, encryption is asynchronous: one path handles cryptographic operations, a separate path handles the actual network I/O. The plaintext buffer and the connection information exist in different places at different times.
Correlating these in an async model is hard. You can’t track threads reliably since the thread that encrypted the data isn’t necessarily the thread that sends it.
We figured a solution out from a property of the encryption itself: if the encryption is doing its job, ciphertext is unique for any given plaintext. We take a sufficient number of bytes from the ciphertext at the time of encryption and use them as a key in an in-memory map, associated with the plaintext buffer we want to capture.
When the encrypted data is actually sent over the network, we extract the same key from the outgoing bytes, look up the map, and we now have both the plaintext and the connection information. The same uniqueness property that makes TLS secure is what lets us correlate across the async boundary.
Route normalization from class symbols
One more gap we filled: route normalization. While processing data at the protocol level, we might observe a request to /users/12345. At the application level, the route is defined as /users/{id}in a Spring Boot controller or a Quarkus resource. Without normalization, every unique user ID generates a unique span name and your trace data becomes noise.
OBI harvests route templates from the symbols embedded in the loaded Java classes. When Java loads an annotated route handler, the route pattern is available in class metadata. We read those patterns and apply the same matching logic the framework uses, mapping /users/12345 back to /users/{id} in the span attributes. This works generically across frameworks without needing framework-specific probes.
What this looks like against real workloads
To validate the approach against patterns we’ve seen in real customer environments, I worked with Endre Sara (Causely co-founder) to put together a set of deployable examples using Helm charts. Each one corresponds to a class of Java application we’ve needed to instrument.
Spring Boot + Keycloak over HTTPS. A common enterprise pattern: Java microservices authenticating against Keycloak. Keycloak itself can be natively instrumented, but what actually matters is how the Java clients interact with it over HTTPS. With OBI, we trace the full client connection-including the TLS-encrypted HTTPS calls-without modifying the Spring Boot application.
Spring Boot + Google Pub/Sub over gRPC/TLS. Pub/Sub is accessed over gRPC with TLS. This is the managed cloud service connectivity problem in concrete form: the service is external, encrypted, and you want distributed trace context to propagate through message delivery without instrumenting either endpoint at the application level.
Quarkus + PostgreSQL + Kafka over TLS. The hardest case in the set. Quarkus can be compiled to a native binary, which blocks the traditional Java agent entirely. Both the database connection and the Kafka broker use TLS. With OBI, both the encrypted Postgres wire protocol and the Kafka protocol are observable. The examples include builds with and without native OTel SDK instrumentation on each service so you can directly compare what OBI adds and what it doesn’t cover relative to full SDK instrumentation.
What doesn’t work yet
The approach we landed on handles those scenarios well, but there are real limitations worth naming directly.
TLS-based context propagation isn’t working yet. W3C trace context (the headers that carry a distributed trace across services) can’t yet be threaded through TLS-encrypted connections. We can trace into and observe TLS-encrypted services, extracting protocol-level attributes, but distributed trace correlation across TLS hops is incomplete. This is an active area of work.
Reactive programming models (RxJava, Project Reactor, and similar libraries) aren’t supported for thread correlation. The current implementation tracks JDK thread pools. If work is dispatched through reactive pipelines, correlation across those handoffs won’t work correctly. We intentionally scoped the agent to JDK internals rather than instrumenting every reactive library, but that means reactive workloads have a gap in thread correlation.
When to use OBI versus the Java SDK
The practical question is which to use. The honest answer is both, serving different roles.
Roll OBI out broadly. It works across every language in the stack with no per-application configuration, and it handles the scenarios where the Java agent can’t run. Add the Java SDK to applications where you need deeper instrumentation such as custom business metrics, finer-grained library-level attributes, and specific query tagging.
OBI is designed to recognize when an application already carries native OpenTelemetry instrumentation and back off, so there’s no conflict there. What tends to happen organically in the environments we work in: OBI handles breadth coverage, and teams layer in the Java SDK where the additional detail is worth the investment. For compiled native binaries, third-party services, or legacy JVMs, OBI becomes the only option.
The goal was never to replace the OpenTelemetry Java SDK. It was to make “completely uninstrumented” unacceptable — to establish zero-touch observability as the baseline, with teams building up from there.
OBI is open source and contributions are welcome. The example applications are public, deployable via Helm, and designed to let you compare OBI instrumentation against native SDK instrumentation side by side. If you hit a framework or protocol that breaks, please open an issue. Those bug reports are how most of the edge cases described here surfaced in the first place.
- OpenTelemetry eBPF Instrumentation (OBI)
- Beyla (built on OBI)
- Example applications: SpringBoot + Keycloak HTTPS, SpringBoot + gRPC + Pub/Sub, and Qarkus + TLS Postgres + TLS Kafka
메타데이터
- post_id
- bc2f153dc440
- slug
- instrumenting-java-over-tls-with-ebpf-how-obi-fills-the-gap-the-kernel-cant-see-bc2f153dc440
- url
- https://medium.com/grafana-labs/instrumenting-java-over-tls-with-ebpf-how-obi-fills-the-gap-the-kernel-cant-see-bc2f153dc440
- canonical_url
- https://medium.com/grafana-labs/instrumenting-java-over-tls-with-ebpf-how-obi-fills-the-gap-the-kernel-cant-see-bc2f153dc440
- author_url
- https://medium.com/@nikola.grcevski
- status
- ok
- fetched_at
- 2026-06-09 15:37:30