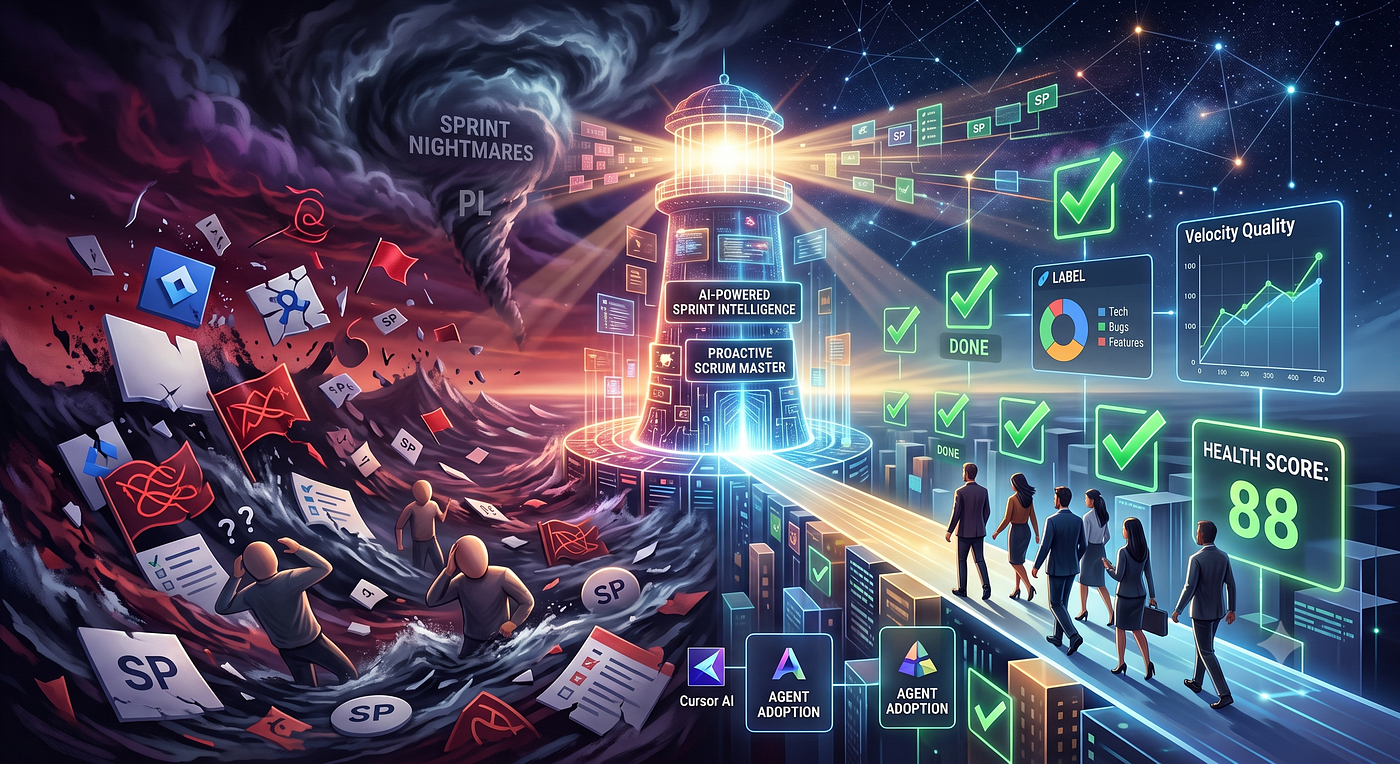
AI-Powered Design Operations: Measurement, Automation, and Operational Performance
As the OPS-CX-TEX-UX Product Design team at Trendyol, we continuously evaluate our ways of working, identify opportunities for improvement…
AI-Powered Design Operations: Measurement, Automation, and Operational Performance

By the end of this process, we’ll all be one step closer to the best version of ourselves.
As the OPS-CX-TEX-UX Product Design team at Trendyol, we continuously evaluate our ways of working, identify opportunities for improvement, and implement initiatives that support Trendyol’s future strategy. We consider AI to be a fundamental part of this journey and actively integrate it into our daily workflows. Through practical AI-driven solutions, we strive to increase efficiency, simplify our processes, and maximize the impact of our work.
As a Product Design team, our primary focus at the beginning of every project is to identify and understand the problems within our products. At the same time, delivering high-quality outputs is an inherent part of what we do. Today, a significant portion of AI adoption in the design world revolves around output generation. From prompts and visual creation to wireframes and research summaries, everyone is exploring ways to produce better results faster and more efficiently. As a team, we have been experimenting with AI across these areas, measuring its impact, and continuously tracking opportunities for improvement. However, the story we want to share today is not about design outputs themselves.
Instead, we want to share how the OPS-CX-TEX-UX team positions AI to monitor team performance, make our processes more transparent, and bring a stronger data-driven perspective to our decision making. We believe AI can do much more than simply help us address existing gaps faster. It can provide a deeper, more measurable, and more sustainable operational foundation for how we work.
That is why we do not see AI primarily as a tool for generating outputs. We see it as a teammate that helps us identify organizational bottlenecks, guides us toward the right priorities, and offers an objective perspective for solving operational challenges. Throughout this transformation, we have been asking ourselves one simple question: How can we spend less time on operational overhead while making smarter and more strategic decisions about the way we work?
Let’s Start with the First Step: What Is Our Problem?
As a Product Design team, the first step in every initiative is to define the problem correctly. We believe that meaningful solutions can only emerge from a clear understanding of the problem. Because this mindset is already deeply embedded in the way we design products, applying the same approach to our operational challenges felt like a natural extension of our process.
With this in mind, we organized internal workshops, retrospectives, and discussion sessions. Our goal was to examine our ways of working, make hidden challenges visible, and identify the areas where we could improve. By doing so, we aimed to build a more efficient and sustainable operational workflow for the team.
The outcome of these sessions revealed a clear picture of the challenges we needed to address:
- The quality of our task descriptions was below the standard we expected.
- We had no measurable data on the volume of Ad-hoc work introduced during our sprints.
- We did not know how extensively AI was being used across our day-to-day work.
- We experienced inconsistencies in our Story Point (SP) estimations.
- A significant portion of our tasks were not created by Product Managers.
- We were not measuring how well our completed work aligned with our team goals.
- We had no visibility into the rework rate of our completed tasks.
With the introduction of our sprint model, we had already established a framework for tracking our operational performance through eight core metrics. These included Velocity, Stability Score, Throughput, Committed Work, Completed Work, Completion Rate, Cycle Time, and Scope Change. Together, these metrics gave us greater visibility into our delivery process and enabled us to monitor the team’s performance more effectively.
While they provided valuable insights into how we executed our work, they did not fully explain why certain operational challenges were occurring or where we should focus our improvement efforts next.
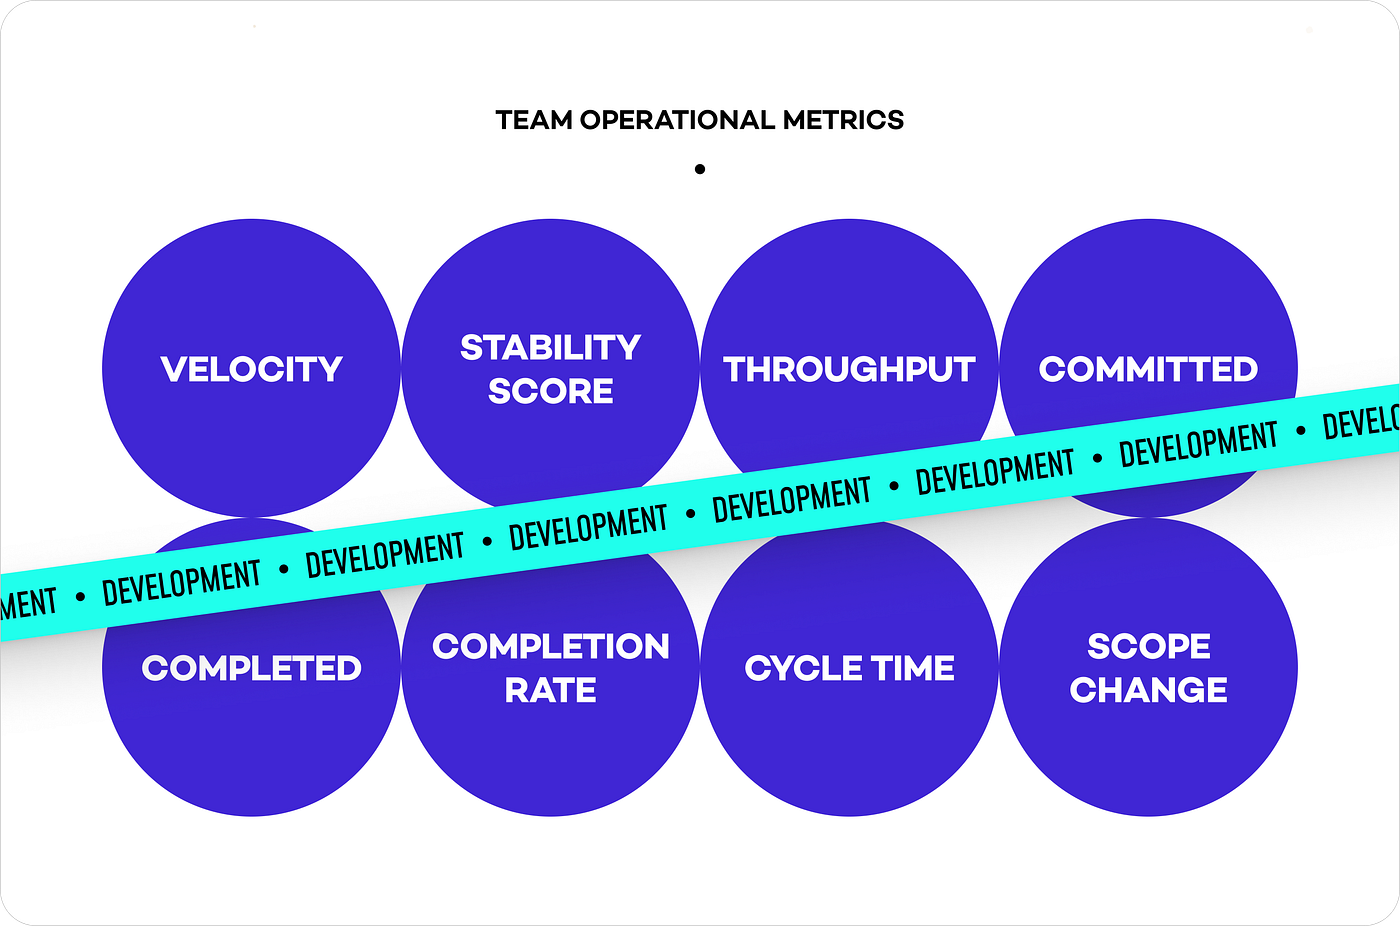
Existing OPS-CX-TEX-UX Operational Metrics
At the same time, these newly identified improvement areas gave us an opportunity to take our operational efficiency and team performance to the next level. We knew that if AI was going to become a meaningful part of the way we work, we first needed greater clarity around the parts of our process that were still difficult to measure and understand.
Our primary objective was to keep manual effort to a minimum while allowing AI to play an active role in guiding our decisions. Rather than adding another layer of operational work, we wanted AI to help us build a data-driven system that was more objective, more scalable, and easier to sustain. Our expectation was that AI would evolve into a key member of our operational model, enabling us to make better decisions and continuously improve team performance.
The Next Step: What Is Our Solution?
Clearly defining our operational challenges was only the first step. We now had a solid understanding of where our processes were falling short, but two fundamental questions still needed to be answered:
- What should we measure?
- How should we measure it?
Answering these questions would define the foundation of the operational model we wanted to build with AI.
What Should We Measure?
Our first step was to identify and categorize every operational challenge where we lacked data or visibility. This exercise made one thing clear: our existing operational tracking model was no longer sufficient. To address our newly identified needs, we introduced 6 additional metrics that would give us a much more comprehensive view of how our team operates.
Each of these 6 metrics was designed either to address a specific operational challenge or to complement the others by providing supporting insights. Rather than solving isolated problems, we set out to build a connected measurement framework in which every metric contributes to a clearer, more complete understanding of our operational performance.
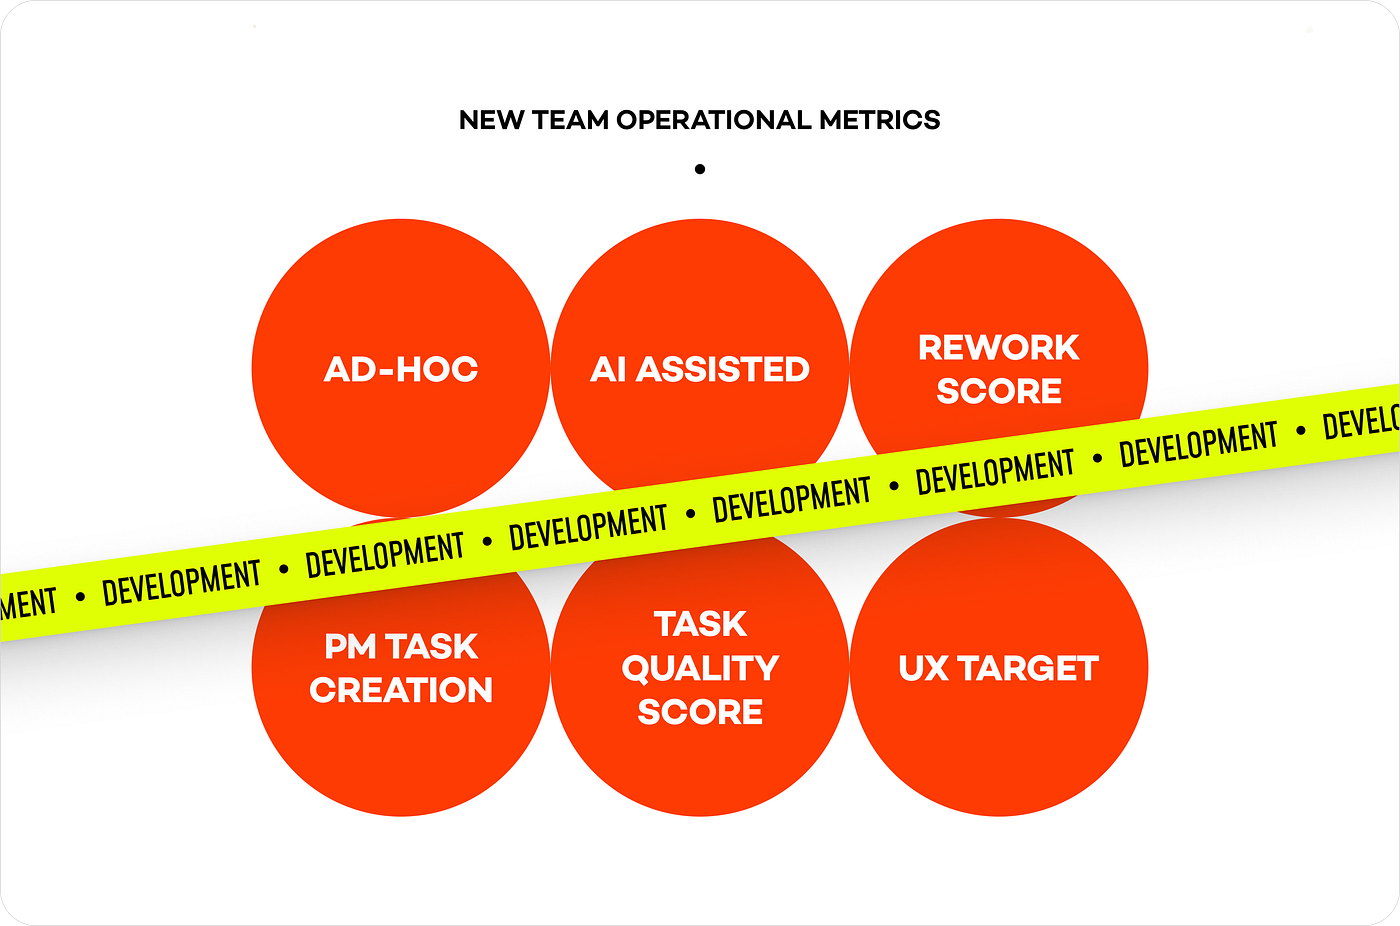
Existing OPS-CX-TEX-UX New Operational Metrics
With the Ad-hoc metric, we measure the proportion of work added after a sprint has started and the operational impact it creates for the team. To gain deeper insights, we categorize this work into three levels: Micro Ad- hoc, Managed Ad-hoc, and HeavyAd-hoc.
The AI Assisted metric gives us visibility into how frequently and to what extent AI is used across our tasks. This helps us identify where AI creates the greatest value and uncover new opportunities to integrate it more effectively into our daily workflows.
The Rework Score measures how often completed tasks re-enter the delivery cycle and helps us understand the reasons behind these iterations. By making rework visible, we can evaluate whether we asked the right questions, established the right context, and fully understood the problem before starting the design process.
The PM Task Creation metric tracks how many of the tasks entering a sprint are created by Product Managers versus those created by the design team. This provides better visibility into ownership distribution and highlights opportunities to strengthen collaboration between product and design.
The Task Quality Score evaluates the quality of our task descriptions. It considers key elements such as problem definition, success metrics, business motivation, and other contextual information that enables designers to clearly understand a task before beginning their work.
Finally, the UX Target metric measures how well our completed work aligns with both individual and team objectives. By tracking this alignment as a percentage, we can ensure that our day-to-day execution consistently contributes to our broader strategic goals.
How Would We Measure Them?
Once we had defined the metrics, the next challenge was determining how to measure them. None of the data we needed was readily available through Jira. Even if we attempted to collect it manually, the process would introduce significant operational overhead, require continuous effort, and ultimately be difficult to sustain. This is where the central player in our story came into the picture: AI.
From the very beginning, our approach was clear. We wanted AI to do more than simply help us collect data. We wanted it to automate measurement wherever possible, reduce manual work, and add another layer of value by interpreting the results we collected.
To make this possible, we designed 5 automations in n8n that power the data pipeline behind our new metrics. These automations continuously collect, enrich, and organize the information we need, allowing us to focus less on operational tasks and more on making informed decisions based on reliable data.
Our first automation focused on identifying and labeling tasks that we classify as Ad-hoc work. Every day at 5:00 PM, the automation checks for tasks that were moved from the backlog into an active sprint after the sprint had already started. It then evaluates each task’s Story Point value and automatically applies the appropriate label based on the rules we defined.
This automation gives us complete visibility into how many Ad-hoc tasks are introduced during each sprint, what percentage they represent of our completed work, and the operational impact they have on the team.
Our next goal is to take this one step further. We plan to move toward a model where Micro Ad-hoc tasks are handled entirely by AI, allowing the team to reduce operational overhead and focus on work that requires deeper product thinking and design expertise.
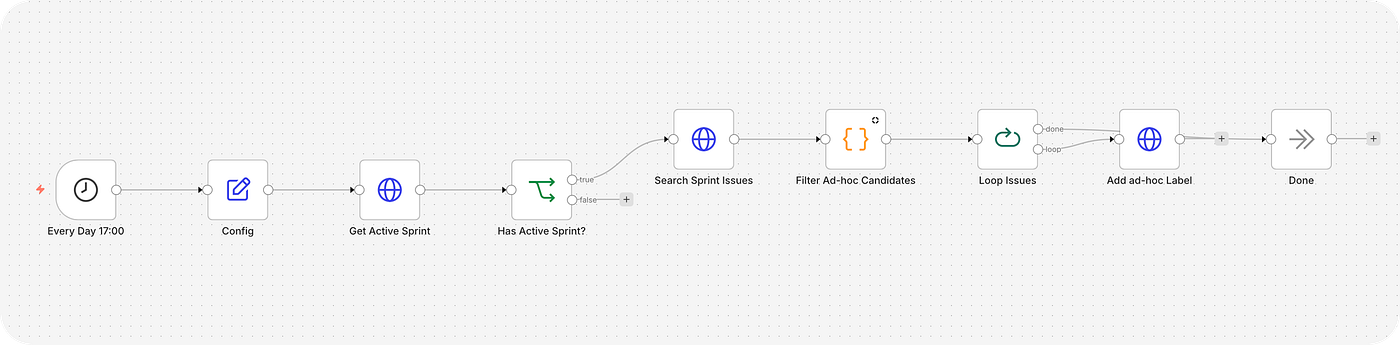
Automating Ad-hoc Labeling with n8n
Our second automation focuses on one of the areas we care about most as a team: Task Quality Score.
Because we work in a fast-paced product development environment, we often have to begin work without sufficient context or detailed information. As a result, we frequently encounter additional clarification sessions, increased meeting overhead, and a higher risk of rework.
To address this challenge, we developed an automation that allows AI to evaluate every task and generate a Task Quality Score. Beyond assigning a score, AI also provides detailed feedback explaining which parts of the task require additional information and why. This gives the team actionable guidance instead of just a numerical assessment.
Our immediate goal is to improve every task with a quality score below 60%. We want AI to help us establish a consistent standard where every task includes a clear problem definition, user motivations and pain points, success metrics, and the critical context designers need before they begin their work.
Our next milestone is to raise the Task Quality Score to 75%. This target is important because our long-term vision extends beyond improving documentation quality. Once task descriptions consistently reach this level, we plan to use AI to generate a significant portion of our design briefs automatically. For us, task quality is not just another operational metric. It is one of the foundational building blocks of the AI-enabled way of working we are building for the future.

Automating Task Quality Scoring with n8n
Our third automation focuses on the PM Task Creation metric.
In this automation, we identify our Product Managers within the AI workflow and log the creator of every newly created task. This allows us to track, on a sprint-by-sprint basis, what percentage of tasks are initiated by Product Managers. Beyond measurement, the automation also helps reinforce a shared understanding of the structure, context, and level of detail expected when Product Managers create tasks for the Product Design team.
Our next objective is to further mature the way we collaborate around product and business initiatives. In the long term, we aim to establish a workflow in which the vast majority of product and business-driven tasks are created by Product Managers. This ensures that ownership starts with the right stakeholders, while designers can focus on solving well-defined problems rather than filling in missing context.
Our fourth automation focuses on the UX Target metric.
At the beginning of each year, every team member defines individual development goals. However, we previously had no clear way to understand how much of our day-to-day work actually contributed to those goals. As a result, the alignment between our long-term objectives and our daily execution was largely based on assumptions. With this automation, we can now measure, sprint by sprint, how many of our tasks directly support individual development goals.
To make this possible, we first collected everyone’s goals in a shared Google Sheet. We then provided these goals to AI so it could understand each team member’s focus areas. As the quality of our task descriptions improves, AI analyzes the content of each task, compares it with the assigned designer’s goals, and automatically adds a “ux-target” label whenever it identifies a meaningful alignment. This allows us to measure an area that was previously invisible.
Our goal is to build a sustainable way of working in which at least 30% of our daily operational work directly contributes to the individual goals of our team members. By making this alignment measurable, we can ensure that professional growth is supported not only through dedicated learning initiatives but also through the work we do every day.
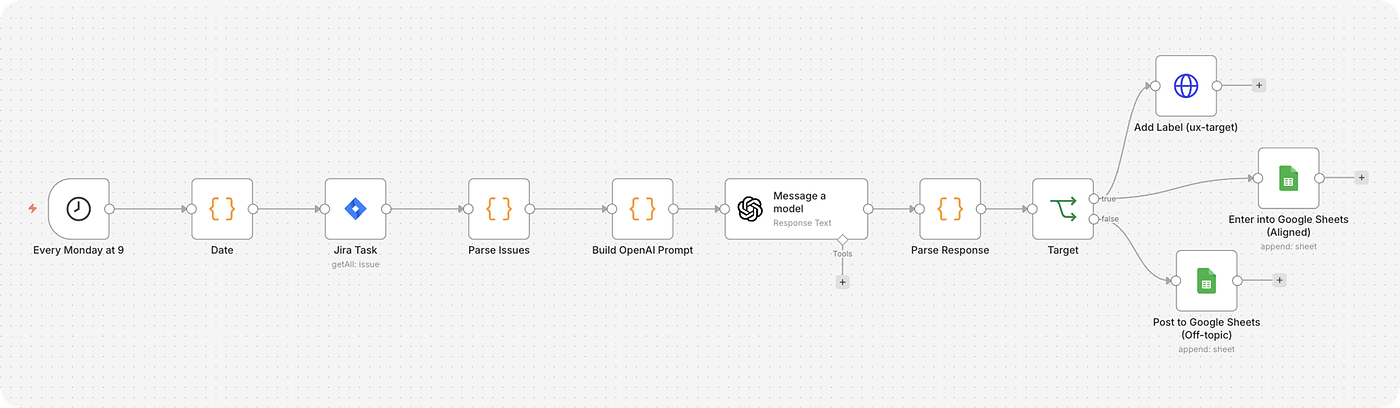
Automating UX Target Labeling with n8n
Our fifth and final automation is the SP Calculator, a solution we developed to reduce the inconsistencies we observed in our team’s Story Point (SP) estimations.
Unlike our other automations, the SP Calculator is built as a hybrid model that combines structured manual input with AI-powered decision making.
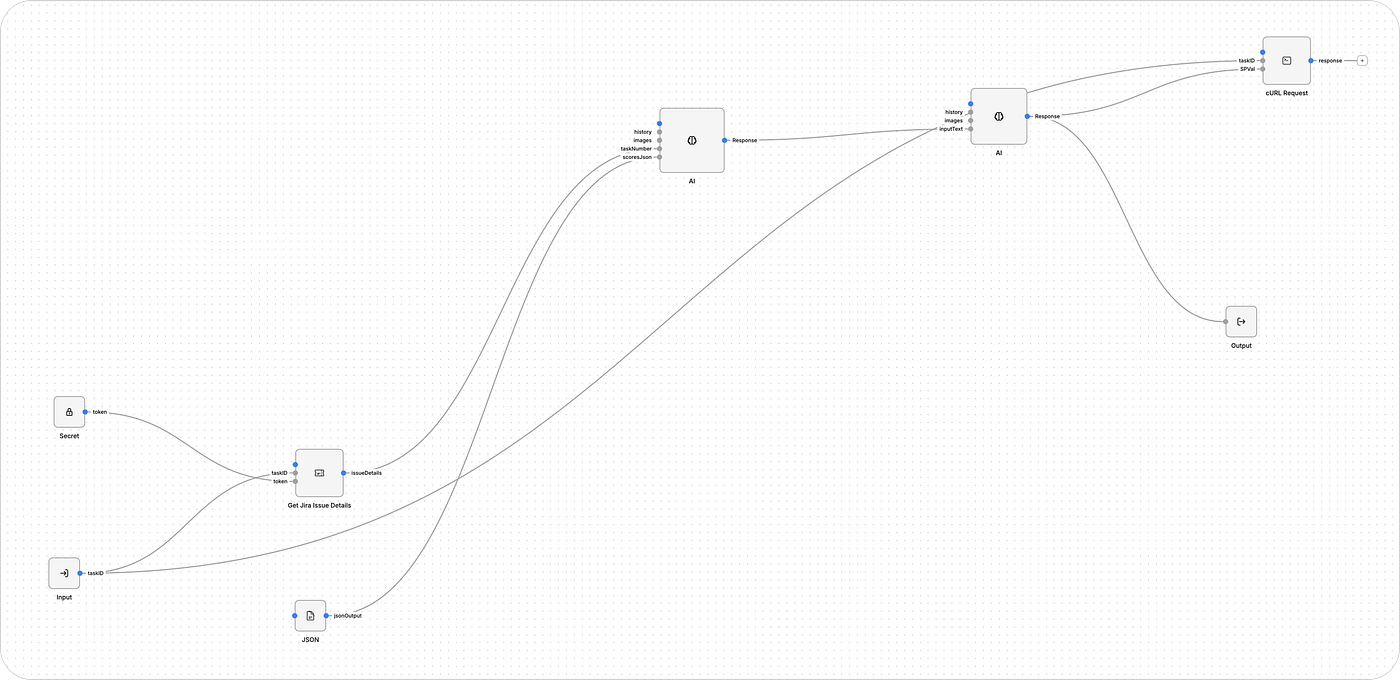
Automating Story Point with Voyager Workflows
When a new task is created, the team selects values across four predefined dimensions: Type, Modifier, Duration, and Repetition. Based on these inputs, AI applies the estimation model we designed and automatically assigns a Story Point value to the task.
Instead of relying solely on individual judgment for every estimation, this approach allows us to estimate effort using a shared framework agreed upon by the entire team. As a result, we achieve more consistent and standardized Story Point estimations while reducing subjective variation across designers.
Our next milestone is to eliminate the need for these manual inputs altogether. Once the quality of our task descriptions reaches the desired level, we want AI to read the task, understand its context, and estimate the required effort directly from the content itself. This is the long-term vision behind the SP Calculator: a more intelligent estimation model that continuously improves the consistency and reliability of Story Point planning.
In addition to our automations, we introduced several small but impactful improvements to our Jira workflow. One of the most important enhancements supports our AI Assisted metric.
When a task is moved to the Done status, team members can now indicate the level of AI support used throughout that task. This allows designers to record how extensively AI contributed to their work, while giving the team clear visibility into where and how AI is being adopted across our workflow.
This enhancement goes beyond simply reporting AI usage on dashboards. It also helps us identify which types of work benefit most from AI, enabling us to discover new opportunities for adoption and continuously refine how we integrate AI into our design process.
Our long-term goal is to achieve an annual AI adoption rate of 25% across the team. From repetitive operational activities to content creation and design support, we want AI to become a natural and sustainable part of the way we work every day.
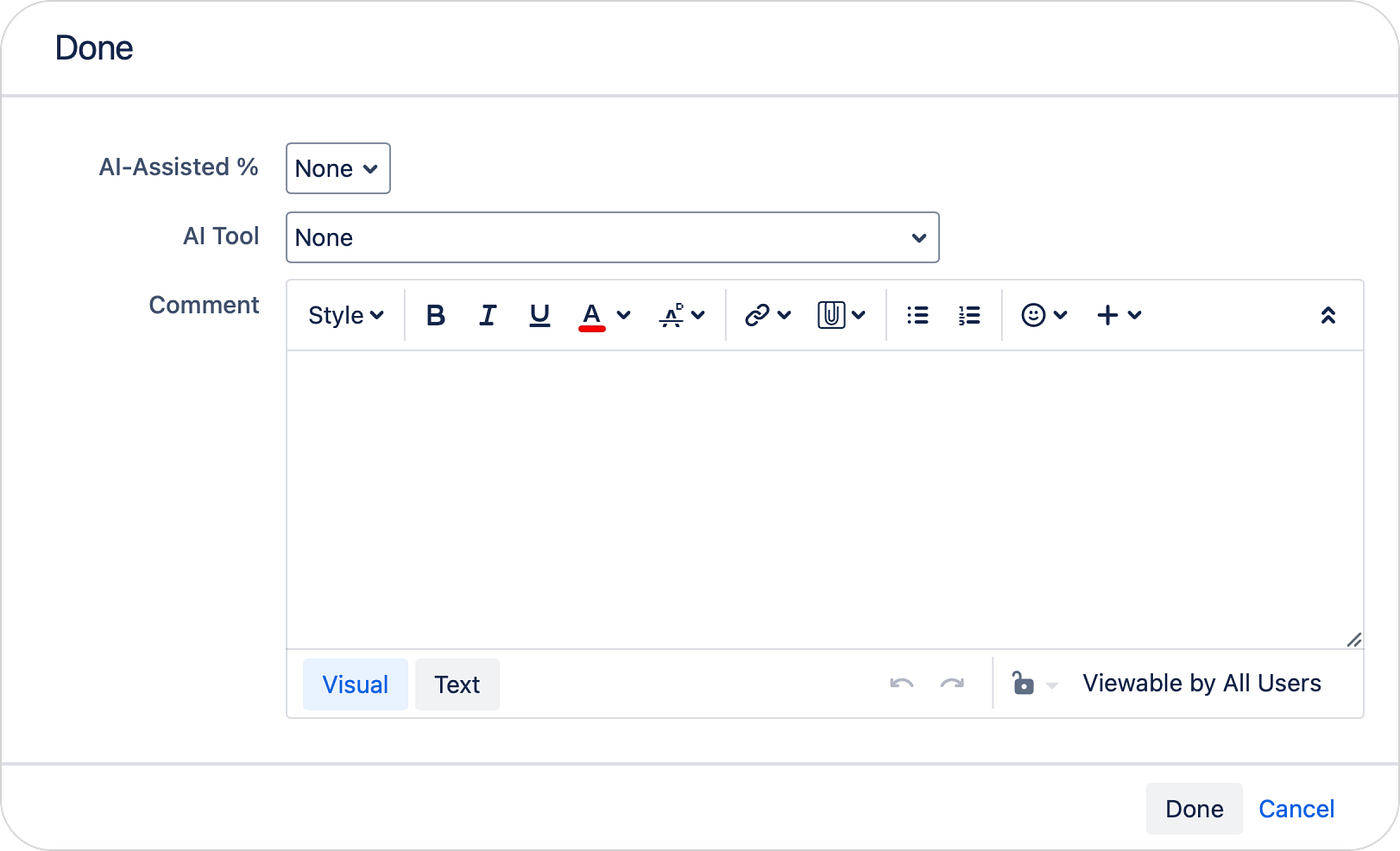
AI Assisted
The Final Step: How Do We Measure Success?
Once the operational model was in place, the final step was defining what success would actually look like. Collecting data alone was never our objective. We wanted to better understand our team’s capabilities, identify our limits, and make our improvement opportunities more visible.
To achieve this, we established clear targets for every metric we introduced. Without meaningful benchmarks, the data itself would provide little value. Defining success criteria gave us the context needed to evaluate our progress and make better decisions over time.
For some metrics, we deliberately set conservative targets because we were still exploring the team’s current capacity and had limited historical data. For others, where we already had stronger visibility and greater confidence in our baseline, we were able to define more ambitious goals. This balanced approach allowed us to improve with confidence while continuously refining our expectations as we learned more.
Today, we have reached a point where we can clearly measure areas that were previously invisible to us. For example, we have moved from having no understanding of our Ad-hoc workload to knowing that approximately 20% of our completed tasks are Ad-hoc work. This gives us a much clearer picture of the operational load placed on the team.
We have achieved similar visibility with our AI Assisted metric. What was once an assumption is now measurable. We can now see that 23% of our completed tasks involve AI support, allowing us to better understand where AI is creating value and how its adoption is evolving across the team.
The Task Quality Score revealed another important insight. Our current score of 14% showed that the quality of our task definitions is still far below our expectations. While this highlighted a significant improvement opportunity, it also gave us a clear baseline from which we can track future progress.
We can also now demonstrate with data that 27% of our completed tasks are directly aligned with the individual goals of our team members. This allows us to better understand the relationship between our strategic objectives and the work we deliver every day.
Finally, we have seen meaningful progress in our PM Task Creation metric. The percentage of tasks created by Product Managers has increased from 40% to 60%, giving us stronger evidence that ownership and collaboration between Product and Design are moving in the right direction.
In Conclusion
By evaluating all 14 metrics on a quarterly basis, we can now understand our improvement journey with far greater clarity. This approach allows us not only to assess our current performance but also to measure how much closer we move toward our goals each quarter.
As a result, we increased our overall goal achievement rate from 68% in Q1 to 87% in Q2.

Overall Operational Success Score
More importantly, our AI-powered operational model has made previously invisible areas measurable. Instead of relying on assumptions or intuition, we can now understand our team’s performance through objective data, enabling better decisions and more focused improvements.
For us, however, these metrics are not the final outcome. They are the foundation of a new way of operating. We believe the future of AI in Product Design is not just about generating better designs or producing outputs faster. It is about helping teams better understand how they work, identify operational bottlenecks earlier, and continuously improve through measurable insights.
This is the direction we are building toward as the OPS-CX-TEX-UX team. AI is becoming more than a productivity tool. It is evolving into a teammate that helps us measure what matters, make better decisions, and build a more sustainable way of working. Looking ahead, we believe the most successful Product Design teams will not be those that simply use AI the most, but those that learn with AI, measure with AI, and continuously improve because of AI.
Before moving on, I would like to recognize the incredible effort of my teammates throughout this journey. From designing and implementing the automations to taking ownership of our goals and driving this transformation forward, every team member played a meaningful role. This was not the result of individual contributions, but of a team that learned, experimented, and grew together.
My sincere thanks go to Berna İrem Ay, Burçin Ece Ertürk, Elif Öziş, Emirhan Seferoğlu, Ezgi Tam, Feyza Nur Khassanov, Hilal Toksal, Mert Yağcı, Sena Sevinen, and Sima Demir for their dedication, ownership, and invaluable contributions throughout this journey.
Ready to take your career to the next level? Join our dynamic team and make a difference at Trendyol.
메타데이터
- post_id
- c510cb0de370
- slug
- ai-powered-design-operations-measurement-automation-and-operational-performance-c510cb0de370
- url
- https://medium.com/trendyol-tech/ai-powered-design-operations-measurement-automation-and-operational-performance-c510cb0de370
- canonical_url
- https://medium.com/trendyol-tech/ai-powered-design-operations-measurement-automation-and-operational-performance-c510cb0de370
- author_url
- https://medium.com/@_thenatural
- status
- ok
- fetched_at
- 2026-07-13 17:23:08