WireShark — 1
Lets learn about wireshark with the help of the book Practical Packet Analysis by Chris Sanders
WireShark — 1

Lets learn about wireshark with the help of the book Practical Packet Analysis by Chris Sanders
A Brief History of Wireshark
Gerald Combs, a computer science graduate of the University of Missouri at Kansas City, originally developed it out of necessity. The very first version of Combs’ application, called Ethereal, was released in 1998 under the GNU Public License (GPL). Eight years after releasing Ethereal, Combs left his job to pursue other career opportunities. Unfortunately, his employer at that time had full rights to the Ethereal trademarks, and Combs was unable to reach an agreement that would allow him to control the Ethereal “brand.” Instead, Combs and the rest of the development team rebranded the project as Wireshark in mid-2006. 28 Chapter 3 Wireshark has grown dramatically in popularity, and its collaborative development team now boasts over 500 contributors. The program as it exists under the Ethereal name is no longer being developed.
The Benefits of Wireshark
- Finding Easy Targets: Quickly identifies devices on the network and what software they are running without sending loud, suspicious scans.
- Stealing Credentials: Hooks into unencrypted traffic to grab passwords, usernames, and session tokens in plain text.
- Listening In: Lets you read private communications (emails, chats, or web traffic) by reconstructing data streams.
- Checking Your Stealth: Allows you to look at your own “attack” traffic to make sure it looks like normal web browsing and won’t get caught by security sensors.
- Finding “Loot”: Lets you extract files (like documents or installers) directly from the air as they are being sent across the network.
- Mapping the Network: Reveals how data flows between servers, helping you find the most important targets (like databases or admin consoles) to hit next.
- Testing Modern Attacks: Helps you verify if complex attacks, like Man-in-the-Middle or packet injection, are actually working in real-time.
Your First Packet Capture
- The first thing is that there is always something wrong on the network. If you don’t believe me, then go ahead and send an email to all of your employees and let them know that everything is working perfectly.
- Secondly, there doesn’t have to be something wrong in order for you to perform packet analysis. In fact, most packet analysts spend more time analyzing problem-free traffic than traffic they are troubleshooting; you need a baseline to compare to in order to be able to effectively troubleshoot network traffic.
- For example, if you ever hope to solve a problem with DHCP by analyzing its traffic, you must understand what the flow of working DHCP traffic looks like. More broadly, in order to find anomalies in daily network activity, you must know what normal daily network activity looks like. When your network is running smoothly, you can set your baseline so that you’ll know what its traffic looks like in a normal state
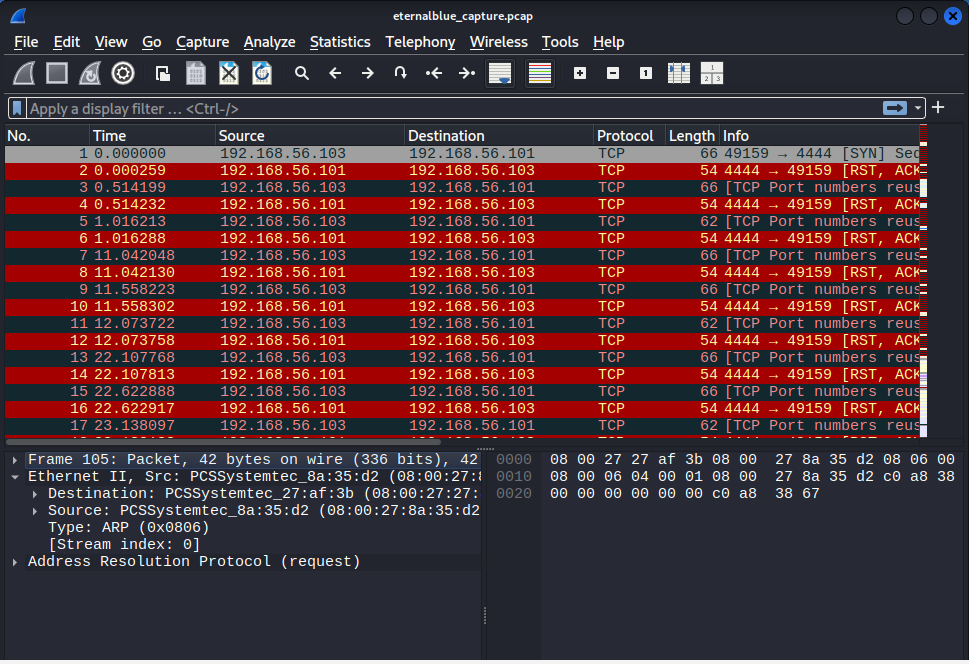
“The List Pane finds the Moment, the Details Pane explains the Method, and the Bytes Pane reveals the Message. To be a master analyst, you must keep one eye on the ‘Flow’ (Top) and the other on the ‘Raw Data’ (Bottom).”
PACKET COLORS
Packet Color Coding If you are anything like me, you may have an aversion to shiny objects and pretty colors. If that is the case, the first thing you probably noticed when you opened Wireshark were the different colors of the packets in the Packet List pane. It may seem like these colors are randomly assigned to each individual packet, but this is not the case.
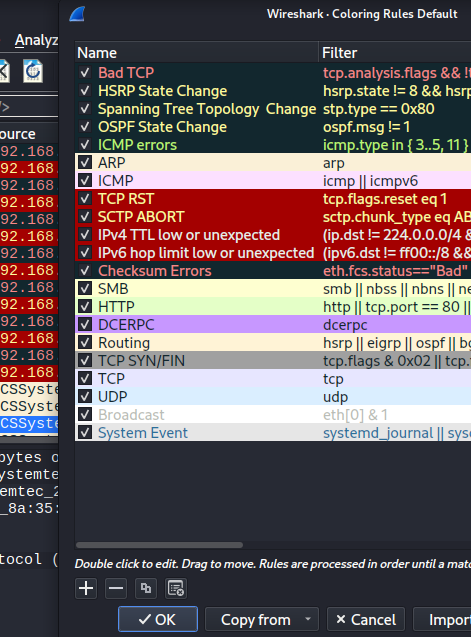
Each packet is displayed as a certain color for a reason. Wireshark’s color coding allows for quick protocol identification. Wireshark makes it easy to see which colors are assigned to each protocol through the Coloring Rules window.
- To open this window, follow these steps: 1. Open Wireshark. 2. Select View from the main drop-down menu. 3. Click Coloring Rules. The Coloring Rules window should appear , displaying a complete list of all the coloring rules defined within Wireshark.
You can define your own coloring rules and modify existing ones. The Coloring Rules dialog allows you to view and modify the coloring of packets. Introduction to Wireshark 37 For example, to change the color used as the background for HTTP traffic from the default green to lavender, follow these steps:
-
Open Wireshark and access the Coloring Rules dialog (ViewColoring Rules).
-
Find the HTTP coloring rule in the coloring rules list, and select it by clicking it once.
-
Click the Edit button.
-
Click the Background Color button — When editing a color filter, you can modify both foreground and background color.
-
Select the color you wish to use on the color wheel and click OK.
-
Click OK twice more to accept the changes and return to the main window.
-
The main window should then reload itself to reflect the updated color scheme.
As you work with Wireshark on your network, you will begin to notice that you work with certain protocols more than others. Here’s where colorcoded packets can make your life a lot easier. For example, if you think that there is a rogue DHCP server on your network handing out IP leases, you could simply modify the coloring rule for the DHCP protocol so that it shows up in bright yellow or some other easily identifiable color. This would allow you to pick out all DHCP traffic much more quickly and make your packet analysis more efficient.
MERGING CAPTURED FILES
Certain types of analysis require the ability to merge multiple capture files, and luckily, Wireshark provides two different methods for doing this. To merge a capture file, follow these steps:
-
Open one of the capture files you want to merge.
-
Choose FileMerge to bring up the Merge with Capture File dialog
-
Select the new file you wish to merge into the already open file, and then select the method to use for merging the files. You can prepend the selected file to the currently open one, append it, or merge the files chronologically based on their timestamps.
Filtering (Noise Reduction)
Wireshark is a firehose. On a busy network, you might capture 10,000 packets in a minute. Sanders teaches that you must ruthlessly eliminate what you don’t need.
1. Capture Filters vs. Display Filters
1. Capture Filters
These decide what gets into Wireshark in the first place.
- When: Set before you start the capture.
- Impact: If a packet is filtered out, it is discarded forever. It never touches your hard drive or Wireshark’s memory.
- Syntax: Uses BPF (Berkeley Packet Filter) syntax. It’s shorter but more limited (e.g.,
tcp port 80). - Best For: High-traffic networks where you don’t want to crash your computer by trying to record every single packet.
2. Display Filters
These decide what you see on your screen from the data you’ve already saved.
- When: Set any time (during or after a capture).
- Impact: They just hide the “noise.” All the original data is still there; if you clear the filter, the “hidden” packets reappear.
- Syntax: Uses Wireshark’s own Boolean syntax. It is much more powerful and specific (e.g.,
tcp.port == 80). - Best For: Detailed investigation and “hunting” through a completed capture.
Red Team Tip: Use a Capture Filter to exclude your own IP address so you don’t accidentally fill up your file with your own “attack” traffic. Then, use Display Filters to search the remaining data for the “loot” you want!
2. DISPLAYING FILTERS
The Filter Expression Dialog
To access this dialog, click the Capture Filter button in the Capture Options dialog and then click the Expression button. These fields specify all possible filter criteria. To create a filter, follow these steps:
-
To view the specific criteria fields associated with a protocol, expand that protocol by clicking the plus (+) symbol next to it. Once you find the criteria you want to base your filter on, select it by clicking it.
-
Select the relation that the field you have selected will have to the criteria value you supply. This relation is specified in terms of equal to, greater than, less than, and so on.
-
Create your filter expression by specifying a criteria value that will relate to the field you selected. You can define this value or select it from predefined values programmed into Wireshark.
-
Once you have done this, click OK to view the completed text-only version of the filter you have just created.
FILTER EXPRESSION STYLE
The simplest way to filter is by protocol name.
- Show only specific traffic: Type the protocol name (e.g.,
tcp,udp,http). - Hide specific traffic: Use the “not” symbol (
!). - Example:
!icmpremoves all Ping traffic so you can focus on other data.
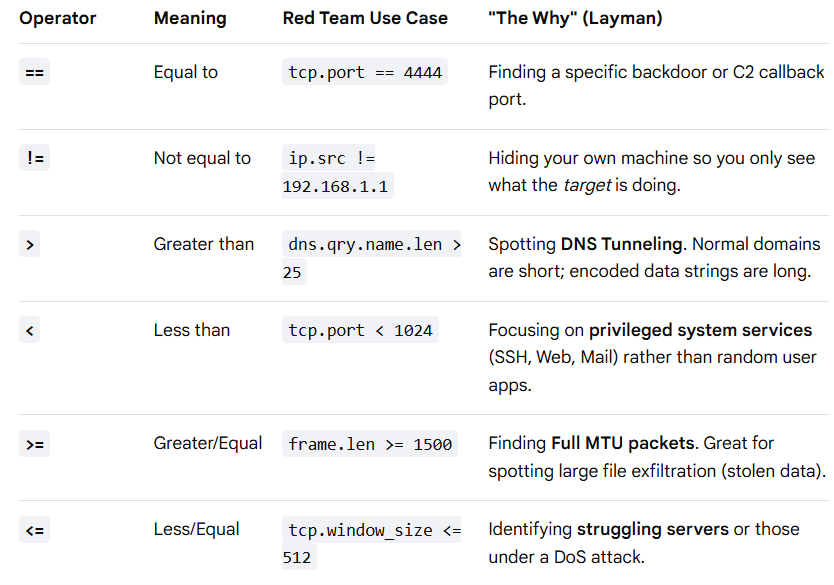
2. Comparison Operators (The “Math”)
These allow you to find packets based on specific values like IP addresses or file sizes.
3. Logical Operators (The “Connectors”)
Use these to combine multiple rules into one powerful statement.
**and**: Both things must be true.
Example: host 192.168.0.1 and port 80 (Traffic for that IP that is also web traffic).
**or**: Either one can be true.
Example: ip.addr == 1.1.1.1 or ip.addr == 8.8.8.8 (Traffic from either of these two IPs).
**xor: One must be true, but not both**. (Rarely used, but good for specific troubleshooting).**not**: Neither condition is true.- Example:
not dns(Hides all DNS traffic).
4. Saving Your Filters (Efficiency)
Don’t type the same long string every day. Save them:
- Go to Capture > Capture Filters (or Display Filter dialog).
- Click New.
- Filter Name: Give it a nickname (e.g., “My Web Traffic”).
- Filter String: Type the actual command (e.g.,
tcp.port == 80).
Quick-Reference Examples
**host www.google.com**: Everything to/from Google.**host www.google.com and not (port 80): Shows Google traffic that is not** standard unencrypted web traffic.**!dns*: "Show me everything except* the DNS clutter."- The Command:
!(ip.addr == 192.168.1.50)(Show me everything except my own machine).
3. Compound Logic (The Power of “&&” and “||”)
- The Logic:
(ip.addr == 10.0.0.5 && tcp.flags.syn == 1) && !tcp.port == 443 - Translation: “Show me all connection attempts to the server that aren’t on the standard web port.” This is how you find hidden backdoors.
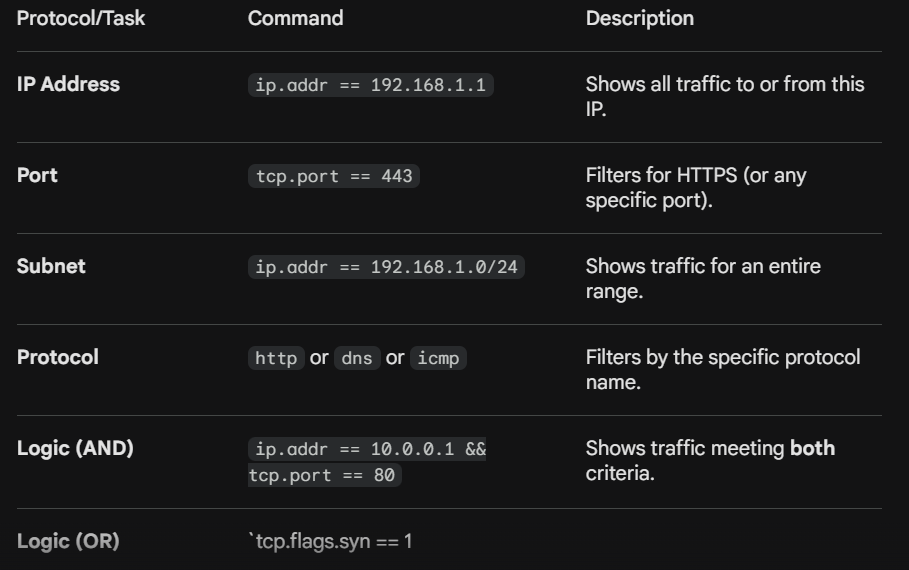
Essential Display Filters summary
Display filters don’t delete data, they just hide it from view. These are the most common commands you will use:
2. Physical & Logical Identification
**eth.addr == [MAC]**: Filters by Hardware (MAC) address. Useful for finding a specific device on a local network regardless of its IP.**http.request.method == "POST"**: Great for finding login attempts or data uploads.**tcp.flags.push == 1**: Helps identify where data is actually being handed off to the application.
3. The “Right-Click” Shortcuts
The book emphasizes that you don’t always need to type filters. Use these UI capabilities:
- Follow TCP Stream: Right-click a packet > Follow > TCP Stream. This reassembles the fragmented packets into a readable “conversation.”
- Coloring Rules: Use these to visually distinguish between “Bad TCP” (black/red) and normal traffic.
- Conversation Statistics: Go to Statistics > Conversations. This shows you who is talking to whom and who is the “top talker” (consuming the most bandwidth).
FINDING AND MARKING PACKETS
Once you really get into doing packet analysis, you will eventually encounter scenarios involving a very large number of packets. As the number of these packets grows into the thousands and even millions, you will need to be able to navigate through packets more efficiently. This is the reason Wireshark allows you to find and mark packets that match certain criteria.
To find packet
- To find packets that match particular criteria, open the Find Packet dialog by either selecting Edit from the main drop-down menu and then clicking Find Packet or pressing CTRL-F
- Once you’ve made your selections, enter your search string in the text box, and click Find to find the first packet that meets your criteria. To find the next matching packet, press CTRL-N, or find the previous matching packet by pressing CTRL-B.
To mark a packet
- Marking Packets Once you have found the packets that match your criteria, you can mark those of particular interest. Marked packets stand out with a black background and white text. (You can also sort out only marked packets when saving packet captures.) There are several reasons you may want to mark a packet, including being able to save those packets separately, or to be able to find them quickly based upon the coloration.
- To mark a packet, right-click it in the Packet List pane and choose Mark Packet from the pop-up. Or, single click a packet in the Packet List pane and press CTRL-M to mark it. To unmark a packet, toggle this setting off using CTRL-M again. You may mark as many packets as you wish in a capture. You can jump forward and backward between marked packets by pressing SHIFT-CTRL-N and SHIFT-CTRL-B, respectively.
ADVANCED WIRESHARK FEATURES
1. Name Resolution: The “Who’s Who” of the Network
Imagine walking into a party where everyone is wearing a barcode instead of a name tag. You can’t tell who is who. Name Resolution turns those barcodes (IP addresses like 192.168.1.5) into names (like CEO-LAPTOP).
In an engagement, you aren't looking for "IPs", you are looking for targets. Enabling Name Resolution allows you to instantly spot high-value assets like Domain Controllers or SQL Databases.
- Pro Tip: Be careful! “External” name resolution (asking the internet for names) can leak your presence to a defender’s firewall. Red Teamers often use MAC name resolution to identify the brand of a device (e.g., seeing “Cisco” or “Apple” based on the hardware address) without sending a single suspicious packet.
How to Activate:
- Go to View > Name Resolution.
- Check Resolve Network Addresses (for IPs) and Resolve MAC Addresses (for hardware brands).
- Note: To avoid “leaking” your presence to the internet, go to Edit > Preferences > Name Resolution and ensure “Use an external network name resolver” is unchecked.
- Where/When to Use: Use this the moment you open a capture. It instantly changes “192.168.1.12” to “HR-PRINTER” or “CEO-MACBOOK,” letting you ignore the printer and focus on the high-value target.
2. Protocol Dissection: The “Universal Translator”
Data traveling over the internet is just a long string of 1s and 0s. A “dissector” is like a translator that takes that gibberish and turns it into a readable format .Defenders often try to hide traffic by running it on “weird” ports (like putting a spy in a janitor’s uniform). They might run a secret database on Port 80 (usually for websites).
- The “Decode As” Trick: If you see traffic that looks like junk, you can force Wireshark to “Decode As” a different protocol. If you suspect a “secret” chat is actually a Command & Control (C2) channel, forcing a dissector can reveal the hidden commands being sent to a botnet.
How to Activate:
- Find a suspicious packet in the list.
- Right-click it > Select Decode As…
- In the popup, go to the Current column and select the protocol you think it actually is (e.g., change “DATA” to “HTTP” or “SSL”).
- Where/When to Use: Use this when you find traffic on non-standard ports. If you see a lot of traffic on Port 8080 that Wireshark just calls “TCP,” forcing it to “Decode As” HTTP might reveal a hidden administrative login panel.
3. Following TCP Streams: Reading the Whole Transcript
Instead of looking at 500 separate text messages, “Following a Stream” lets you read the entire conversation from start to finish in one window.
When a user logs into an old internal website (HTTP), Following the TCP Stream reconstructs the login page. You’ll see the username and password fields exactly as they were typed. It’s also vital for exfiltration: you can see exactly what file was stolen by looking at the reconstructed stream
How to Activate:
- Right-click any packet that is part of a conversation.
- Select Follow > TCP Stream.
- A new window pops up showing the conversation in plain text (Red text is what the client sent, Blue is what the server sent).
- Where/When to Use: Use this for Credential Harvesting. If you see an unencrypted login attempt, following the stream is the only way to see the “User: admin / Pass: Password123” string in its original form.
4. Protocol Hierarchy
This is a pie chart for your network. It shows you what percentage of your data is video, what is web browsing, and what is “other.”As a red teamer,If you want to blend in,If the Protocol Hierarchy shows that 99% of the network is HTTPS, but your hack is using a “Custom Protocol,” you stick out like a sore thumb. Use this window to see what the “normal” traffic looks like so you can make your malware mimic the most common protocol in that specific office.
How to Activate:
- Go to the top menu: Statistics > Protocol Hierarchy.
- Where/When to Use: Use this for Stealth Validation. Before you launch a big attack, look at this window. If the network is 95% “BitTorrent” or “Netflix,” you can hide your data inside those protocols. If it’s 95% “Office 365,” you should change your attack to look like web traffic so you don’t stand out
5. Endpoints — suspect list
This is a list of every single device that has “spoken” during the capture. It shows who is the “loudest” person in the room. This is how you find the Admin. Look for an endpoint that is talking to every other computer on the network. That is likely a backup server or an IT admin’s machine. It’s also how you check your own OpSec (Operational Security): if your hacking laptop is the “loudest” endpoint in the list, you’re about to get caught.
How to Activate:
- Go to Statistics > Endpoints.
- Click the IPv4 or IPv6 tabs to see the list of devices.
- Where/When to Use: Use this for Target Discovery. Sort the list by “Bytes.” The devices at the top are the busiest. In a red team scenario, the “busiest” internal device is often a File Server or a Database — exactly where the sensitive data lives.
6. Conversations: Mapping the Relationship
If “Endpoints” is a list of people, “Conversations” is a list of who is talking to whom. In a hack, you often perform Lateral Movement (jumping from one computer to the next). Defenders look for “unusual pairings” — like a receptionist’s computer talking directly to the HR server at 3:00 AM. Use the Conversations window to ensure your traffic looks like a normal business interaction rather than a heist.
How to Activate:
- Go to Statistics > Conversations.
- Click the TCP tab to see who is talking to whom.
- Where/When to Use: Use this for Lateral Movement Tracking. If you have compromised one computer (Computer A), use this tool to see which other computers (Computer B, C, and D) it normally talks to. You can then “jump” to those computers because they already “trust” the one you control.
UNDERSTANDING THE FLOW OF TRAFFIC
A single packet is just a word; the “Flow” is the story.
If you only look at one packet, you’re looking at a freeze-frame. If you look at the Flow, you’re watching the movie. being able to read this “story” tells you if your exploit worked, if you’re being blocked, or if you’re walking into a trap.
1. The Foundation: The TCP 3-Way Handshake
Before any data (like a password or a web page) is sent, TCP must establish a “contract” between two computers. This is the SYN, SYN-ACK, ACK sequence.
Imagine two people trying to start a phone call:
- SYN (Synchronize): Person A says, “Hey, can you hear me? I want to talk.”
- SYN-ACK (Synchronize-Acknowledge): Person B says, “Yes, I hear you! Can you hear me too?”
- ACK (Acknowledge): Person A says, “Gotcha! Loud and clear. Let’s talk.” If any of these steps fail, the call never happens.
In Wireshark, you aren’t just looking for these flags; you are looking for the Sequence (Seq) and Acknowledgment (Ack) numbers.
- The Math: If Person A sends a SYN with
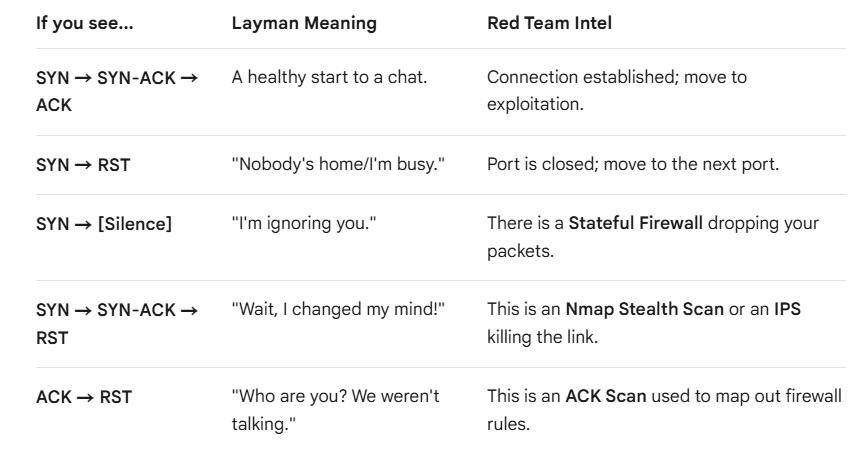
Seq=0, Person B must reply with a SYN-ACK whereAck=1. - Utility: If you see a SYN followed by a RST (Reset), the port is closed. If you see a SYN followed by nothing, a firewall is “dropping” your packet into a black hole.
2. Analyzing the “Service Flow” (The Conversation)
Once the handshake is done, data starts moving. Sanders emphasizes that you must follow the Flow to see the “Service” in action.
It’s like following a conversation in a crowded room. You ignore everyone else and only listen to the two people talking. In Wireshark, this is called “Following the Stream.”
TCP Retransmissions (The “Stutter”):
- The Anomaly: You see the same packet sent multiple times.
- Red Team Logic: The network is congested, or — more interestingly — an IPS (Intrusion Prevention System) is dropping your exploit packets mid-stream. If your “Handshake” was successful but your “Data” packets are being retransmitted, the firewall is letting you in the door but killing your “luggage.”
The “Zero Window” (The “I’m Full” Signal):
- The Anomaly: The target sends a packet saying
Win=0. - Red Team Logic: The target’s memory buffer is full. As a Red Teamer, this is a sign that the target is under heavy load or that your previous exploit attempt caused a memory leak/crash.
3. Identifying “Evil” in the Flow
When you look at the flow, “Evil” usually looks like a “broken” conversation.
The “Out-of-Order” Attack:
- The Flow: You see packets arriving in the wrong order (e.g., Data, then Handshake, then more Data).
- Red Team Logic: You are likely using Fragmentation or Overlapping TCP Segments to confuse a firewall. You’re trying to make the firewall “see” something different than what the target server “sees.”
The “Half-Open” Ghost:
- The Flow: A massive wave of SYN packets with no ACKs.
- Red Team Logic: This is a SYN Flood (DoS) or a stealth Nmap SYN Scan. By never sending the final “ACK,” the attacker ensures the connection is never fully “logged” by the application, staying in the “shadows” of the kernel.
4. Summary Table: The Story of a Connection
“Don’t get distracted by individual packets. Use the ‘Follow TCP Stream’ feature. It strips away all the technical ‘envelope’ information and shows you the raw data. If you see ‘Password=’ followed by ‘Admin123’, the ‘Flow’ has just handed you the keys to the kingdom.”
메타데이터
- post_id
- 014fa1f36d2f
- slug
- wireshark-1-014fa1f36d2f
- url
- https://medium.com/@mug1sh4/wireshark-1-014fa1f36d2f
- canonical_url
- https://medium.com/@mug1sh4/wireshark-1-014fa1f36d2f
- author_url
- https://medium.com/@mug1sh4
- status
- ok
- fetched_at
- 2026-06-15 20:49:13