Fed Rate Cut Sparks Stock Market Rally: S&P 500, Nasdaq Soar in 3rd Week of September 2024
Technical market recap for the week of Sep 16–20, 2024. Fed’s surprise 0.5% rate cut ignites market rally. S&P 500 and Nasdaq both up 19.6%…
Fed Rate Cut Sparks Stock Market Rally: S&P 500, Nasdaq Soar in 3rd Week of September 2024
Technical market recap for the week of Sep 16–20, 2024. Fed’s surprise 0.5% rate cut ignites market rally. S&P 500 and Nasdaq both up 19.6% YTD, Dow hits record high. Analysis of sector rotation, small-cap performance, and look forward to the week ahead. Trade idea: BDC and VCYT.

Economic data sources: investor.com | Edward Jones | MarketWatch | SPDR ETFs
Summary:
Last week’s financial markets witnessed a seismic shift as the Federal Reserve delivered a larger-than-expected rate cut, igniting a rally across major indices.
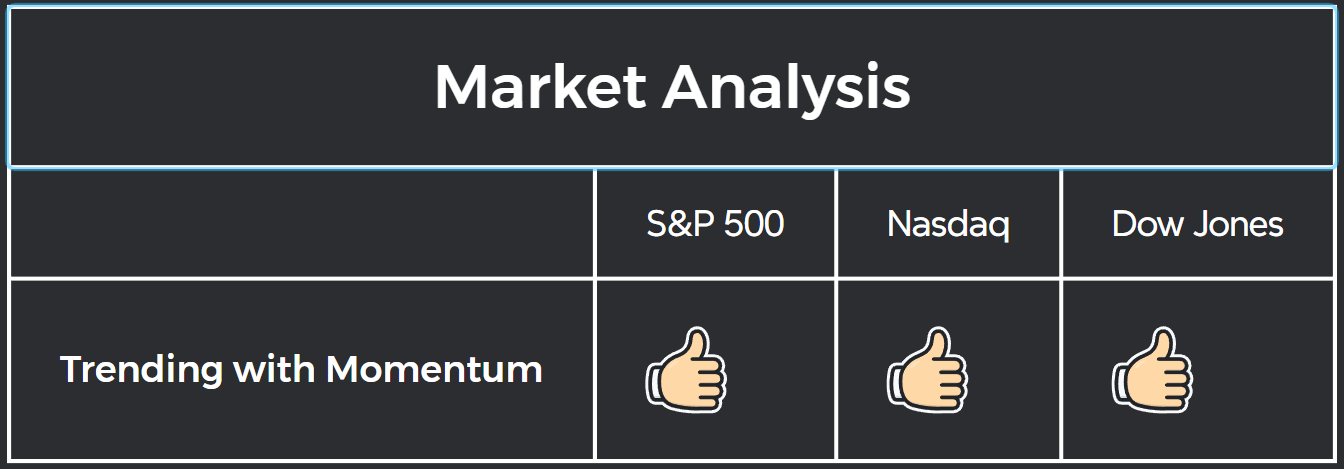
All three indices are continuing the bullish momentum
Two out of three major markets just broke out from their ranges.
The S&P 500 surged to new heights, posting a robust weekly gain of 1.4%. This impressive performance pushed the benchmark index’s year-to-date returns to 19.6%.
The tech-heavy Nasdaq Composite recorded a solid 1.5% weekly increase. The index now stands at 17,948, mirroring the S&P 500 with a 19.6% year-to-date advance.
The Dow Jones Industrial Average celebrated a milestone, reaching a record high of 42,063. Its 1.6% weekly climb outpaced its counterparts, bringing its year-to-date gains to 11.6%.
Small caps, represented by the Russell 2000, demonstrated resilience with a notable 2.2% weekly gain, despite Friday’s 1.1% pullback.
Key takeaways:
- The Fed’s proactive 0.5% rate cut signals a pivotal shift in monetary policy.
- The start of a rate-cutting cycle outside of a recession historically bodes well for equity returns.
- More cuts coming: 0.5% this year, 4 in 2025, 2 in 2026. Fed officials project a total of 2.1% in rate cuts by 2026.
- All major indices are posting double-digit gains for the year.
- Sector rotation is becoming evident, with a mix of defensive and cyclical sectors leading the charge.
- Key events for this week: Consumer Confidence Report and revised Q2 GDP.
- Trade ideas: BDC and VCYT
As we enter the final quarter of 2024, all eyes are on inflation, employment data, and the US election.
Background: Fed Rate Cut Sparks Market Rally
Last week, the Federal Reserve implemented its first interest rate cut in four years.
The Fed opted for a larger-than-typical 0.5% reduction, bringing the policy target range down to 4.75%-5.0% from 5.25%-5.5%.
The rationale behind this bold move is multifaceted:
- Inflation Cooling: The consumer price index (CPI) has fallen from its peak of 9.1% in June 2022 to 2.5% in August, approaching the Fed’s 2% target.
- Labor Market Considerations: The unemployment rate has risen from 3.4% to 4.2%. The policymakers are trying to balance both price stability and maximum employment.
- Proactive Approach: The Fed aims to avoid falling behind the curve by keeping policy overly restrictive for too long.
The market’s reaction to this news was overwhelmingly positive. Stocks set new record highs.
Looking ahead, Fed officials project an additional 0.5% of easing this year, likely through two quarter-point cuts in November and December. This path is expected to continue with four additional cuts in 2025 and two in 2026, ultimately bringing the fed funds rate down to 2.9%, which is considered the neutral point.
As we move into the final quarter of 2024, this shift in monetary policy sets the stage for potentially lower borrowing costs for consumers and businesses.
The focus is to reaccelerate growth later in 2025 after a potential soft patch in the quarters ahead.
Market Analysis
The past week saw robust performances from both the S&P 500 and Nasdaq, as investors responded positively to the Federal Reserve’s rate cut decision.
S&P 500’s Record-Breaking Run

SPX is at an all time high
The S&P 500 continued its impressive streak, closing the week at 5,703. This represents a solid 1.4% weekly gain, pushing the benchmark index’s year-to-date return to a remarkable 19.6%.
Performance Metrics:
- Weekly Performance: 1.36%
- Year-to-Date Performance: +19.6%
Technical Indicators:
- The S&P 500 made an all-time high as of this week.
- It sits above major moving averages.
Volume:
- Volume is around the average. Summer has just ended, so we might see volume return to the market soon.
Market Breadth:
- Percentage of companies above 200 SMA: 59%.
- This means the majority of Fortune 500 companies are joining in the rally, not just the mega-cap companies.
This rally is fueled by the cut in the interest rate. So, do all cuts in interest always yield good results? Not quite.
The stock market’s response to interest rate cuts is closely tied to the overall economic condition. Historically, rate cuts during periods of economic stability have led to strong equity returns in the following months, as seen in 1984, 1989, 1995, and 1998; however, when cuts occur in response to economic weakness or recession, such as in 1981, 2001, and 2007, they have typically been associated with market losses.
— Source: Edward Jones.
Our current economy is in a stable condition (also, depending on who you ask). By the definition from above, the rally should continue.

Source: FactSet, Edward Jones.
Comparison with Other Major Indices
Nasdaq’s Tech-Driven Momentum

Nasdaq broke the triangle pattern
The tech-heavy Nasdaq Composite also posted impressive gains, despite a slight dip on Friday. The index closed at 17,948, recording a weekly increase of 1.5%.
Performance Metrics:
- Weekly Performance: +1.5%
- Year-to-Date Performance: +19.6%
Technical Indicators:
- Nasdaq broke out from a triangle pattern.
- It is not sitting at an all-time high, but the break to the upside is good news.
- Nasdaq normally yields a better yearly return than the broader market.
- Let’s see if it can play catch up.
Dow Jones Industrial Average
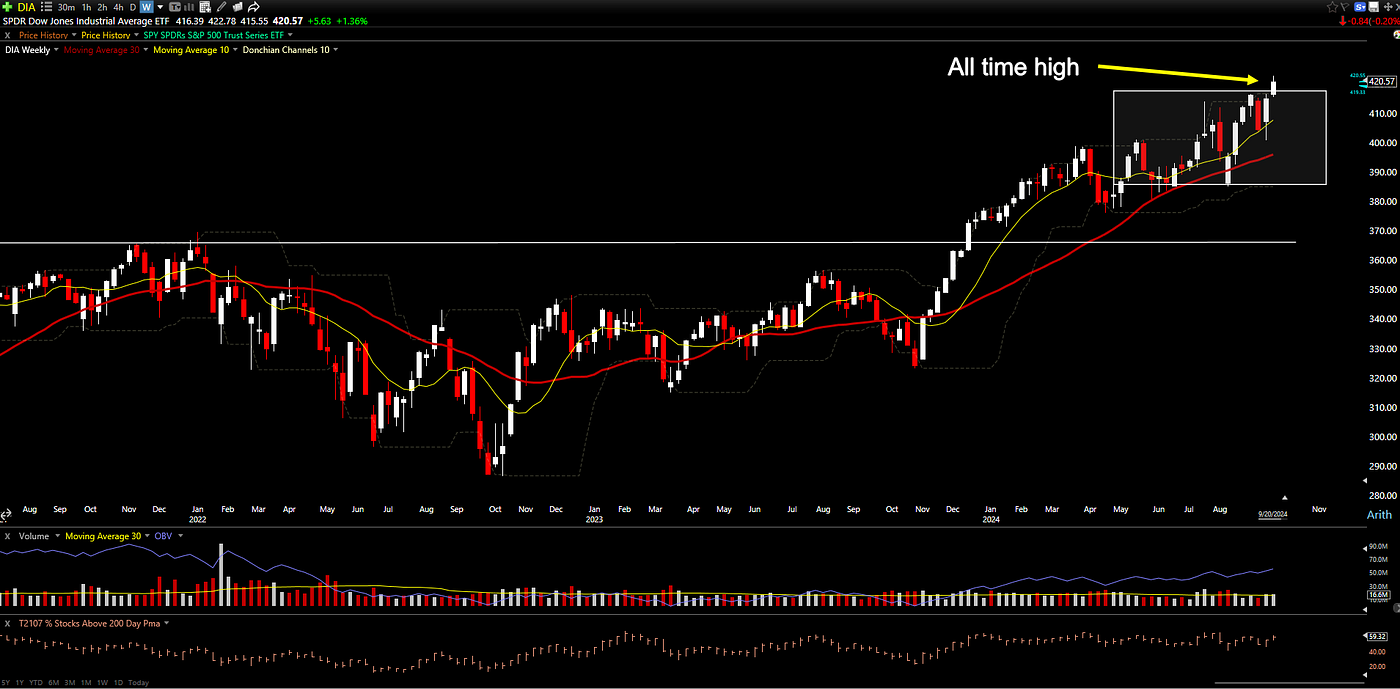
Dow Jones Industrial Average is at an all time high
Performance Metrics:
- Weekly Performance: 1.62%
- Year-to-Date Performance: 11.60%
Technical Indicators:
- Dow Jones also made an all-time high.
- It broke through the consolidation.
- On-balance volume is steady and confirms the upward movement.
Russel 2000
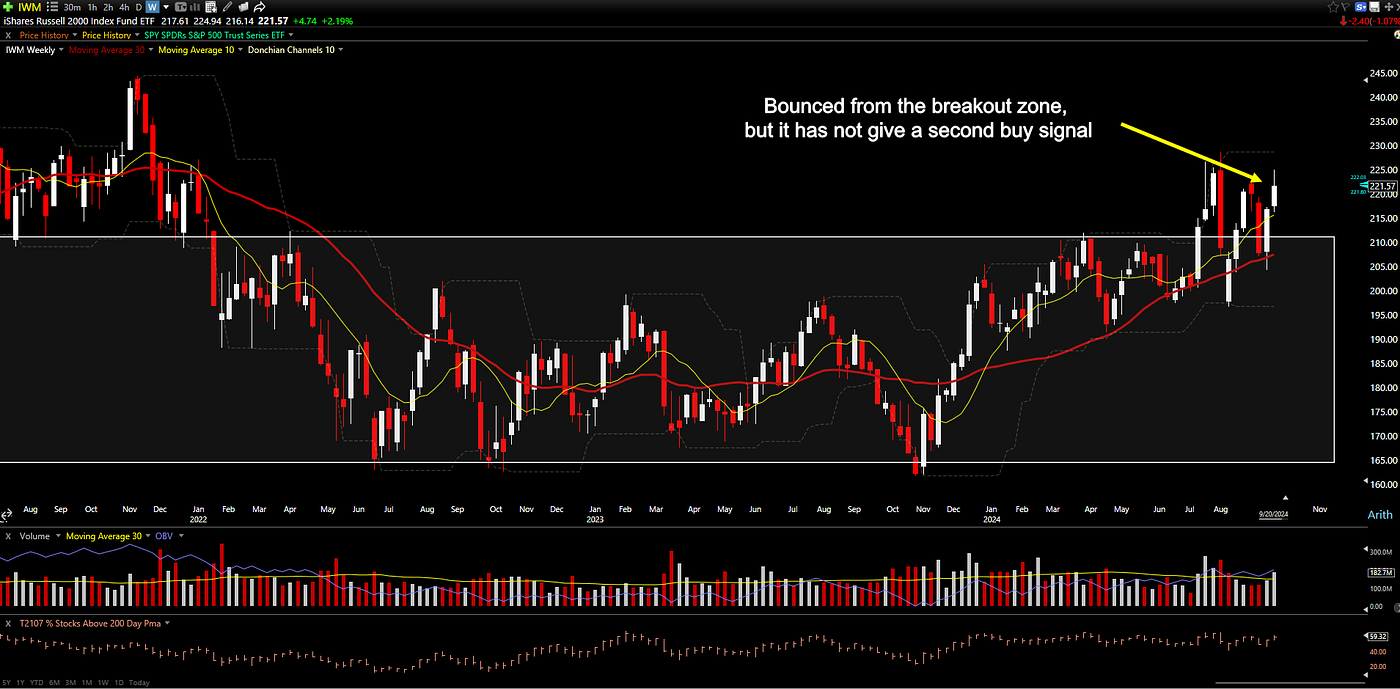
Russell 2000 is still range-bound
Performance Metrics:
- Weekly Performance: +2.2%
- YTD Performance: 9.91%
Technical Indicators:
- Stock is above all major moving averages.
- However, it is still range-bound.
Factors Influencing Small Cap Stocks
Several factors contributed to the Russell 2000’s performance last week:
- Fed Rate Cut Impact: Lower interest rates typically benefit smaller companies more than their larger counterparts, as they often rely more heavily on borrowing for growth.
- Economic Outlook: The Fed’s optimistic view of the U.S. economy, describing it as “in a good place,” may have boosted confidence in small-cap stocks, which are often more tied to domestic economic conditions.
- Sector Rotation: As noted in the broader market analysis, there’s been a shift towards a mix of defensive and cyclical sectors. This rotation could be benefiting certain small-cap stocks in these sectors.
Market Sector Rotation: Weekly and YTD Return
Performance sorted by YTD return.
Outperforming Sectors
- Financial Services: 2.06% | YTD: 22.39%
- Utilities: 2.92% | YTD: 22.38%
- Communication Services: 2.66% | YTD: 20.83%
- Consumer Staple: -0.78% | YTD: 16.23%
- Healthcare: -0.62% | YTD: 16.09%
- Industrial: 2.29% | YTD: 16.09%
Underperforming Sectors
- Technology: 1.38% | YTD: 14.87%
- Basic Material: 1.36% | YTD: 11.10%
- Energy: 3.32% | YTD: 10.51%
- Real Estate: -1.04% | YTD: 10.54%
- Consumer Discretionary: 2.27% | YTD: 10%
Implications for Investors
This sector rotation presents both challenges and opportunities for investors:
- Discretionary Catch-Up: As long as a recession is avoided, which is the current expectation, discretionary and lower-valuation stocks may start to close the gap with mega-cap.
- Dividend Stocks: Lower Fed policy rates and bond yields could make high-quality dividend-paying stocks, like those in the S&P 500 Dividend Aristocrats, more attractive to investors.
- Small & Mid-Cap Potential: Small and Mid-cap stocks, offering a balance among quality, valuations, and cyclical upside, may present catch-up potential in case of an economic reacceleration next year.
Key Market Events for this Week
- Consumer Confidence Report — Date: Tuesday — 24Sep2024 — Importance: Gauge of consumer sentiment and potential spending
- Revised Q2 GDP — Date: Thursday — 26Sep2024 — Importance: Final revision of economic growth for Q2 2024
- Weekly Jobless Claims — Date: Thursday- 26Sep2024 — Importance: Ongoing measure of labor market health
- Federal Reserve Speeches: — Various Fed officials may give speeches throughout the week, providing further insights into monetary policy
Trade Ideas: BDC and VCYT
Belden (BDC) — Buy

BDC broke through 9 years resistance
Who are they?
- Belden Inc. (BDC) is a global leader in the design, manufacture, and distribution of networking, connectivity, and signal transmission solutions that support critical operations across various industries, including industrial automation, smart buildings, and broadband communications.
Technical Analysis:
- The stock just broke out from a 9-year resistance.
- The buy signal came from a retracement bounce after a breakout with volume.
- The relative strength is above sector and the market. Please see below for the zoomed-in picture.
- Lastly, BDC is above both short and long-term moving averages.

BDC bounced from 10-week moving average and making an all time high
Trade Outline: This is what’s working for me. Please do your own risk management.
- Entry: $112.43 (or current price)
- Initial stop (depending on how aggressive you are, here are some suggestions): — The low of the breakout week: $103.00 — Below the support level at: $93.27 — 30% from the current price: $78.70
- For the trade layout, I will use my normal trading trailing stop rule to determine the position size, which is 30% from the current price: — Risk 2% of the portfolio (based on a $100,000 account): $2,000 — Stop loss: $78.70 — Risk per share: $112.43 — $78.70 = $33.73 — Number of shares allowed for this trade: $2,000 / $33.73 = 59 shares — Total cost for the trade: $112.43 * 59 = $6,633.37
Veracyte (VCYT) — Buy

VCYT breaking through Stage 1
Who are they:
- Veracyte is a global diagnostics company that develops and commercializes genomic tests using advanced technologies to improve patient care, primarily in oncology and other diseases.
Technical Analysis:
- Broke through a resistance established in 2019.
- The stock went through all 4 stages of Stan Weinstein’s stage analysis.
- We have finally broken out and potentially will go on to stage 2 from here.
Please use the trade outline from above to calculate your position size.
Conclusion: Stock Market Outlook for Q4 2024
As we close the books on another pivotal week in the financial markets, the landscape has shifted dramatically following the Federal Reserve’s unexpected 0.5% rate cut. This decision has set the stage for what promises to be an intriguing final quarter of 2024.
Key Factors Shaping the Market
Several factors are likely to influence market dynamics in the coming weeks:
- Fed Policy: The central bank’s projection of additional rate cuts through 2026 sets a supportive backdrop for equities.
- Economic Data: Upcoming releases, particularly the PCE inflation data, will be crucial in shaping expectations for future Fed actions.
- Sector Rotation: The shift towards a mix of defensive and cyclical sectors could broaden market participation beyond mega-cap tech stocks.
Thank you for joining me this week. Best wishes for everything that you do. Have an enjoyable week, ladies and gents.
If you like what is presented here, please consider joining my substack: datnguyenwrite.substack.com
메타데이터
- post_id
- 038cf6e71f9e
- slug
- fed-rate-cut-sparks-stock-market-rally-s-p-500-nasdaq-soar-in-3rd-week-of-september-2024-038cf6e71f9e
- url
- https://medium.com/@datng8/fed-rate-cut-sparks-stock-market-rally-s-p-500-nasdaq-soar-in-3rd-week-of-september-2024-038cf6e71f9e
- canonical_url
- https://medium.com/@datng8/fed-rate-cut-sparks-stock-market-rally-s-p-500-nasdaq-soar-in-3rd-week-of-september-2024-038cf6e71f9e
- author_url
- https://medium.com/@datng8
- status
- ok
- fetched_at
- 2026-07-22 18:24:31




