It Depends What Kind of Cancer You Have
The NHS has one 62-day cancer standard. But across eighteen months of data, the chance of timely treatment ranged from 84% for skin cancer…
It Depends What Kind of Cancer You Have
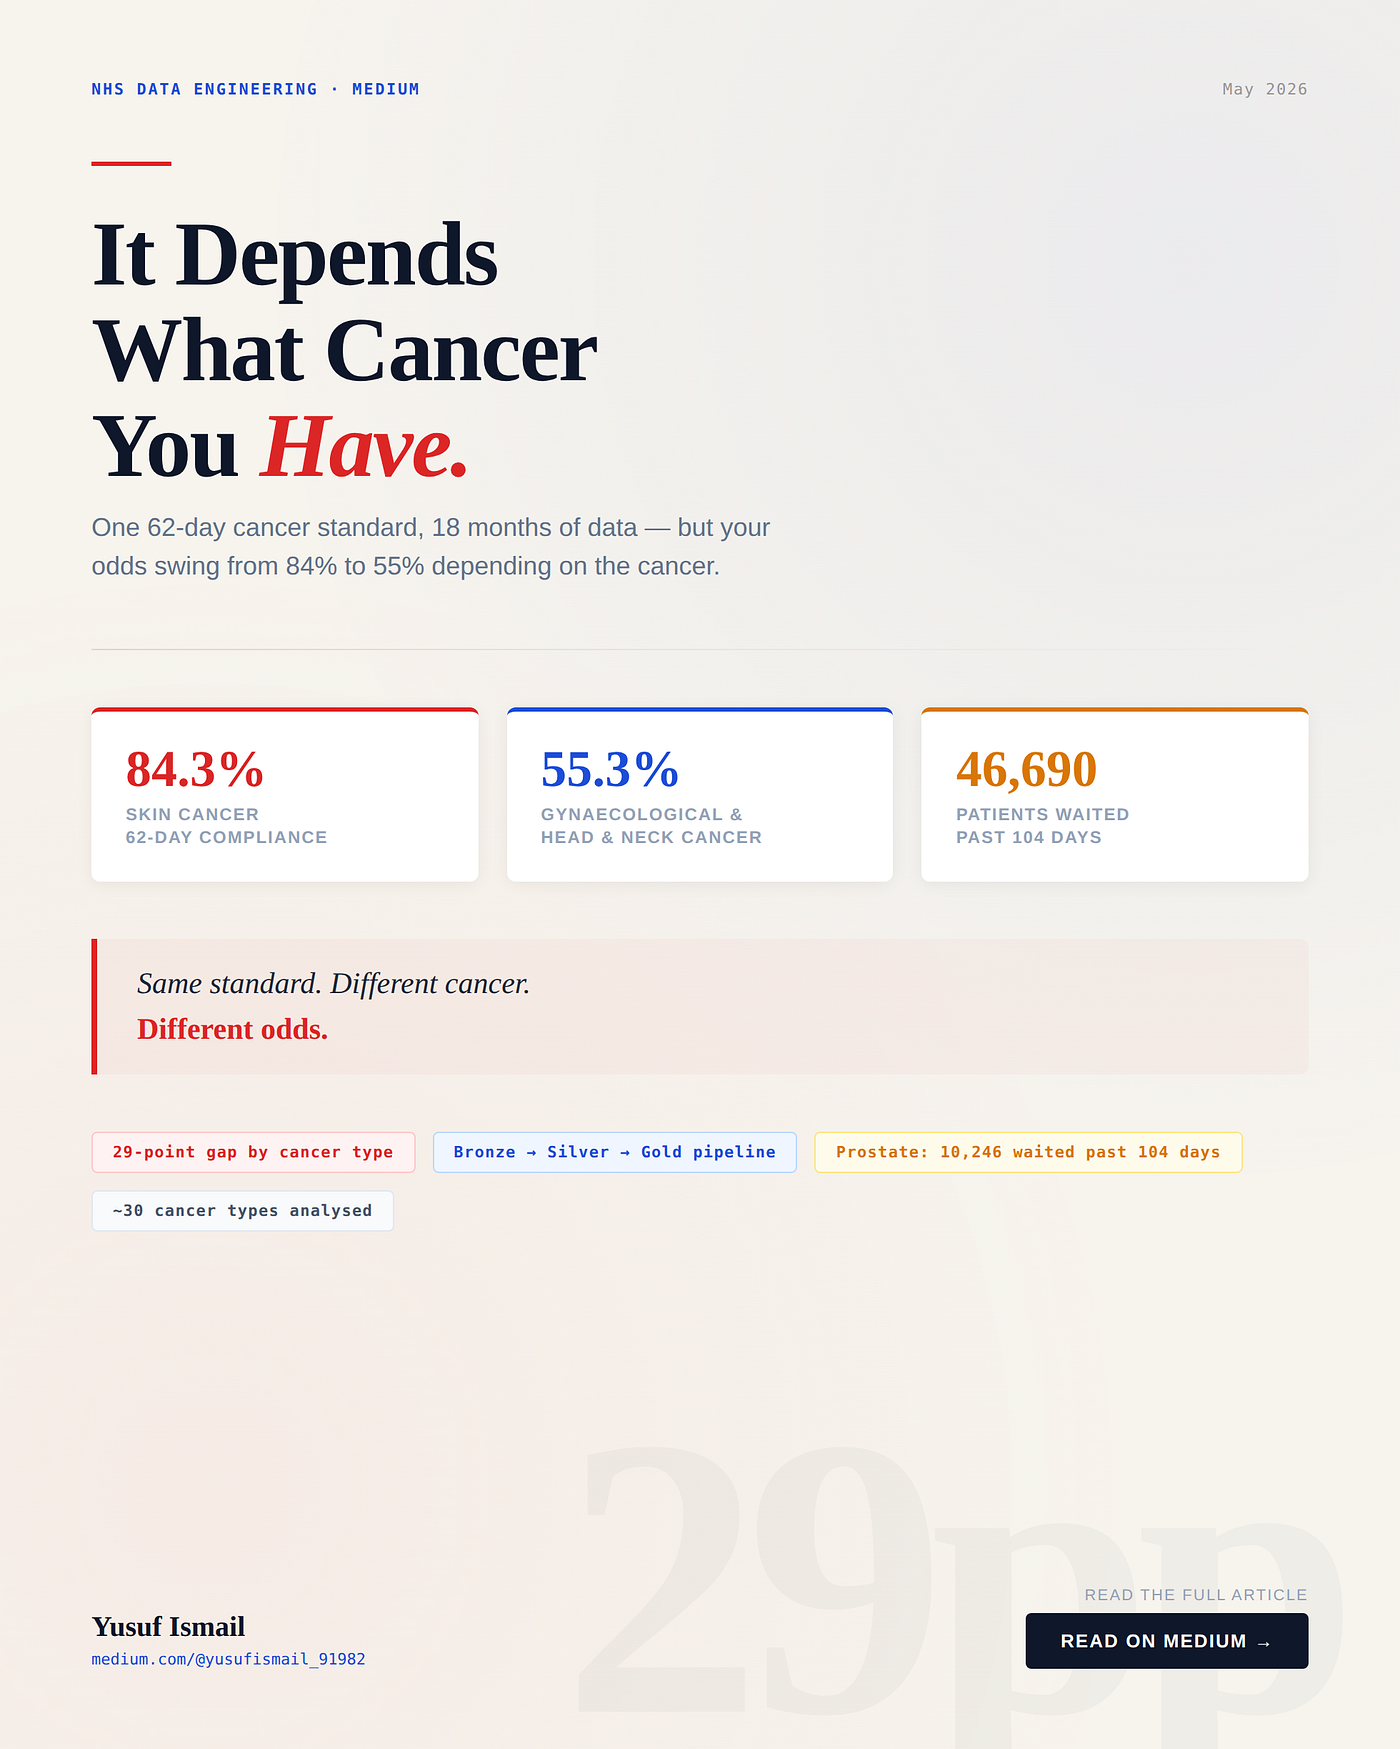
The NHS has one 62-day cancer standard. But across eighteen months of data, the chance of timely treatment ranged from 84% for skin cancer to 55% for gynaecological and head & neck cancers.
In my last piece, I wrote about getting lost in a hospital corridor in Telford and ending up thinking about cancer waiting times. I found that your chance of timely treatment depends, in part, on which hospital trust your referral lands in. A 48-point gap between the best and worst trusts.
But there was an assumption buried in that whole story that I never actually checked.
When I first had the thought, standing in that corridor, my instinct was that it must depend mostly on the type of cancer. Some cancers are aggressive. Some are caught early. Some need treatment within days. Surely that was the real divide, and the hospital stuff was secondary.
So I went back to the data and tested my own assumption.
It turns out I was half right. It does depend on the type of cancer. The gap is real, and it is wide. But the shape of it was not what I expected.
The same standard, very different odds
A quick reminder of what is being measured. When your GP sends you through the urgent suspected cancer pathway, a clock starts. From that referral to the start of your first treatment, the NHS says no more than 62 days should pass. The target is that 85% of patients are treated inside that window.
That is one standard. It does not change depending on what kind of cancer you have. The 62 days is the same whether it is skin cancer or lung cancer.
But the chance of actually being treated inside those 62 days is not the same at all.
I ranked every cancer type by its 62-day compliance, nationally, across 18 months of data from October 2023 to March 2025.
Skin cancer sat near the top, at 84.3%. Close to the target.
Gynaecological and head and neck cancers sat at the bottom, both at 55.3%.
That is a 29 percentage point gap between two cancers that anyone can picture. In this dataset, skin cancer came close to the target. Gynaecological and head and neck cancers were much closer to a coin flip.

62-day compliance by cancer type
There is another way to read that chart. Skin cancer is the only recognisable cancer type sitting close to the 85% line. Most of the others are not slightly below target. They are nowhere near it. This is not one outlier cancer dragging the average down. The gap is spread across multiple major pathways.
Why the gap exists (and why it is not a simple scandal)
Here is where I have to be careful, because the easy version of this story is wrong.
The easy version says the NHS simply treats some cancers better than others. That is tempting, but too blunt. It is not quite what the data shows, and pretending it is would be dishonest.
The cancers at the bottom of my ranking have something in common. Gynaecological, head and neck, lower gastrointestinal, lung. These are cancers with complex pathways. They often need multiple scans, a biopsy, a multidisciplinary team review, and major surgery before treatment can even begin. Every one of those steps takes time, and every one is a place where the clock keeps running.
The cancer at the top, skin, tends to be different. Many skin cancers are diagnosed and treated in far fewer steps. Sometimes the treatment is a single procedure to remove the lesion. Fewer steps, less time, more chance of beating the clock.
So some of this gap is not failure. It is medicine. A cancer that needs four stages of work before treatment will always be harder to turn around in 62 days than one that needs one.
That does not make the gap acceptable. The 62-day standard was written knowing that different cancers have different pathways. It is supposed to be hit anyway. But it does mean the honest reading is not “the NHS cares less about gynaecological cancer.” The honest reading is that the cancers with the most complex pathways are the ones the system is least able to treat on time, and the system has not solved for that.
That is a harder thing to say than a scandal. It is also the true thing.
Not just late. Catastrophically late.
The compliance rate tells you how often the system misses the standard. It does not tell you how badly it misses it for the people it fails.
So I looked at a harder number. How many patients waited more than 104 days to start treatment? The standard is 62 days. Waiting more than 104 means waiting more than six extra weeks beyond that line.
Across all cancers, over the 18 months, that number was 46,690 people.
And when I broke it down by cancer type, a second pattern appeared, one the compliance rate alone completely hides.
I ranked this by number of patients, not by percentage, because I wanted to show where the human burden actually sits.
Prostate cancer had the most patients waiting past 104 days, 10,246 of them. Lower gastrointestinal and lung were close behind, with around 6,800 each.
There was also a striking figure in the percentages. The highest share sat in a residual category labelled Urological-Other, where 18.1% waited more than 104 days. I would not build the whole story around a residual category, but I would not ignore it either. It suggests that some smaller or less easily categorised urological pathways may be carrying severe delays of their own.
Compare any of that to skin cancer, where only 3.8% waited longer than 104 days.

Patients waiting past 104 days
This is the part that stayed with me. It is one thing to miss a target by a few days. It is another to have a meaningful share of patients with a particular cancer waiting more than six extra weeks beyond the limit, when the limit itself is already two months.
The compliance rate and the catastrophic delay are measuring two different failures. One tells you how often the system is late. The other tells you how badly it fails the people it does fail. A cancer can score middling on one and terrible on the other.
What the data cannot tell me
The same caution applies here as in my last piece, and it matters even more for this one.
The data does not tell me why each cancer runs late. It does not show me the number of specialist surgeons for each tumour type, the availability of specific scanners, how complex each individual patient’s case was, or how many people needed treatment across more than one site.
It does not tell me whether a particular delay was clinically reasonable. Some waits are longer because the right thing to do, medically, took longer. The data cannot separate those from the avoidable ones.
So this is not a claim that the NHS values one cancer over another. It is not a claim that the teams treating gynaecological cancer are working less hard than the teams treating skin cancer. That would be unfair, and almost certainly untrue.
What the data does show is simpler. The same national standard produces very different outcomes depending on which cancer you have, and for some cancers, a meaningful share of patients are not just late but waiting more than twice the limit.
That is the part we should not explain away with pathway complexity alone.
What I am left with
I went into this assuming the type of cancer was the real story, and the hospital was a detail.
I was half right. The type of cancer matters a great deal. A 29-point gap between skin and gynaecological cancer is not a rounding error, and 46,690 people waiting more than six extra weeks is not a statistical quirk.
But here is what I keep coming back to. In my last piece, the same cancer could mean very different odds depending on the hospital. In this piece, the same hospital would mean very different odds depending on the cancer.
So it is not one thing or the other. It is both. Where you are treated, and what you are treated for, both move your chances.
But there is one more assumption left. I have looked at where you are treated. I have looked at what you are treated for. Next, I want to look at how you enter the system in the first place.
Because not everyone is referred the same way. Some come through the urgent route their GP sends them down. Some are picked up by a consultant already in the hospital. Some come through screening. I had assumed the route in did not matter much. The cancer is the cancer, however you arrive at it.
That is the next assumption I am going to check.
This analysis covers NHS England Cancer Waiting Times monthly statistics from October 2023 to March 2025, eighteen months of provider-level data, filtered to the post-October 2023 standards framework for clean comparability. Cancer types are compared on the all-routes, all-modalities national view. Two categories labelled “Other” are residual groupings and I have kept them out of my headline comparisons. The full pipeline was built in Python and Parquet using a Bronze, Silver, Gold structure.
GitHub: github.com/YusufIsmailayo
This is the second piece in my NHS cancer waiting times series. The first looked at the hospital lottery. The third will ask whether the way you are referred changes your wait.
메타데이터
- post_id
- 03a2c8b97fd5
- slug
- it-dependswhat-kind-of-cancer-you-have-03a2c8b97fd5
- url
- https://medium.com/@yusufismail_91982/it-dependswhat-kind-of-cancer-you-have-03a2c8b97fd5
- canonical_url
- https://medium.com/@yusufismail_91982/it-dependswhat-kind-of-cancer-you-have-03a2c8b97fd5
- author_url
- https://medium.com/@yusufismail_91982
- status
- ok
- fetched_at
- 2026-06-09 15:37:30