Building a Detection Layer on PostgreSQL with Sigma Rules
How RSigma turns 3,800+ community detection rules into SQL queries for TimescaleDB
Building a Detection Layer on PostgreSQL with Sigma Rules
How RSigma turns 3,800+ community detection rules into SQL queries for TimescaleDB
This is the third article in a series on RSigma. The first article introduced RSigma as a CLI tool for evaluating Sigma rules against JSON logs. The second article covered running it as a streaming daemon for real-time detection.
This one is about something different: what if you already have the data in PostgreSQL?
The problem you already have
Let me describe a situation that might sound familiar.
You are collecting Okta audit logs into a PostgreSQL database. Maybe it started as a compliance requirement, maybe you needed the data for incident response, or maybe you just wanted a paper trail. Either way, the events are there, sitting in a hypertable, growing every day.
Then a threat report drops. In August 2023, Okta disclosed a series of cross-tenant impersonation attacks. The attack chain was elegant and terrifying: social engineering of help desk staff, followed by MFA reset, then admin role escalation, then creation of a rogue identity provider. Four steps, executed in sequence, all visible in the Okta System Log. Note that I used the same scenario in the second article as a real-world example.
You need to check: did this happen to us?
So you open psql and start writing SQL by hand. One query for “MFA deactivated”. Another for “admin role granted”. Another for “new identity provider created”. You chain them together with CTEs, add a time window, group by actor. It works. But it took you an hour or so (unless you used your AI agent), and you have only covered one attack chain out of thousands.
Meanwhile, the SigmaHQ community maintains over 3,800 detection rules covering exactly these patterns. The rules are peer-reviewed, continuously updated, and portable. Within days of the Okta disclosure, SigmaHQ had rules for all four steps of the attack. But those rules are designed for backends supported by sigma-cli like Splunk, Loki and Elastic, not PostgreSQL.
What if you could take those rules and run them as native SQL against the data you already have?
rsigma convert rules/ -t postgres -O table=okta_events -O json_field=dataOut comes SQL you can paste into psql, save as a view, or schedule with pg_cron. Same rules the SIEM uses. No SIEM required.
Why PostgreSQL
You might be wondering: does PostgreSQL actually have what it takes for security detection?
You are not the first to ask that question. Databricks answered it with Lakewatch, which showed that “database + detection-as-code” is a viable SIEM architecture. Turbot answered it with Steampipe, which proved that security teams are comfortable writing SQL and that PostgreSQL is a natural interface for security operations. And then Tailpipe validated that “SQL for security logs” is what teams actually want.
But nobody took the 3,800+ Sigma rules and ran them as native PostgreSQL SQL. Zircolite converts Sigma rules to SQLite, but it is focused on forensics. Matano builds a security data lake on AWS, but it is cloud-based. ClickDetect runs SQL detection on ClickHouse, but requires a separate columnar engine. Logwell stores logs in PostgreSQL with full-text search, but has no detection layer.
RSigma’s PostgreSQL backend fills the gap. And it works because PostgreSQL has native features that map cleanly to what Sigma rules need:
ILIKEfor case-insensitive string matching (Sigma'scontains,startswith,endswith)~*and~for case-insensitive and case-sensitive regexinetandcidrtypes for IP address matchingtsvectorandtsqueryfor full-text search (Sigma keywords)- JSONB operators for querying semi-structured data
Add TimescaleDB on top and you get hypertables with automatic partitioning, compression (often 90%+ reduction), retention policies, continuous aggregates, and time_bucket() for time-series queries. Standard tooling works out of the box: psql, Grafana, pg_cron. No new query language. All OSS with no lock-in. Just SQL.
Getting the data in
Before we can detect anything, we need events in the database. I use Helr for this. Helr polls the Okta System Log API on a schedule, handles pagination and rate limits, and writes NDJSON to stdout. One YAML file, one binary, done.
sources:
  okta-audit:
    url: https://${OKTA_DOMAIN}/api/v1/logs
    auth:
      type: bearer
      token_env: OKTA_API_TOKEN
      prefix: SSWS
    pagination:
      type: link_header
    transform:
      timestamp_field: published
One detail that trips people up: Helr wraps each raw Okta event inside a thin envelope with ts, source, and event fields. Before inserting into PostgreSQL, you need to extract the inner event. For quick testing, a jq one-liner works:
helr run config.yml | jq -c '.event' | \
  psql -c "COPY okta_events(time, data) FROM STDIN WITH (FORMAT csv)"
For production, Fluent Bit has a native PostgreSQL output plugin that stores records as JSONB. Vector can do the same with a remap transform. However you get the JSON into the database, the next step is the same.
Now that we have Okta events landing in PostgreSQL every few seconds, the question becomes: how do we store them?
Storing and querying events
There are two ways to do this, and the right one depends on where you are in the journey.
The 5-minute path: pure JSONB
Here is the fastest way I know to go from zero to detection. Three lines of SQL ([schema/jsonb.sql](https://github.com/mostafa/detection-layer-on-postgres-article/blob/main/schema/jsonb.sql)):
CREATE TABLE okta_events (
    time  TIMESTAMPTZ NOT NULL,
    data  JSONB NOT NULL
);
SELECT create_hypertable('okta_events', by_range('time'));
CREATE INDEX ON okta_events USING GIN (data jsonb_path_ops);
One table, one JSONB column, zero schema design. When a new field appears in the Okta API response, it is automatically stored. No migrations.
Now point RSigma at it:
rsigma convert rules/ -t postgres \
  -O table=okta_events \
  -O json_field=data \
  -O timestamp_field=time
For the SigmaHQ rule Okta User Session Start via Anonymizing Proxy, which detects sessions routed through anonymizing proxies, RSigma generates:
SELECT * FROM okta_events
WHERE data->>'eventType' = 'user.session.start'
  AND data->'securityContext'->>'isProxy' = 'true'
Take a moment to look at what just happened. A YAML rule turned into SQL that queries a JSONB column. The flat field eventType becomes data->>'eventType'. The nested field securityContext.isProxy becomes data->'securityContext'->>'isProxy', with chained -> and ->> operators for nested path traversal.
No processing pipeline needed. The SigmaHQ Okta rules already use Okta’s native field names, and the JSONB backend handles the rest.
When you are ready to optimize: hybrid table
The JSONB approach works great to start. But after a few weeks of running, you might notice that queries filtering on eventType scan more data than you would like. That is because GIN indexes are great for containment checks, but B-tree indexes are faster for equality filters on high-cardinality columns.
The solution is to pull the most frequently filtered fields into proper columns while keeping the full event in JSONB ([schema/hybrid.sql](https://github.com/mostafa/detection-layer-on-postgres-article/blob/main/schema/hybrid.sql)):
CREATE TABLE okta_events (
    time          TIMESTAMPTZ NOT NULL,
    event_type    TEXT,
    actor_id      TEXT,
    actor_email   TEXT,
    client_ip     INET,
    outcome       TEXT,
    data          JSONB NOT NULL
);
SELECT create_hypertable('okta_events', by_range('time'));
CREATE INDEX ON okta_events (event_type, time DESC);
CREATE INDEX ON okta_events (actor_email, time DESC);
CREATE INDEX ON okta_events (client_ip, time DESC);
CREATE INDEX ON okta_events USING GIN (data jsonb_path_ops);
Now eventType queries hit a B-tree index, client_ip gets native inet matching, and the full event is still in data for anything the columns do not cover.
Sigma rules reference Okta’s native field names (eventType, actor.alternateId), but the database columns use different names (event_type, actor_email). A small processing pipeline bridges the gap:
name: Okta to PostgreSQL columns
priority: 10
transformations:
  - type: field_name_mapping
    mapping:
      eventType: event_type
      actor.alternateId: actor_email
      client.ipAddress: client_ip
      outcome.result: outcome
    rule_conditions:
      - type: logsource
        product: okta
rsigma convert rules/ -t postgres \
-O table=okta_events \
-O timestamp_field=time \
-p okta_postgres.ymlThe same proxy session rule now generates:
SELECT * FROM okta_events
WHERE event_type = 'user.session.start'
  AND "securityContext.isProxy" = 'true'
Notice that eventType was remapped to event_type (a proper column with a B-tree index), while securityContext.isProxy was left as-is since the pipeline only maps the fields we extracted into columns. The full event is still in data for fields we did not promote.
Same Sigma rule, different SQL. The rule did not change; only the backend options and the pipeline did.
For teams that want a broader, multi-source schema, RSigma ships a reference TimescaleDB schema with OCSF-aligned columns, compression policies, retention, and an example continuous aggregate. For a full list of backend options, see the [rsigma-convert README](https://github.com/timescale/rsigma/blob/main/crates/rsigma-convert/README.md).
From queries to detection
You just ran rsigma convert and got a SELECT statement. You pasted it into psql. It returned three rows. Congratulations, you just ran your first Sigma detection in SQL.
But do you really want to paste this into psql every time?
No. So let’s go one step further. RSigma supports multiple output formats, and each one is a step up in operational maturity.
Save it as a view
rsigma convert rules/ -t postgres -f view \
  -O table=okta_events -O json_field=data -O timestamp_field=time
This wraps the query in a CREATE OR REPLACE VIEW:
CREATE OR REPLACE VIEW sigma_bde30855_5c53_4c18_ae90_1ff79ebc9578 AS
SELECT * FROM okta_events
WHERE data->>'eventType' = 'user.session.start'
  AND data->'securityContext'->>'isProxy' = 'true'
Now every SELECT * FROM sigma_bde30855_5c53_4c18_ae90_1ff79ebc9578 runs the detection logic against the current table contents. Hook it up to Grafana, and you have a live dashboard.
Add time bucketing
rsigma convert rules/ -t postgres -f timescaledb \
  -O table=okta_events -O json_field=data -O timestamp_field=time
This adds time_bucket() for time-series aggregation:
SELECT time_bucket('1 hour', time) AS bucket, *
FROM okta_events
WHERE data->>'eventType' = 'user.session.start'
  AND data->'securityContext'->>'isProxy' = 'true'
“How many proxy sessions per hour this week?” becomes a single query.
Let the database compute it in the background
rsigma convert rules/ -t postgres -f continuous_aggregate \
  -O table=okta_events -O json_field=data -O timestamp_field=time
CREATE MATERIALIZED VIEW sigma_bde30855_5c53_4c18_ae90_1ff79ebc9578
WITH (timescaledb.continuous) AS
SELECT time_bucket('1 hour', time) AS bucket, *
FROM okta_events
WHERE data->>'eventType' = 'user.session.start'
AND data->'securityContext'->>'isProxy' = 'true'
WITH NO DATATimescaleDB refreshes this view in the background on a schedule. One caveat: use materialized-only mode for this. The “real-time aggregates” mode (materialized_only = false) can have significant performance overhead. Continuous aggregates are best for dashboards and trend analysis. For sub-minute detection, views and pg_cron are the better tools.
The payoff: correlation
Remember the Okta cross-tenant impersonation attack from the opening? Four rules, firing in sequence, from the same actor, within 30 minutes. Let me show you what RSigma generates for that.
For a simple event count correlation (“flag actors with 10+ matching events in 5 minutes”), RSigma wraps the detection rule’s query in a CTE and aggregates:
WITH combined_events AS (
    SELECT * FROM okta_events
    WHERE data->>'eventType' = 'user.session.start'
      AND data->'securityContext'->>'isProxy' = 'true'
)
SELECT data->>'actor', COUNT(*) AS event_count
FROM combined_events
GROUP BY data->>'actor'
HAVING COUNT(*) >= 10
When you convert a detection rule and a correlation rule together, RSigma automatically wires the detection query into the CTE. In JSONB mode, the group-by: actor field becomes data->>'actor' just like any other field reference.
For the full attack chain (temporal correlation with four rules), it generates a CTE that checks all four rules fired from the same actor within the time window:
WITH matched AS (
    SELECT *, rule_name FROM okta_events
    WHERE rule_name IN (
        'okta_mfa_reset', 'okta_admin_role_grant',
        'okta_idp_created', 'okta_proxy_session'
      )
      AND time >= NOW() - INTERVAL '1800 seconds'
)
SELECT data->>'actor',
    COUNT(DISTINCT rule_name) AS distinct_rules,
    MIN(time) AS first_seen, MAX(time) AS last_seen
FROM matched
GROUP BY data->>'actor'
HAVING COUNT(DISTINCT rule_name) >= 4
And with the sliding window format, RSigma uses SQL window functions to flag every individual event that crosses the threshold, not just the aggregate:
WITH combined_events AS (...),
event_counts AS (
    SELECT *, COUNT(*) OVER (
        PARTITION BY data->>'actor'
        ORDER BY time
        RANGE BETWEEN INTERVAL '300 seconds' PRECEDING AND CURRENT ROW
    ) AS correlation_event_count
    FROM combined_events
)
SELECT * FROM event_counts WHERE correlation_event_count >= 10
That correlation query I spent an hour writing by hand in the opening? RSigma generates it from a few lines of YAML. All the generated SQL for every format is in the [output/](https://github.com/mostafa/detection-layer-on-postgres-article/tree/main/output) directory of the companion repo.
How fresh is the data?
The SQL path works on fresh data. Helr polls Okta on a configurable interval (seconds to minutes), so events land in TimescaleDB shortly after they occur. The detection latency depends on which mechanism you use:
- Views query live data. Zero staleness. Every
SELECTagainst the view runs the detection logic against the current table contents, including events inserted moments ago. - pg_cron supports intervals down to 1 second since v1.5. A query running every 10 to 30 seconds provides near real-time detection.
- Continuous aggregates refresh on a schedule. They are better suited for dashboards and trend analysis than for sub-minute detection.
And the same SQL doubles as a historical hunting tool. When a new threat report drops next month, you can run the same queries against months of stored data to check if the pattern ever occurred before, just like a log storage engine.
Visualization and alerting
You have views in the database. You have pg_cron running detection every 30 seconds. But right now the only way to see results is to open psql. Let me show you how to close the loop.
Grafana ships with a built-in PostgreSQL data source that connects directly to TimescaleDB. Point it at your database, and the sigma_* views RSigma generates are immediately queryable as dashboard panels. Use the $__timeFilter(time) macro to link the Grafana time picker to the SQL WHERE clause.
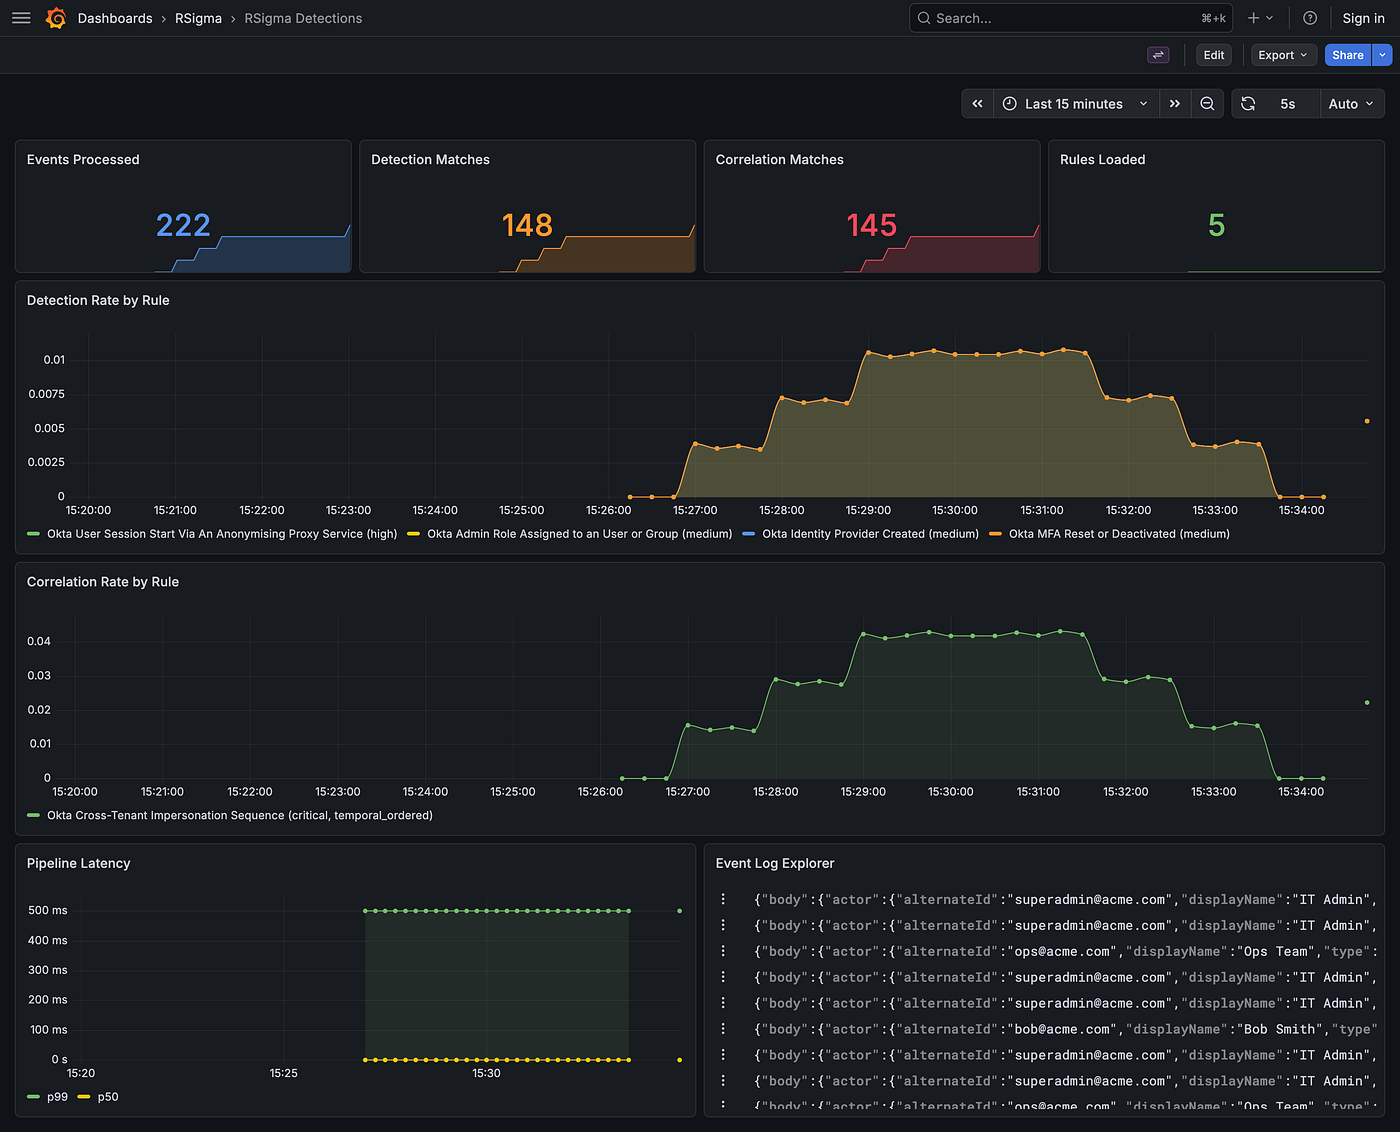
This closes the alerting loop: Sigma rule -> SQL view -> Grafana alert rule -> Slack or PagerDuty. No extra infrastructure beyond PostgreSQL and Grafana.
The full picture
Let me step back and show you what we just built:
End-to-end architecture: Okta logs flow through Helr into TimescaleDB, where RSigma-generated SQL views turn Sigma rules into persistent detections. pg_cron and Grafana close the alerting loop.
Every box in this diagram is something you have seen in the sections above. Okta logs flow through Helr into a TimescaleDB hypertable. RSigma converts Sigma rules into SQL views that live inside the database. pg_cron and Grafana query those views for detection and alerting.
Tradeoffs and what is next
This is not a SIEM replacement for everyone. Here is what you should know before adopting this approach:
- RSigma generates SQL. It does not connect to the database, execute queries, or manage schema migrations. You run the SQL yourself. That is a feature for some teams and a limitation for others.
- PostgreSQL is not Elasticsearch. Full-text search works (
tsvector/tsquery), but it will not match a dedicated search engine for free-text queries across billions of events. - The reference schema is a starting point. Real deployments need tuning: chunk intervals, compression policies, index selection, all depend on your ingest volume and query patterns.
- Continuous aggregates have limitations. No JOINs, no CTEs in the aggregate definition. Complex correlation queries may need to run as
pg_cronscheduled queries rather than continuous aggregates. - This is single-node for now. Multi-node support is on the roadmap.
The Backend trait in RSigma is designed for more backends. Splunk SPL, Elasticsearch Lucene, KQL, Loki and others are all possible by implementing the same trait. The PostgreSQL backend is the first, and it works today. However, I don’t have plans to implement others yet.
RSigma is open source under the MIT license. You can install it with:
cargo install rsigmaOr grab a prebuilt binary from the releases page.
As always, I appreciate your feedback, suggestions, and contributions. If you try this out, I would love to hear how it goes.
메타데이터
- post_id
- 042caeb42b2a
- slug
- building-a-detection-layer-on-postgresql-with-sigma-rules-042caeb42b2a
- url
- https://itnext.io/building-a-detection-layer-on-postgresql-with-sigma-rules-042caeb42b2a
- canonical_url
- https://itnext.io/building-a-detection-layer-on-postgresql-with-sigma-rules-042caeb42b2a
- author_url
- https://medium.com/@mostafamoradian
- status
- ok
- fetched_at
- 2026-06-10 08:17:25