PMP Exam Survival Guide: Understanding Project Management Processes and Rita’s Process Chart
If you’re preparing for the PMP exam, sooner or later you’ll encounter one of the most famous study tools in the PMP world:
PMP Exam Survival Guide: Understanding Project Management Processes and Rita’s Process Chart
If you’re preparing for the PMP exam, sooner or later you’ll encounter one of the most famous study tools in the PMP world:
Rita’s Process Chart.
At first glance, it can feel intimidating — arrows flowing in every direction, processes stacked across multiple stages, and boxes that seem to connect to everything at once.
But something interesting happens once you begin to truly understand it:
The entire PMP framework finally starts making sense.
And honestly, that’s where many PMP candidates struggle the most.
Most people don’t fail because they can’t memorize terms like Risk Management or Scope Management. They struggle because they don’t fully understand how all the processes connect together inside a real project environment.
That’s exactly where Rita’s Process Chart becomes incredibly valuable.
The Biggest Shift in PMP Thinking
One of the most common mistakes PMP beginners make is studying each knowledge area separately.
Today: Risk Management
Tomorrow: Procurement Management
Next week: Stakeholder Management
The problem is that real projects don’t operate in isolated categories.
In actual project environments:
- Risks impact schedules
- Schedules impact costs
- Costs affect stakeholders,
- Stakeholders influence priorities,
- Changes affect almost everything.
Projects are interconnected systems.
And this is one of the biggest mindset shifts required for the PMP exam.
The PMP is not simply testing whether you can memorize definitions. It’s testing whether you understand how project decisions flow across an entire project ecosystem.
Rita’s Process Chart helps bridge that gap.
It trains you to stop thinking like someone studying disconnected concepts and start thinking like a real Project Manager managing an integrated system.
So What Exactly Is Rita’s Process Chart?
Rita’s Process Chart was created by Rita Mulcahy to help PMP candidates better understand how project management processes interact throughout the project lifecycle.
Instead of treating the PMBOK as a collection of separate processes, Rita reorganized the concepts into a more practical sequence that reflects how projects actually function in the real world.
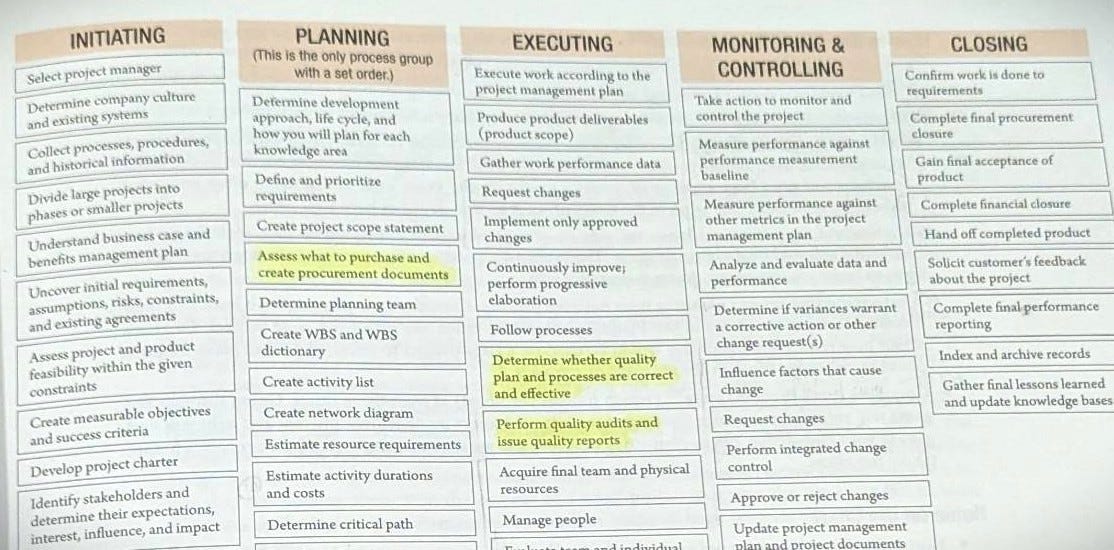
The chart demonstrates:
- How Initiating leads into Planning
- How Planning supports Execution
- How Monitoring & Controlling continuously interacts with every stage of the project.
More importantly, it helps candidates understand not only what each process does, but also:
- When it should happen
- What inputs it depends on
- How its outputs affect other areas of the project
For many PMP students, this becomes the moment when the entire PMP framework finally “clicks.” (It certainly did for me!!!)
Because the real challenge of becoming a PMP isn’t memorization. It’s a complete understanding of:
- What should happen first
- What should happen next
- Why processes occur in a specific sequence
PMP Is Really About Process Thinking
One of the most important things to understand about the PMP exam is that it evaluates how you think as a Project Manager.
For example:
Imagine a stakeholder suddenly requests a major feature change.
A beginner’s reaction might be: “Just update the scope.”
But a PMP mindset approaches the situation very differently.
A trained PM would:
- Evaluate the request
- Analyze the impact
- Review the change control process
- Assess impacts to schedule, cost, resources, and risks
- Obtain approval
- Update project baselines if necessary
The PMP exam constantly tests whether you understand structured decision-making inside complex project environments.
This is why process flow matters so much.
The Five Process Groups (The Foundation of PMP)
Before fully understanding Rita’s Process Chart, it’s important to understand the five PMP process groups that form the foundation of project management.
1️⃣ Initiating
This is where the project officially begins.
Some of the key activities include:
- Developing the Project Charter
- Develop stakeholder register
- Defining the project at a high level
This phase establishes the project’s initial direction and authorization.
2️⃣ Planning
Planning is the foundation of project success.
During this phase, the PM develops a wide range of project plans and supporting documents, including:
- Scope
- Schedule
- Budget
- Risk management plans
- Communication strategies
- Procurement approaches
- Stakeholder engagement plans.
A strong Planning phase creates the structure needed for effective execution later on.
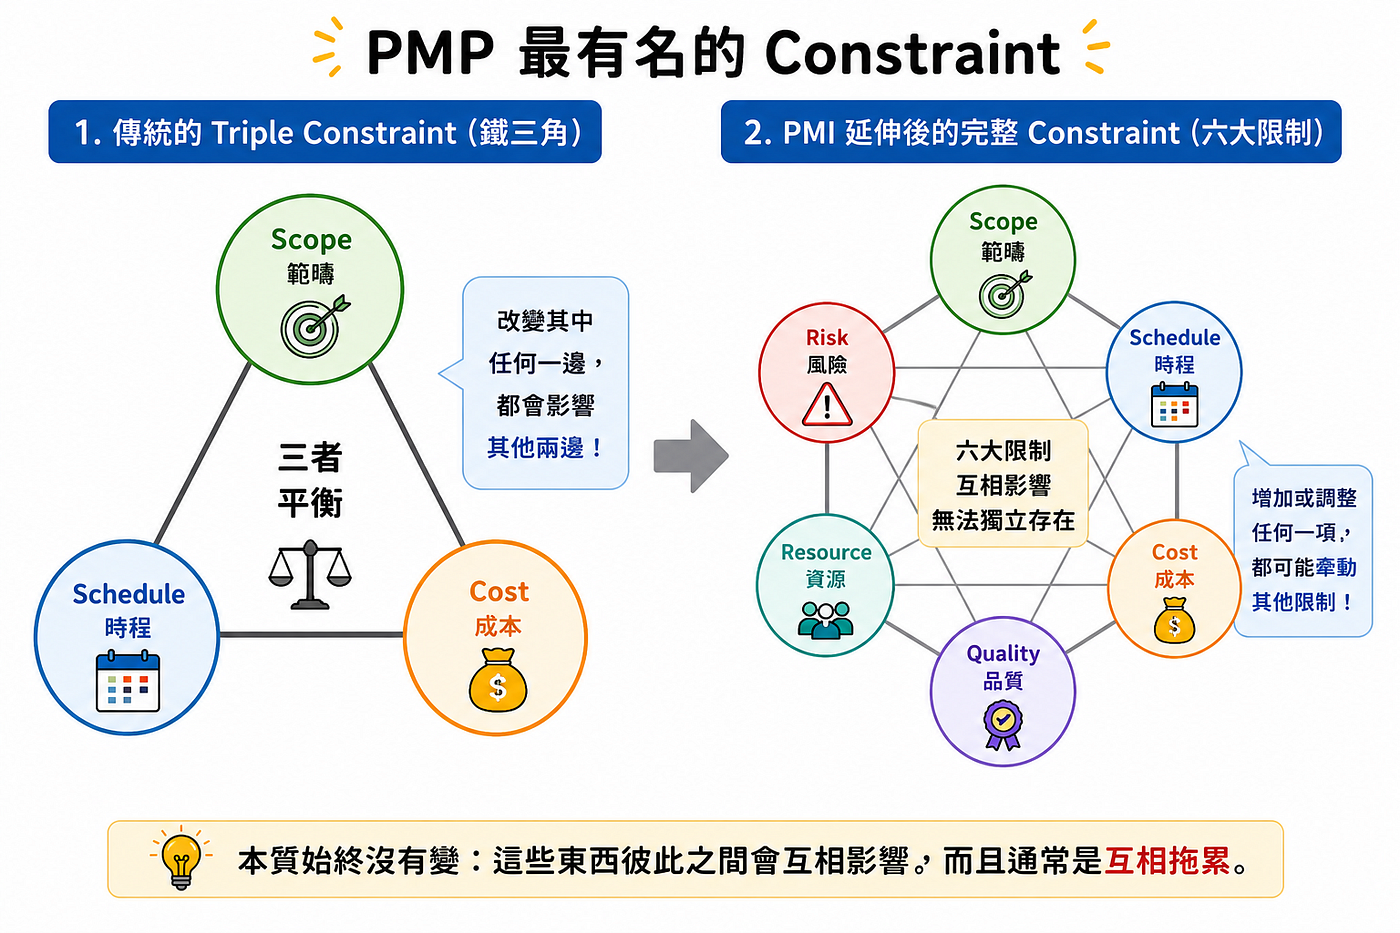
👉 Revisiting one of the most important PMP concepts: Project Constraints. Trust me, this one always comes back on the exam. ⬇️⬇️⬇️
3️⃣ Executing
This is where the project team performs the actual work required to create deliverables.
Some of the key areas a PM focuses on include:
- Team coordination
- Communication
- Stakeholder engagement
- Quality management
- Maintaining alignment with the project plan
This is where Project Managers lead teams, coordinate execution, and turn project plans into actual deliverables.
4️⃣ Monitoring & Controlling
This process group runs continuously alongside execution.
The PM continuously monitors areas such as:
- Project performance
- Schedule and cost variances
- Risks
- Quality
- Scope changes
- Stakeholder concerns
This is where Project Managers track performance, manage changes and risks, and ensure the project remains aligned with its objectives.
5️⃣ Closing
This is where the project is formally completed.
Key PM activities during this phase include:
- Obtaining final acceptance
- Closing contracts
- Documenting lessons learned
- Transitioning deliverables
A strong Closing phase helps organizations improve future projects and retain valuable knowledge.
👉 In future articles, I’ll explore each of these five process groups in much greater detail.
The Real Value of Rita’s Process Chart
Rita’s Process Chart essentially connects all 5 process groups into one unified flow. Instead of treating each process group as a separate block, it shows how they work together dynamically throughout the project lifecycle
where outputs from one phase become inputs for another, creating a continuous and integrated system of project management.
It is a visual framework that organizes the entire PMP/PMBOK system into a structured matrix.
It is built on two main dimensions:
- 5 Process Groups : Initiating, Planning, Executing, Monitoring & Controlling, and Closing, which represent the chronological flow of a project.
- 10 Knowledge Areas : Scope, Schedule, Cost, Risk, Quality, Integration, Resource, Communication, Produrement, and stakeholder which represent the different functional domains of project management.
Within the intersections of these two dimensions, individual processes are placed, showing exactly where each process occurs in the project lifecycle.
The true value of Rita’s Process Chart is not memorization. It’s the development of a real Project Management mindset.
The chart teaches PMP candidates:
- How processes depend on one another
- When key activities should occur
- How information flows between process groups
- How changes in one area can impact the entire project
Instead of memorizing isolated concepts, you start to understand how a real Project Manager moves through Initiating, Planning, Executing, Monitoring & Controlling, and Closing while continuously balancing scope, schedule, cost, quality, resources, risk, and stakeholder expectations.
Final Advice for PMP Candidates
If Rita’s Process Chart feels confusing at first, don’t worry — that’s completely normal. Almost every PMP candidate experiences that same feeling in the beginning.
But once you begin understanding how the processes interact with one another, the PMP framework starts feeling much more logical and connected.
And that’s usually the turning point.
Because at that stage, you’re no longer memorizing disconnected concepts.
You’re beginning to think like a real Project Manager.
And ultimately, that’s what the PMP exam is truly trying to teach.
NOW go open your PMBOK and spend some time with Rita’s Process Chart. It will become your most reliable companion throughout your entire PMP preparation journey!
If you enjoyed this article, feel free to leave a comment, share your PMP study experiences, or follow for more practical project management content explained in a simple and approachable way.
© 2026 [Keywonderer]. All rights reserved. No part of this article may be copied or reproduced without the author’s express permission.
메타데이터
- post_id
- 04e8f2cafe0f
- slug
- pmp-exam-survival-guide-understanding-project-management-processes-and-ritas-process-chart-04e8f2cafe0f
- url
- https://medium.com/@keywonderer/pmp-exam-survival-guide-understanding-project-management-processes-and-ritas-process-chart-04e8f2cafe0f
- canonical_url
- https://medium.com/@keywonderer/pmp-exam-survival-guide-understanding-project-management-processes-and-ritas-process-chart-04e8f2cafe0f
- author_url
- https://medium.com/@keywonderer
- status
- ok
- fetched_at
- 2026-06-28 10:39:35