Between Bricks and Balance Sheets: Why India’s REITs Look Like Equity on the Screen but Behave Like…
When regulators reclassified Real Estate Investment Trusts (REITs) as equity in 2025, it quietly opened up avenues for billions of rupees…
Between Bricks and Balance Sheets: Why India’s REITs Look Like Equity on the Screen but Behave Like Income in the Wallet
When regulators reclassified Real Estate Investment Trusts (REITs) as equity in 2025, it quietly opened up avenues for billions of rupees to flow into Indian property and infrastructure through financial markets. But it also raised a deeper question for investors: are REITs really equity instruments, or are they something else wearing an equity label?
On the exchange, REITs behave like any other listed equity. Their prices vary with interest rate expectations, FII and FDI flows, and broader market sentiment. On the investor’s bank statement, however, they behave very differently. Every quarter, cash lands into the investor’s account with a regularity that most Indian equities simply do not offer. This dichotomy, between how REITs trade and how they pay, sits at the heart of the debate over how they truly belong in the “equity” bucket.
Unlike corporate India where dividends are a boardroom decision, Indian REITs and Infrastructure Investment Trusts (InvITs) operate under a hard rule. By regulation, they must distribute at least 90% of their net distributable cash flow to investors every year. For a listed developer like DLF or Godrej Properties, profits can be retained for land purchases, new projects, or debt reduction. Shareholders may see little or no cash, even in years where companies make record earnings. For a REIT, that option simply does not exist. Most of the cash generated by office parks, malls, highways, or transmission lines must flow out to unitholders.
Dividend structure: REITs vs Real Estate Equity
India’s major listed REITs — Embassy, Mindspace, Brookfield, and Nexus, typically deliver annual cash yields in the range of 5.7 to 6.2 percent to investors¹. That is five to ten times what most large-cap real estate companies pay their shareholders. (refer to table 1)
DLF, the country’s largest listed developer, has averaged a dividend yield of around half a percent. Godrej Properties often pays nothing at all. Even the broader NIFTY 50 index, which includes banks and mature IT firms, struggles to cross a 2 percent yield.

Table 1: Average Annual Yield Comparison (%)
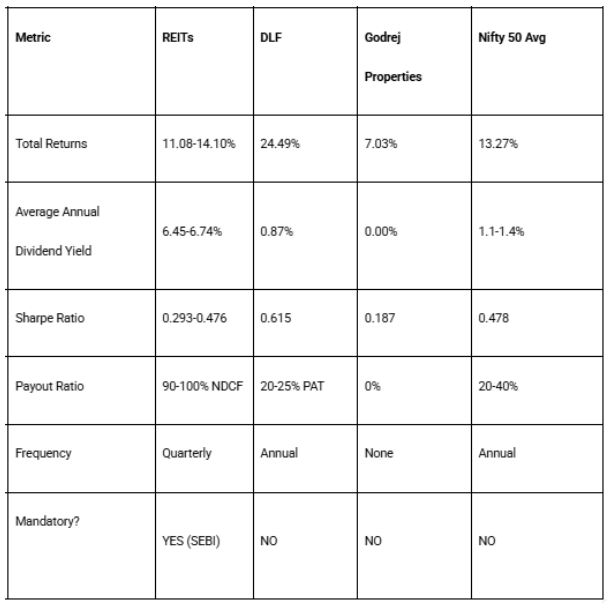
Figure 1: Dividend Yield and Payout Structure: REITs versus Real Estate and the NIFTY 50 Results Calculated for 2021–2026
Risk-Adjusted Returns: What the Sharpe Ratios Reveal
High yields alone do not make an asset attractive. sug- What matters is the total return an investor earns for each unit of risk taken.
Using monthly return data from 2022 to 2025, risk-adjusted performance was evaluated across REITs, InvITs, equities, gold, and long-term government bonds using the Sharpe ratio. The Sharpe ratio measures an investment’s risk-adjusted return, calculating the excess return over the risk-free rate per unit of volatility (standard deviation).
The results show a clear pattern. InvITs ranked highest on a risk-adjusted basis, reflecting strong returns with relatively controlled volatility. REITs placed above both the NIFTY 50 and the NIFTY Realty Index, indicating that their moderate price swings were compensated by stable and high cash distributions. (refer to fig. 2 and fig. 3)

Figure 2: Average Yield Comparison: REITs, NIFTY 50, and Large-Cap Real Estate Developers
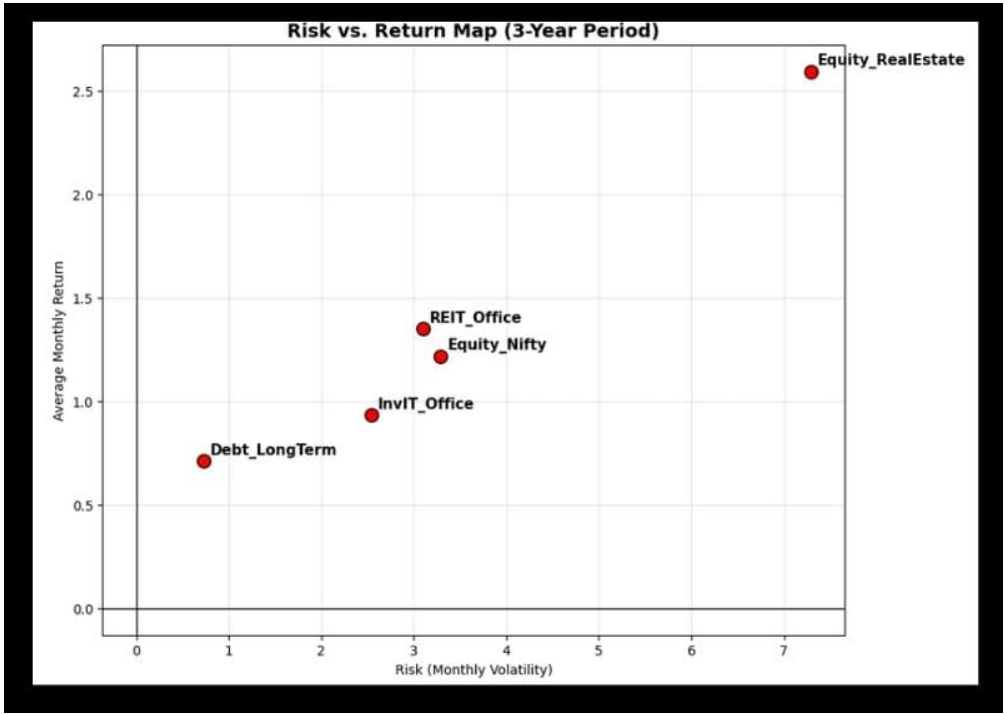
Figure 3: Risk-Adjusted Performance Across Asset Classes
Relevant Regulatory Review
Classifying REITs as equity has structural implications for capital access. Because they now sit within the equity category, they become eligible for allocation inside equity mutual fund portfolios (subject to issuer caps of 10% per issuer and 20% overall exposure)². In practical terms, this potentially opens access to a significantly larger mutual fund capital pool for real estate investment. At the same time, stricter regulations imposed on debt mutual funds after the 2019 reforms reduced certain investor segments’ access to traditional yield instruments³. The equity reclassification therefore reallocates investor access rather than uniformly expanding it.
The move also aligns India with international regulatory practice. In markets such as the United States, Singapore, and Australia, REITs are generally treated as equity-like instruments for portfolio classification and regulatory reporting. This improves cross-border comparability and consistency in benchmarking. However, global practice itself remains debated, as many economists continue to treat REITs as a distinct hybrid asset class because they combine equity trading behavior with bond-like payout mandates.
Market attention further highlights the distinction between developers and listed trusts. DLF is covered by roughly 49 analysts⁴, compared with 16 for Embassy⁵ and about 27 for Mindspace⁶, implying that DLF’s coverage is about twice as higher than the average REIT. (Data on analyst coverage for the other REITs is not public).
What Inflation and Interest Rates Say
Infrastructure trusts, or InvITs, show the strongest statistical relationship with inflation⁷. Their revenues are often tied to regulated tariffs or long-term contracts that adjust with price levels, making them effective short-term inflation hedges. (refer to table 2)
REITs respond more slowly. Office and retail leases typically reset annually or over multiyear periods, which means inflation feeds into investor payouts with a lag. (refer to fig. 4)
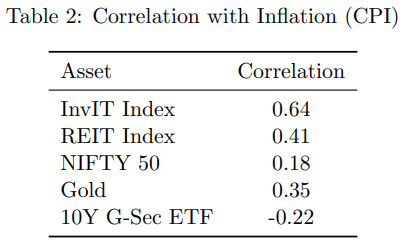
Table 2: Correlation with Inflation (CPI)

Figure 4: Correlation of Asset Returns with Inflation, Interest Rates, and Equity Markets
The Hybrid Reality
Indian REITs occupy a financial middle ground. They are priced like stocks, influenced by capital flows and sentiment. Yet their cash flows are governed by payout mandates and leverage limits that impose a level of discipline closer to fixed-income instruments.
The Bottom Line
The points presented so far reveal that calling REITs “equity” — although not wrong, is certainly incomplete.
They carry equity risk in how they trade and income discipline in how they pay. That dual identity is their defining feature. Investors have to keep these points in mind while dealing with these instruments, looking at their risk appetite and target returns.
As India looks for long-term capital to fund offices, highways, and power networks, REITs and InvITs offer a bridge between savers seeking stable cash flows and markets seeking growth.
Done in collaboration with: Prof. P.P. Maheshwari
메타데이터
- post_id
- 057bb439bc8a
- slug
- between-bricks-and-balance-sheets-why-indias-reits-look-like-equity-on-the-screen-but-behave-like-057bb439bc8a
- url
- https://medium.com/@financeanalyticsclub.iitk/between-bricks-and-balance-sheets-why-indias-reits-look-like-equity-on-the-screen-but-behave-like-057bb439bc8a
- canonical_url
- https://medium.com/@financeanalyticsclub.iitk/between-bricks-and-balance-sheets-why-indias-reits-look-like-equity-on-the-screen-but-behave-like-057bb439bc8a
- author_url
- https://medium.com/@financeanalyticsclub.iitk
- status
- ok
- fetched_at
- 2026-06-21 07:44:09