Build a Production-Ready Monitoring Stack with Prometheus & Grafana Using Docker Compose
A hands-on guide to building a production-ready observability stack using Prometheus, Grafana, exporters, and Docker Compose.
Build a Production-Ready Monitoring Stack with Prometheus & Grafana Using Docker Compose
A hands-on guide to building a production-ready observability stack using Prometheus, Grafana, exporters, and Docker Compose.
Monitoring is one of the most important parts of modern DevOps and Cloud-native infrastructure.
No matter how good your application is, if you cannot monitor:
- CPU usage
- Memory consumption
- Application health
- Container performance
- Server availability
…then troubleshooting becomes extremely difficult.
In this blog, we will build a simple yet production-style monitoring stack using:
- Prometheus
- Grafana
- Docker Compose
By the end of this guide, you will have:
- Prometheus collecting metrics
- Grafana visualizing dashboards
- Persistent storage
- Docker networking
- Basic production recommendations
If You Can’t Monitor It, You Can’t Scale It.
Architecture Overview
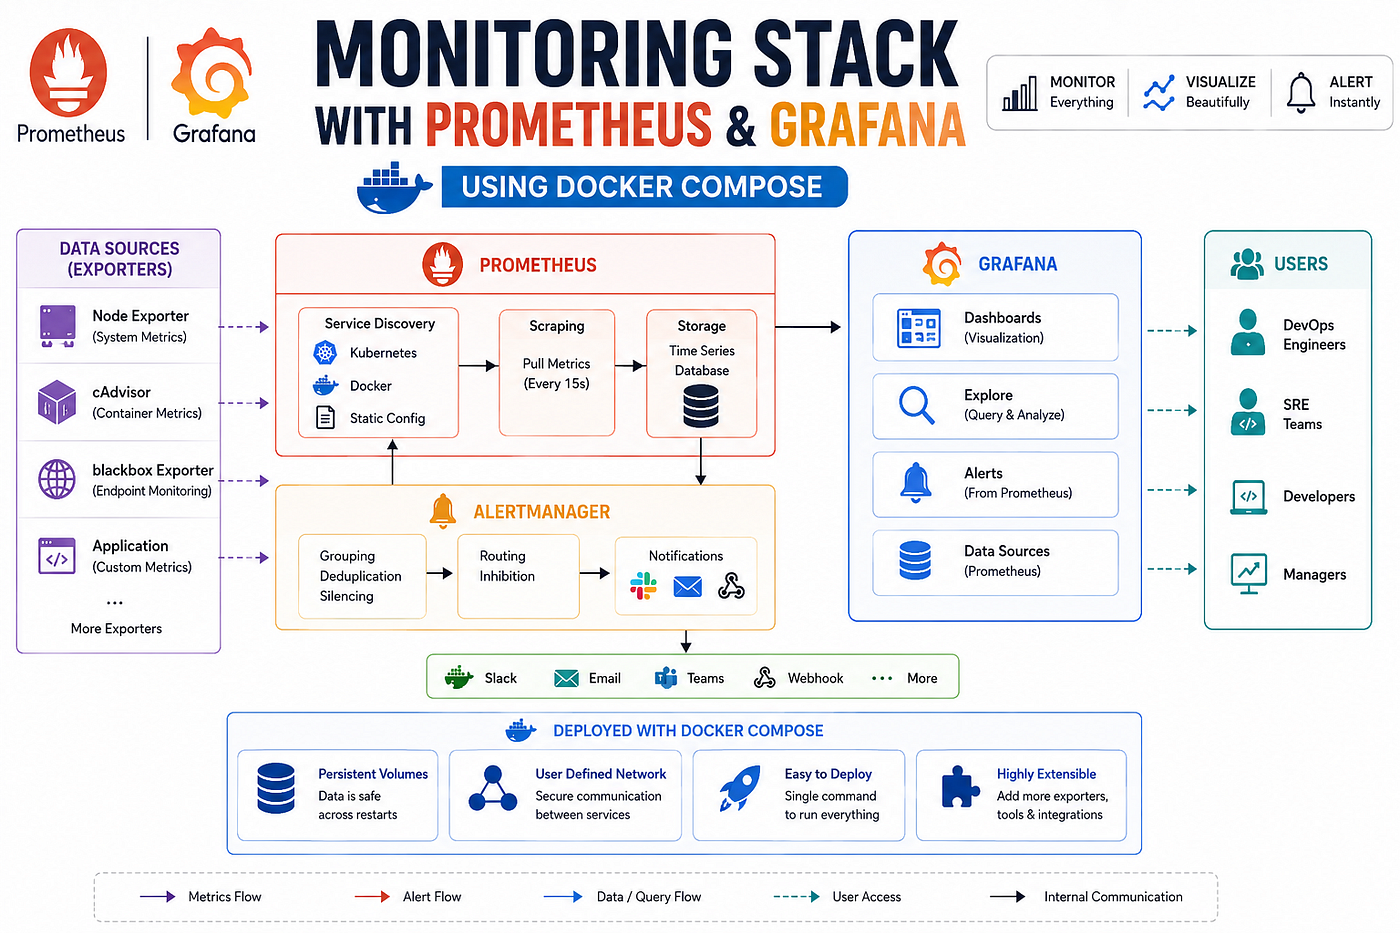
Before starting, let’s understand the flow.
Applications / Servers
          ↓
     Exporters
          ↓
    Prometheus
          ↓
      Grafana
          ↓
   Beautiful Dashboards
Simple Explanation
- Prometheus collects metrics
- Grafana visualizes metrics
- Exporters expose system/application metrics
Think of:
- Prometheus = Data Collector
- Grafana = Dashboard UI
- Exporters = Metric Providers
Prerequisites
You should have:
- Docker installed
- Docker Compose installed
- Basic Linux knowledge
Verify installation:
docker --version
docker compose version
Project Structure
Create the following directory structure:
monitoring-stack/
│
├── docker-compose.yml
│
├── prometheus/
│   └── prometheus.yml
│
└── grafana/
    └── provisioning/
Step 1 — Create Docker Compose File
Create:
docker-compose.ymlAdd the following content:
version: '3.8'

services:
  prometheus:
    image: prom/prometheus:latest
    container_name: prometheus

    ports:
      - "9090:9090"

    volumes:
      - ./prometheus:/etc/prometheus
      - prometheus-data:/prometheus

    command:
      - '--config.file=/etc/prometheus/prometheus.yml'
      - '--storage.tsdb.path=/prometheus'
      - '--web.console.libraries=/usr/share/prometheus/console_libraries'
      - '--web.console.templates=/usr/share/prometheus/consoles'
      - '--web.enable-lifecycle'

    restart: unless-stopped

    networks:
      - monitoring

  grafana:
    image: grafana/grafana:latest
    container_name: grafana

    ports:
      - "3000:3000"

    environment:
      - GF_SECURITY_ADMIN_USER=admin
      - GF_SECURITY_ADMIN_PASSWORD=GrafanaRocks123!
      - GF_USERS_ALLOW_SIGN_UP=false

    volumes:
      - ./grafana/provisioning:/etc/grafana/provisioning
      - grafana-data:/var/lib/grafana

    depends_on:
      - prometheus

    restart: unless-stopped

    networks:
      - monitoring

networks:
  monitoring:
    driver: bridge

volumes:
  prometheus-data:
  grafana-data:
Understanding the Docker Compose File
Let’s understand the important sections.
Prometheus Service
image: prom/prometheus:latestThis pulls the latest Prometheus image.
Port Mapping
ports:
  - "9090:9090"
This exposes Prometheus on:
http://localhost:9090Volumes
volumes:
  - ./prometheus:/etc/prometheus
  - prometheus-data:/prometheus
Why volumes?
Because containers are temporary.
Volumes help us:
- Persist monitoring data
- Keep configuration files safe
- Avoid losing metrics after container restart
Restart Policy
restart: unless-stoppedThis automatically restarts containers after:
- Reboot
- Crash
- Docker restart
Step 2 — Configure Prometheus
Create:
prometheus/prometheus.ymlAdd:
global:
  scrape_interval: 15s

scrape_configs:
  - job_name: 'prometheus'

    static_configs:
      - targets: ['prometheus:9090']
Understanding Prometheus Configuration
scrape_interval
scrape_interval: 15sPrometheus collects metrics every 15 seconds.
scrape_configs
This defines:
- What to monitor
- From where to collect metrics
Currently we are monitoring Prometheus itself.
Step 3 — Start the Monitoring Stack
Run:
docker compose up -dCheck containers:
docker psYou should see:
- prometheus
- grafana
running successfully.
Step 4 — Access the Applications
Prometheus
Open:
http://localhost:3000Default credentials:
Username: admin
Password: GrafanaRocks123!
Step 5 — Add Prometheus as Grafana Data Source
Inside Grafana:
Navigate to:
Connections → Data Sources → Add Data SourceChoose:
- Prometheus
Set URL:
http://prometheus:9090Click:
- Save & Test
You should see:
- “Data source is working”
- “Data source is working”
Step 6 — Import Dashboard
One of the easiest ways to visualize metrics is by importing community dashboards.
Inside Grafana:
Dashboards → ImportUse Dashboard ID:
1860This imports:
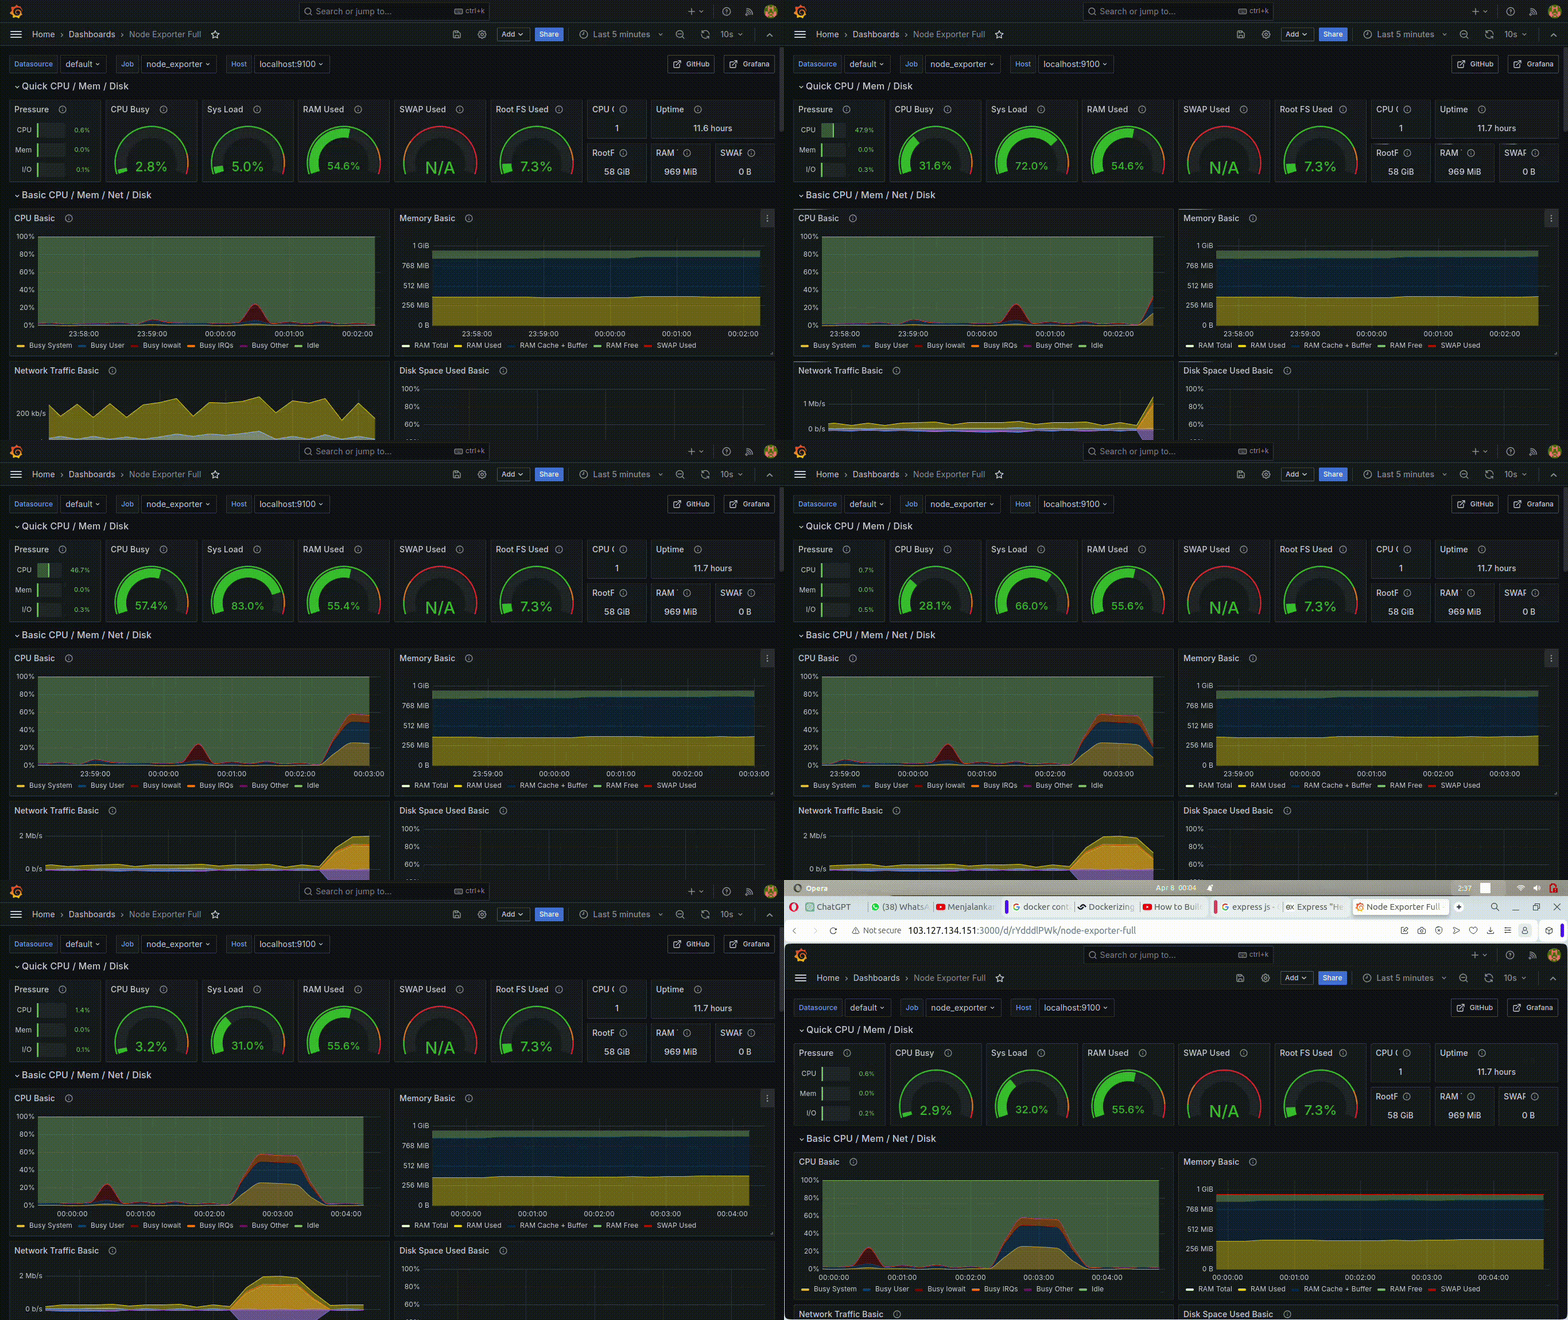
- Node Exporter Full Dashboard
One of the most popular dashboards used in production.
Add Node Exporter (Recommended)
To monitor:
- CPU
- Memory
- Disk
- Network
we use: Node Exporter
Add this service:
node-exporter:
  image: prom/node-exporter:latest

  container_name: node-exporter

  ports:
    - "9100:9100"

  restart: unless-stopped

  networks:
    - monitoring
Update Prometheus Configuration
Add another scrape job:
- job_name: 'node-exporter'

  static_configs:
    - targets: ['node-exporter:9100']
Restart stack:
docker compose restartNow Prometheus starts collecting:
- system metrics
- infrastructure metrics
- resource utilization
Real-World DevOps Understanding
This setup is used almost everywhere:
- Kubernetes clusters
- Cloud infrastructure
- Production applications
- CI/CD platforms
- Microservices
Production Recommendations
1. Avoid Using latest
Instead of:
image: grafana/grafana:latestUse fixed versions:
image: grafana/grafana:11.1.0This prevents unexpected breaking changes.
2. Use Environment Variables
Avoid hardcoding passwords.
Create:
.envAdd:
GRAFANA_USER=admin
GRAFANA_PASSWORD=StrongPassword@123
Then:
environment:
  - GF_SECURITY_ADMIN_USER=${GRAFANA_USER}
  - GF_SECURITY_ADMIN_PASSWORD=${GRAFANA_PASSWORD}
3. Add Alerting
For production systems, integrate:
Alertmanager
This helps send alerts through:
- Slack
- Microsoft Teams
- PagerDuty
4. Add Centralized Logging
Use:
Grafana Loki
for centralized log management.
5. Monitor Containers
Use:
cAdvisor
to monitor Docker containers.
Common Interview Question
Why Prometheus Pulls Metrics Instead of Push?
Prometheus uses a pull model because:
- Easier service discovery
- Better health validation
- Simpler debugging
- More reliable metric collection
Final Thoughts
Monitoring is not optional anymore.
Whether you are:
- DevOps Engineer
- SRE
- Cloud Engineer
- Platform Engineer
- Kubernetes Administrator
…you must understand observability and monitoring fundamentals.
This simple setup gives you:
- Real-world monitoring experience
- Hands-on DevOps practice
- Production-like architecture understanding
Start small. Then gradually add:
- exporters
- alerting
- logging
- tracing
- dashboards
- Kubernetes monitoring
That’s how modern observability platforms are built.
If this blog helped you understand monitoring and observability better, share it with your DevOps/network.
And remember:
You can’t improve what you can’t monitor. 🚀
메타데이터
- post_id
- 07cdf90c9562
- slug
- build-a-production-ready-monitoring-stack-with-prometheus-grafana-using-docker-compose-07cdf90c9562
- url
- https://blog.devops.dev/build-a-production-ready-monitoring-stack-with-prometheus-grafana-using-docker-compose-07cdf90c9562
- canonical_url
- https://blog.devops.dev/build-a-production-ready-monitoring-stack-with-prometheus-grafana-using-docker-compose-07cdf90c9562
- author_url
- https://medium.com/@inanibharat
- status
- ok
- fetched_at
- 2026-06-09 15:37:30