FearSense: Quantifying Fear and Stress in Media — Video Emotion and Fitbit HR Correlation Tool
Can we quantify the emotional manipulation in videos — and measure how it affects our physiological stress?
FearSense: Quantifying Fear and Stress in Media — Video Emotion and Fitbit HR Correlation Tool
Can we quantify the emotional manipulation in videos — and measure how it affects our physiological stress?
Fear Sensor
Meet FearSense — a research platform that detects fear-mongering patterns in video transcripts and correlates them with biometric stress data (like heart rate, HRV, and EDA) from wearables such as Fitbit, Apple Health, or Google Fit.
This open demo bridges media analytics and biometric AI, offering an interactive way to explore how emotional content in videos might trigger measurable physiological responses.
Why Study Fear-Mongering?
From news broadcasts to viral social clips, fear-based narratives are everywhere. While these emotional cues drive engagement, they also affect viewers’ stress levels and perception of reality.
FearSense enables you to move beyond subjective opinion — it quantifies both fear intensity in the media content and stress correlation from real-world biometric data.
In other words: it lets you measure the emotional cost of the content you consume.
NLP + Wearable Data = Emotional Insight
FearSense operates as a dual-stream analytics engine
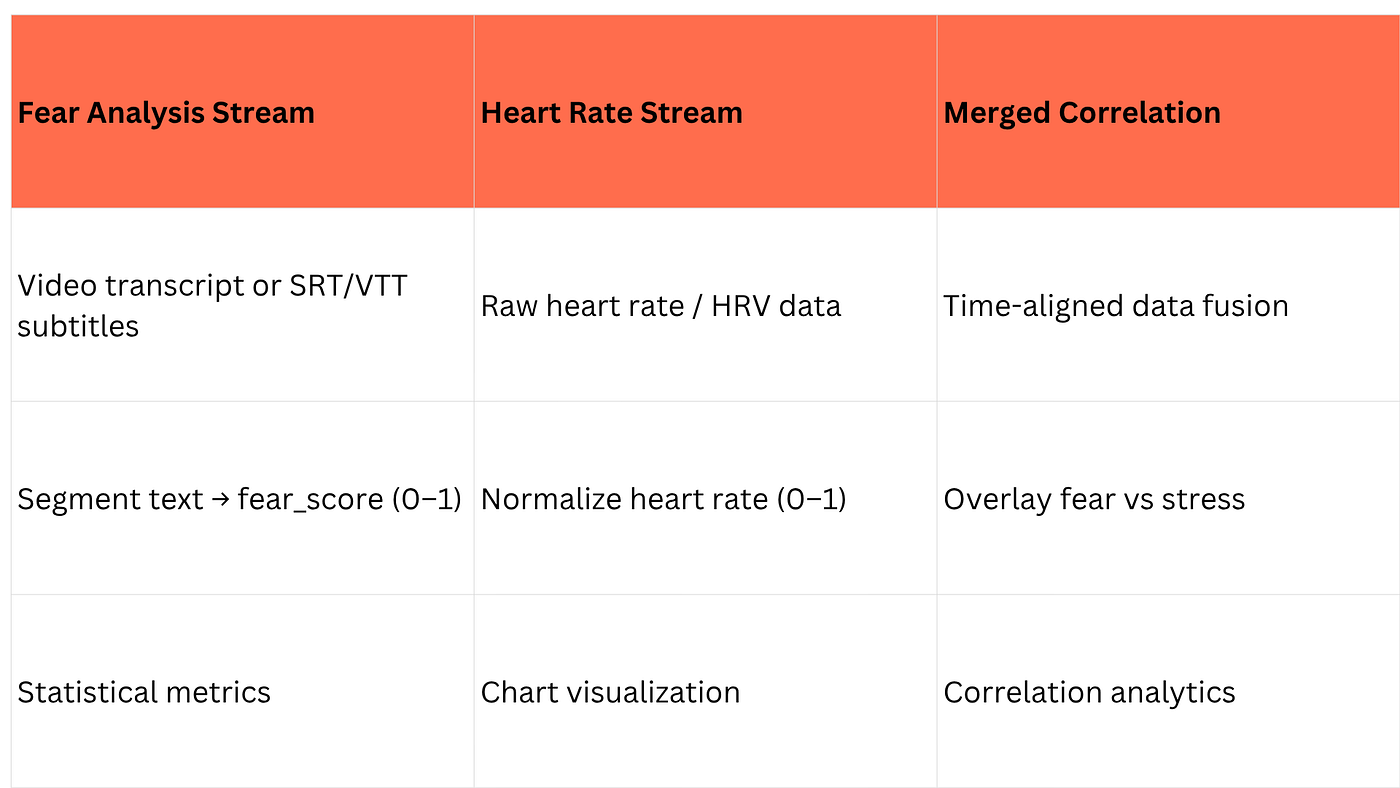
FearSense operates as a dual-stream analytics engine
FearSense’s architecture combines modern ML, APIs, and visual analytics:
Under the Hood
- Backend: FastAPI + Celery for async NLP processing
- Data Storage: Postgres/TimescaleDB for temporal data
- ML Model: FalconsAI/fear_mongering_detection
- Frontend: Streamlit (prototype) or Next.js (scalable build)
- Visualization: Plotly & Matplotlib for dual-axis analytics
- APIs: Fitbit, YouTube Transcript API, Whisper (for MP4s)
Experimentation Workflow
- Input a Video Transcript — via YouTube URL, SRT/VTT file, or manual text.
- Run NLP Fear Analysis — segment text and detect fear-mongering intensity.
- Fetch Biometric Data — connect Fitbit or upload CSV.
- Align Streams — correlate emotional spikes with physiological stress.
- Visualize & Export — view interactive charts or export CSV for R/Python.
Example Insights
- See which parts of a news clip evoke the most fear.
- Discover time-lagged correlations between fear intensity and heart rate.
- Identify “fear peaks” that might align with audience stress responses.
Quickstart for Developers
Fork the Repo — https://github.com/torontoai-hub/fear-monger-detector

https://github.com/torontoai-hub/fear-monger-detector
git clone https://github.com/torontoai-hub/fear-monger-detector.git
cd fear-monger-detector
python -m venv .venv
source .venv/bin/activate
pip install -r requirements.txt
cp .env.example .env
Add your Fitbit credentials to .env:
FITBIT_CLIENT_ID=your_client_id_here
FITBIT_CLIENT_SECRET=your_client_secret_here
FITBIT_REDIRECT_URI=http://localhost:8080/callback
cd src/frontend/correlation_engine
streamlit run app.pyRunning the Demo
Navigate to the app:
cd src/frontend/correlation_engine
streamlit run app.pyThe app will open in your browser at http://localhost:8501
Run Fear Analysis
Option A: YouTube Video
- Paste a YouTube URL into the input field
- The transcript will be fetched automatically
- Preview appears in the “Transcript Preview” expander
Option B: Manual Input
- Paste transcript text into the text area
- Text is immediately ready for analysis
Option C: TED Talks Database
- Open the TED Talks sidebar expander
- Sort by title, views, date, or duration
- Navigate pages and select a talk
- Click to analyze
Configuration Options
Segmentation Settings (Sidebar)
- Segment Mode: Characters | Sentences | Both
- Max Characters: 200–600 (default: 400)
- Max Sentencess: 1–10 (default: 5)
Analysis Parameters
- Fear Threshold: 0.0–1.0 (default: 0.7)
- Scores above threshold = high risk
- Smoothing Window: 1–10 segments (default: 3)
- Reduces noise in timeline
Chart Options
- Type: Line | Bar | Area chart
- Hover Length: 20–500 characters (default: 30)
Analysis Output
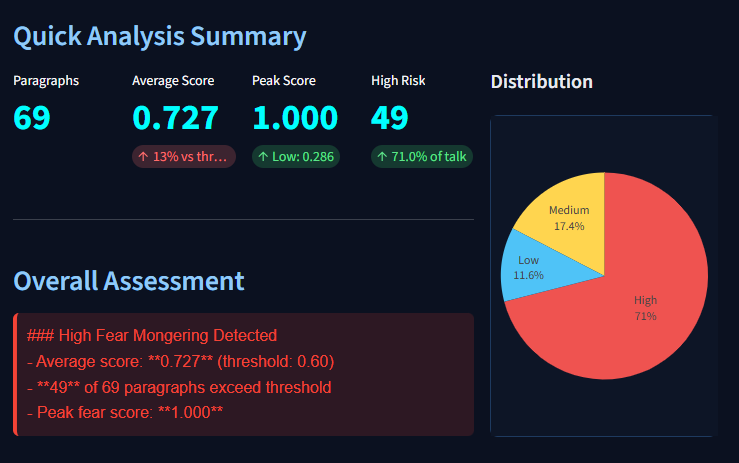
Quick Summary
- Total paragraphs analyzed
- Average fear score vs. threshold
- Peak score and minimum score
- High-risk segment count and percentage
Overall Assessment (Color-coded)
- 🔴 High Risk: Average score ≥ threshold
- 🟡 Moderate: 0.5 ≤ Average score < threshold
- 🟢 Low Risk: Average score < 0.5
Visualizations
- Distribution pie chart (Low / Medium / High)
- Interactive timeline chart (Line / Bar / Area)
- Paragraph-level analysis table
Downloads
- CSV export with all scores and timestamps CSV export with all scores and timestamps
Load Fitbit Heart Rate Data
Prerequisites
- Fitbit account with intraday heart rate data enabled
- Completed OAuth2 authentication (first-time setup)
- Heart rate data recorded on the target date
Steps
- Navigate to the Fitbit Heart Rate Data section
- Select the date using the date picker
- Click the Load Data button
- Wait for the API response (≈5–10 seconds)
- View the heart rate chart for the full day
Troubleshooting
- “No data available”
- Ensure you wore your Fitbit device that day
- Check that heart rate tracking was enabled
- Verify OAuth2 token hasn’t expired
- “Invalid credentials”
- Re-run OAuth2 flow
- Check
.envfile for correct client ID/secret
Align Fear & Heart Rate Streams
Setup Playback Window
- Navigate to Fear vs. Heart Rate Analysis
- Configure the time window:
- Start Time: HH:MM when you started watching
- Duration: Minutes of video playback (1–30)Click Load Fitbit vs Heart Data
What Happens Next Alignment Process
- Fetch Fitbit data for the specified window (1-min resolution)
- Map transcript segments to relative timestamps
- Interpolate fear scores to match heart rate frequency
- Normalize both streams (0 → 1) for comparison
- Merge datasets on aligned timestamps
Output
- Dual-axis chart: Fear score (line) + heart rate (bars)
- Summary metrics:
- Average fear score
- Average heart rate (bpm)
- Number of aligned data points
- Aligned data table: Preview first 20 rows
- CSV download: Full merged dataset
Use Cases
- Identify if fear spikes correlate with heart rate increases
- Detect delayed physiological responses (lag analysis)
- Compare emotional content with objective stress markers
- Export data for custom statistical analysis in R/Python
Quick Tips & Best Practices
Transcript Quality
- Use complete transcripts with proper punctuation
- Verify timestamps are accurate
- Remove non-verbal annotations like
[music]or[applause]
Fitbit Integration
- Ensure intraday API access is enabled
- Wear the device continuously during playback
- Sync Fitbit before fetching data
Analysis Parameters
- Start with the default threshold (0.7) and adjust as needed
- Use smoothing for noisy transcripts
- Compare multiple videos to establish baseline patterns
Correlation Interpretation
- Correlation ≠ causation
- Account for individual baseline differences
- Consider confounding factors (e.g., caffeine, stress, environment)
Use Cases
For Researchers
- Media Studies: Quantify fear-based persuasion in journalism.
- Psychology: Study emotion-to-stress causality in controlled settings.
- Public Health: Examine fear-driven health communication impacts.
For Developers
- Prototype affective computing tools.
- Integrate wearable analytics with NLP pipelines.
- Build emotion-aware applications.
For Individuals
- Understand your emotional responses to media.
- Identify high-stress content and manage exposure.
- Explore mindful media consumption patterns.
Future Directions
FearSense is still a research demo, but the roadmap includes:
- Multi-video batch analysis
- Apple Health
- Real-time streaming analysis
- PDF report generation
- Emotion explainability (LIME/SHAP)
- Multi-language support
- CI/CD with GitHub Actions and Sentry logging
메타데이터
- post_id
- 09a1544b43dd
- slug
- fearsense-quantifying-fear-and-stress-in-media-video-emotion-and-fitbit-hr-correlation-tool-09a1544b43dd
- url
- https://medium.com/@kchandan/fearsense-quantifying-fear-and-stress-in-media-video-emotion-and-fitbit-hr-correlation-tool-09a1544b43dd
- canonical_url
- https://medium.com/@kchandan/fearsense-quantifying-fear-and-stress-in-media-video-emotion-and-fitbit-hr-correlation-tool-09a1544b43dd
- author_url
- https://medium.com/@kchandan
- status
- ok
- fetched_at
- 2026-06-22 05:50:54