Gone fishin’ with Grafana Cloud: How a dashboard helps me catch more fish
With Grafana Cloud, Grafana Assistant, and public marine weather APIs, I built a real-time fishing dashboard that helps me makes smarter…
Gone fishin’ with Grafana Cloud: How a dashboard helps me catch more fish
With Grafana Cloud, Grafana Assistant, and public marine weather APIs, I built a real-time fishing dashboard that helps me makes smarter go/no-go decisions before dawn.
It’s 4:24 a.m. The Jeep is unloaded, the boat is idling in the slip, and my phone has seven tabs open. NOAA tides. NOAA buoys. A swell forecast. Water temperature. I’m trying to triangulate whether this trip happens or whether I should be back in bed.
You don’t see this part of a fishing trip posted on social media: the pre-dawn weather scramble. Weather isn’t just the difference between a good trip and a bad one. It’s also a safety call. And making that call from seven different tabs, half-awake, on a phone screen, is exactly the kind of problem I know Grafana Cloud can solve. I just wasn’t expecting to use it for fishing.

What started as a “wouldn’t it be useful if…” experiment turned into Live Marine Weather for Boaters, a single Grafana Cloud dashboard that pulls real-time marine conditions from two public APIs and renders them in a captain-ready briefing. No login, no API keys, and no scraping. All you need is Grafana 13 or newer, the Infinity data source plugin, and a healthy respect for the fact that the ocean does not care about your plans. The best part: Grafana Cloud’s free tier covers everything you need. Plus, I built most of it by describing what I wanted in natural language, using Grafana Assistant, rather than writing it from scratch.
The first weekend I used it, I called off a trip the dashboard flagged as a 3 hPa pressure crash heading into 18-knot gusts. Saturday morning the marina radio was full of stories from people who didn’t.
Here’s a look at how it works, and how you can build the same thing for anything with a public API, even if you’ve never written a query or built a Grafana dashboard before.
Marine weather is harder than it looks
If you’ve never spent the night before a fishing trip refreshing seven weather sites every five minutes, there are a few factors you’re likely looking at. Getting it wrong ranges from wasted a Saturday to a call to the Coast Guard.
Here’s what you usually factor into the decision:
- Wind speed and gusts. Anything over ~15 mph from the wrong direction can turn a 2-foot chop into a 4-foot chop and make the ride miserable. Direction matters as much as speed: a 15 mph wind blowing with the tide is fine, but the same wind blowing against it stacks waves into a washboard.
- Swell height and period. Wind chop is annoying; swell is what flips boats. A 3-foot swell at 12 seconds is no problem. A 3-foot swell at 5 seconds is like climbing into a washing machine. The period — meaning the seconds between wave crests — is the number most people don’t know to look for, and it’s the one that matters most.
- Tide stage. Moving water feeds fish; slack tide is when they nap. The strongest bites usually happen in the hour on either side of a tide change.
- Barometric pressure trend. Anglers swear by falling pressure ahead of a front. The peer-reviewed research is more skeptical — the real trigger may be changing light and wind, not pressure per se — but the trend still tells you when conditions are about to change, which is half the battle.
- Water temperature. A 4 °F shift over a week can move a species fifty miles up the coast. Striped bass don’t read the calendar; they read the thermometer.
- UV, sunrise/sunset, and precipitation chance. Comfort and safety — and whether you need to be off the water before the 3 p.m. squall line rolls in.
Each of those values lives in a different API, in a different format, on a different refresh schedule. The paid fishing apps that aggregate them run $5–$15 a month — and most of them still don’t show you the one chart that matters: pressure trend over the next six hours.
So I built my own.
Sourcing the data
The whole dashboard runs on two public APIs:
- **Open-Meteo**: atmospheric forecasts (temperature, wind, pressure, UV, precipitation, sunrise/sunset) and a separate marine endpoint (wave height, swell height, swell period). No API key, generous rate limits, and under the hood, it blends the same numerical weather prediction models the pros run on — ECMWF IFS, GFS, ICON, and several regional models — into a single high-resolution forecast.
- **NOAA CO-OPS**: official tide predictions and live water-temperature observations from the U.S. tide-station network. No key, no quota. It’s the actual government data behind every paid tide app you’ve ever bought.
Total cost: $0. Total authentication setup: none.
The plumbing is the Infinity data source plugin, which can call any HTTP endpoint and parse JSON or CSV directly into a Grafana data frame. No Prometheus, no scheduled jobs, no database. The whole dashboard hits only a handful of unique upstream endpoints, which Infinity deduplicates by URL, so a refresh resolves about a dozen panel queries from just several HTTP requests — one per unique endpoint, not one per panel.
Open-Meteo is generous about combining data shapes in a single call. One request with the right parameters returns current conditions, the next four days of hourly data, and per-day rollups in one round trip:
https://api.open-meteo.com/v1/forecast?latitude=38.336&longitude=-75.084¤t=temperature_2m,apparent_temperature,uv_index,weather_code,wind_speed_10m,wind_gusts_10m,wind_direction_10m,pressure_msl&hourly=weather_code,pressure_msl,uv_index,wind_speed_10m,wind_gusts_10m,precipitation_probability,wind_direction_10m,visibility&daily=temperature_2m_max,temperature_2m_min,wind_speed_10m_max,wind_gusts_10m_max,precipitation_probability_max,uv_index_max,weather_code,wind_direction_10m_dominant&past_days=2&forecast_days=4&temperature_unit=fahrenheit&wind_speed_unit=mph&timezone=America/New_YorkPaste that into a browser and you’ll see three top-level objects in the JSON response — current, hourly, and daily — each carrying everything four separate panels need. That’s the trick: one HTTP request, four panels’ worth of data, parsed and reshaped in Grafana Cloud with jq.
Which brings us to the actual dashboard.
Architecture

NOAA CO-OPS and Open-Meteo flow through the Infinity data source into panels.
That’s it. That’s the whole diagram. You don’t need agents, collectors, time-series databases, or retention policies. The trade-off: there’s no historical archive. If you want to look back at last year’s tides, you call NOAA again. For a fishing dashboard, that’s fine, especially for personal use.
The dashboard, top to bottom
The layout follows the order in which I actually need the information when I’m half asleep at 4:24 a.m.
Settings

Dashboard variables bar: data source, location name, latitude, longitude, and NOAA tide and water-temperature station IDs.
Out of the box, the dashboard is pinned to Ocean City, MD (latitude 38.336, longitude 75.084, and NOAA station 8570283 for both tide and water temperature). Unless that’s your home water, the defaults won’t do you much good. Luckily, every location-specific value is a dashboard variable, so you can rebind the whole thing in about thirty seconds.
You’ll need four pieces of information:
- Location name: Whatever you want shown in panel titles, such as “Ocean City”, “Block Island”, “Half Moon Bay.”
- Latitude/longitude: Decimal degrees, and four decimal places is plenty of precision. Right-click your launch ramp in Google Maps and the coordinates appear at the top of the menu.
- NOAA tide station ID: The station that publishes tide predictions for your area.
- NOAA water temp station ID: Often a different station than the tide one, because not every tide station has a water-temperature sensor. (Ocean City Inlet happens to have both at the same station, which is why both defaults are 8570283.)
To find the two NOAA station IDs, click the NOAA CO-OPS Station Lookup link at the top of the dashboard (or go straight to tidesandcurrents.noaa.gov). Locate the station nearest your launch ramp on the map, copy the 7-digit station ID from the station info card, and paste it into the matching dashboard variable. If the closest tide station doesn’t report water temperature, zoom out and pick the next nearest station that does.
Hit refresh, and the whole dashboard rebinds: Open-Meteo picks up your new latitude/longitude, NOAA picks up your new station IDs, and every panel renders against your home water.
Right now: the at-a-glance row

Right now: four compact stat panels for air temp + UV, conditions + wind, marine, and a barometric pressure bar with trend.
The top of the dashboard is four compact stat panels: air temp + UV, conditions + wind, marine (water temperature and current wave height), and a barometric pressure bar that shows current value and 6-hour trend. This is the row I look at first, before deciding whether to read anything else. If the wind is 25 mph and pressure is crashing, I close the tab and go back to bed.
Two details took a surprising amount of fiddling:
- Weather code mapping: Open-Meteo returns WMO weather codes, which are a number between 0 and 99. Code 0 is “clear,” 95 is “thunderstorm.” Grafana value mappings turn each code into a human-readable label with a threshold color, so the panel reads “Partly cloudy” in yellow rather than just “2” with no context.
- Pressure trend: The pressure value alone is meaningless; the direction is what matters. A jq expression in the source query diffs the current reading against the value from 6 hours ago and emits a pressure_trend_6h field, which the stat panel renders as a colored ΔhPa value: green for stable or rising, yellow for slowly falling, and orange/red for rapidly falling. Magnitude matters more than sign; a steady barometer is green, a 3 hPa drop in 6 hours is red.
Tomorrow: same idea, shifted 24 hours

Tomorrow row: the same stat-panel pattern filtered to the next-day forecast window, plus a Next 12 Hours table beneath.
Three stat panels (Temp & UV, Conditions & Wind, Rain & Precip) sourced from Open-Meteo’s daily aggregations for tomorrow, plus a Next 12 Hours table showing hour-by-hour conditions: temperature, rain chance, wind, gusts, wind direction (as a compass), and UV. It’s the row I check the night before to decide whether the boat goes on the trailer.
Tides

Tides: NOAA CO-OPS tide predictions table on the left, hourly tide curve on the right.
A predictions table on the left (high/low with times and heights) and an hourly tide curve on the right, both pulled from NOAA CO-OPS. The curve uses an hourly sampling interval (interval=h), which is plenty smooth for a daily tide chart and roughly a tenth the payload of the 6-minute interval option.
4-day forecast detail: the planning view

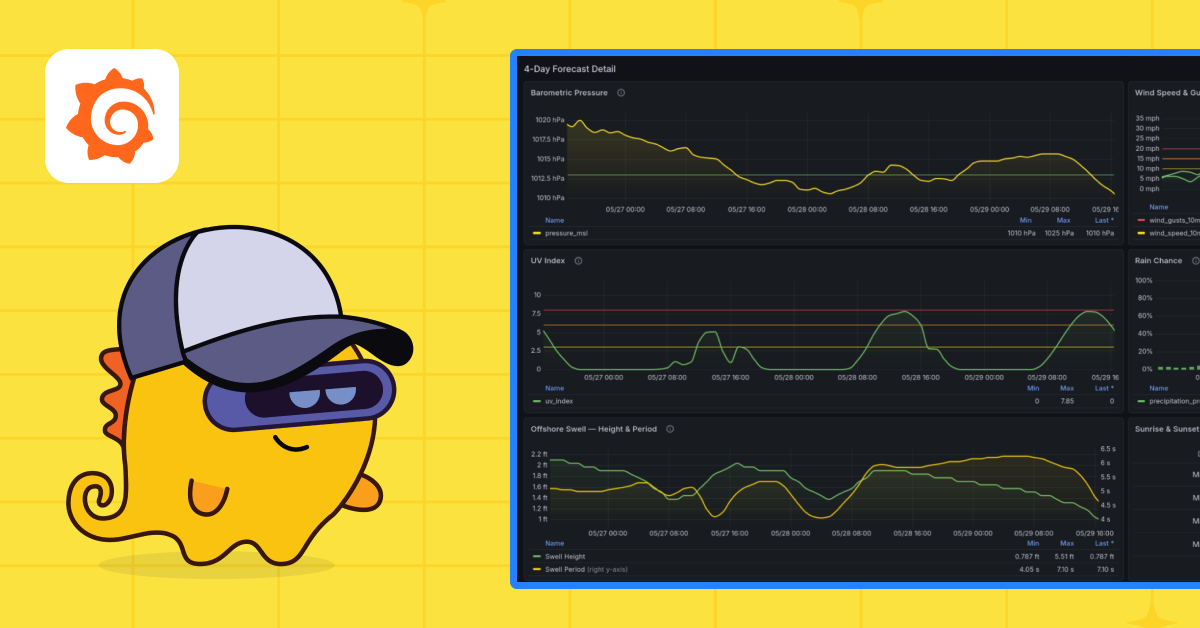
4-day forecast detail: barometric pressure, wind, UV, rain, offshore swell, and sunrise/sunset, arranged in a 2-up grid.
Six time series panels arranged in a 2-up grid: barometric pressure, wind speed + gusts, UV index, rain chance, offshore swell (height and period on dual axes), and a sunrise/sunset table with daylight duration. This is the section I scroll through when I’m planning a Saturday trip on a Wednesday night. The whole row sits inside a collapsed Grafana row by default; it’s there when I need it and out of the way when I don’t.
Last 48 hours: the trend view

Last 48 hours: trend panels for water temperature + wave height, and wind + pressure, over the previous two days.
This is where I can see the previous two days of water temp + wave height (left) and wind + pressure (right), all on dual-axis time series panels. Why look backward on a forecast dashboard? Because the trend matters more than the snapshot. A bite turning on usually correlates with pressure dropping over the previous 6 hours, not with the absolute pressure value at any single moment. Two days of context turn the dashboard from a forecast into a story.
How to read this dashboard: the cheat sheet
A collapsed text panel at the bottom explains what green, yellow, and red mean for each metric, with separate species/temperature tables for saltwater (Mid-Atlantic/Atlantic coast, with active species by 5 °F band) and freshwater (16 game species — bass, walleye, pike, trout, catfish, crappie, etc. with active feeding range, spawn temperature, and notes sourced from state DNR/USFWS/university extension fisheries data). It also documents the threshold colors for wind, pressure, waves, tides, and the dawn/dusk activity window, and is honest about which folk-wisdom rules (solunar tables, “rising = good, falling = bad” and pressure rules) are weakly supported by peer-reviewed research.
It took an afternoon to research and write, and has saved me a hundred follow-up questions.
What Grafana 13 made available
Building a dashboard like this involved several features that became available in Grafana 13 earlier this year:
- **Git Sync (GA in 13):** This is the headline for an open source dashboard. Edit in the Grafana UI, and commit and open a PR back to GitHub without leaving the browser. The dashboard’s source becomes a real artifact — versioned, reviewable, diffable — instead of a JSON blob someone exported once and emailed around. For a community dashboard like this one, that changes the contribution story entirely: a user who wants to add a metric edits the panel in Grafana Cloud, hits “Propose change,” and the maintainer reviews a real PR.
- Conditional rendering (a feature of dynamic dashboards): Panels can show or hide based on variable values — so an “Offshore mode” toggle can hide swell, wave height, and visibility panels for inland users viewing the same dashboard. One dashboard, multiple audiences.
- **Annotation clustering**: Sunrise/sunset and tide-flip markers can pin onto the time-series charts without the dense-marker visual noise that made the same idea unusable in v1.
- **Saved Queries with variable substitution**: Define each consolidated Open-Meteo URL once and reference it from every panel that needs it (replacing the current pattern of inlining the same URL across the panels that share it).
- **Panel styles + Copy/paste panel styles:** Define a threshold set (or a unit set — imperial vs. metric) once and apply it across panels with a click. The kind of ergonomics that template variables can’t yet deliver.
If you’re upgrading from Grafana 12: nothing about how you build panels, queries, or transforms is fundamentally different. What changed is the file the store accepts, the layout primitives you have available, and — with Git Sync — the workflow for keeping a dashboard’s source treated like code instead of a screenshot.
How I used AI to build this dashboard
By now you might be thinking: this sounds like a lot of work. It wasn’t.
When I started this project, my plan was to write a custom app from scratch — a small backend that called the APIs, stored the data, and served a frontend. That’s a real project. Weeks, not weekends.
Instead, I described what I wanted to an LLM. I started with Claude, walking it through the APIs I’d found, the data I cared about, and the layout I had in my head. I asked it to generate Grafana dashboard JSON instead of a standalone app, and it produced a near-perfect first draft. Not “sort of close.” Panels, queries, thresholds, jq transforms, value mappings — almost all of it landed on the first pass.
From there, I cleaned up the rough edges with Grafana Assistant, the AI-powered agent in Grafana Cloud, which can refine queries, adjust panel configuration, and troubleshoot transforms right inside the UI.
The best part: Grafana Assistant has a free tier that covers a personal project on either Cloud or self-hosted Grafana; self-hosted requires linking to a Grafana Cloud account.
Try it yourself
The whole dashboard is open source and free to import. You can be up and running in under five minutes.
Option 1: One-click import from Grafana.com
- If you don’t already have a Grafana instance, sign up for Grafana Cloud — the free tier is more than enough.
- Open the Live Marine Weather for Boaters listing on Grafana.com.
- Click Copy ID to clipboard (the dashboard ID is 25118).
- In your Grafana instance, go to Dashboards → New → Import.
- Paste the ID into the “Import via grafana.com” field and click Load.
- Select your Infinity data source (install the Infinity plugin first if you haven’t already) and click Import.
Option 2: Import from JSON
- Download the JSON file from the dashboard listing (click Download JSON) or grab it directly from the GitHub repository.
- In Grafana, go to Dashboards → New → Import.
- Click “Upload dashboard JSON file” and select the file you downloaded.
- Map the Infinity data source when prompted, then click Import.
After importing
The dashboard will load with its default location of Ocean City, MD. To point it at your home water, update the dashboard variables at the top: your latitude, longitude, location name, and NOAA station IDs (see the Settings section above for how to find them). Hit refresh, and every panel rebinds to your coordinates.
That’s it — you’re fishing, not configuring.
메타데이터
- post_id
- 09e437acf970
- slug
- gone-fishin-with-grafana-cloud-how-a-dashboard-helps-me-catch-more-fish-09e437acf970
- url
- https://medium.com/grafana-labs/gone-fishin-with-grafana-cloud-how-a-dashboard-helps-me-catch-more-fish-09e437acf970
- canonical_url
- https://medium.com/grafana-labs/gone-fishin-with-grafana-cloud-how-a-dashboard-helps-me-catch-more-fish-09e437acf970
- author_url
- https://medium.com/@mackhax0r
- status
- ok
- fetched_at
- 2026-07-09 16:18:44