MongoDB Performance Optimisation
Recently my team had been working on a finance loan underwriting workflow application which has decent load where max TPS can reach up to…
MongoDB Performance Optimisation
Recently my team had been working on a finance loan underwriting workflow application which has decent load where max TPS can reach up to 1000. The application was running on Mongo DB M50 cluster during peak usage times in the month and would auto-scale down to M40 when there was relatively less usage. There were lags observed in the application and users always complained about slow page loads and timeouts. This triggered a deep analysis on the performance of the application and the underlying mongo cluster. At the end of this exercise, the application mongo cluster was successfully downscaled from M50 <> M40 fluctuation to M30 stable (~60% reduction in monthly recurring cost from around $850 per month to less than $400 per month). This activity was executed over a period of ~2 months by continuously monitoring the cluster and optimising for performance. This article covers the issues that were observed in the application and the steps that were taken to fix these issues and the learnings we have had as a team (compiled in the Best Practices section)
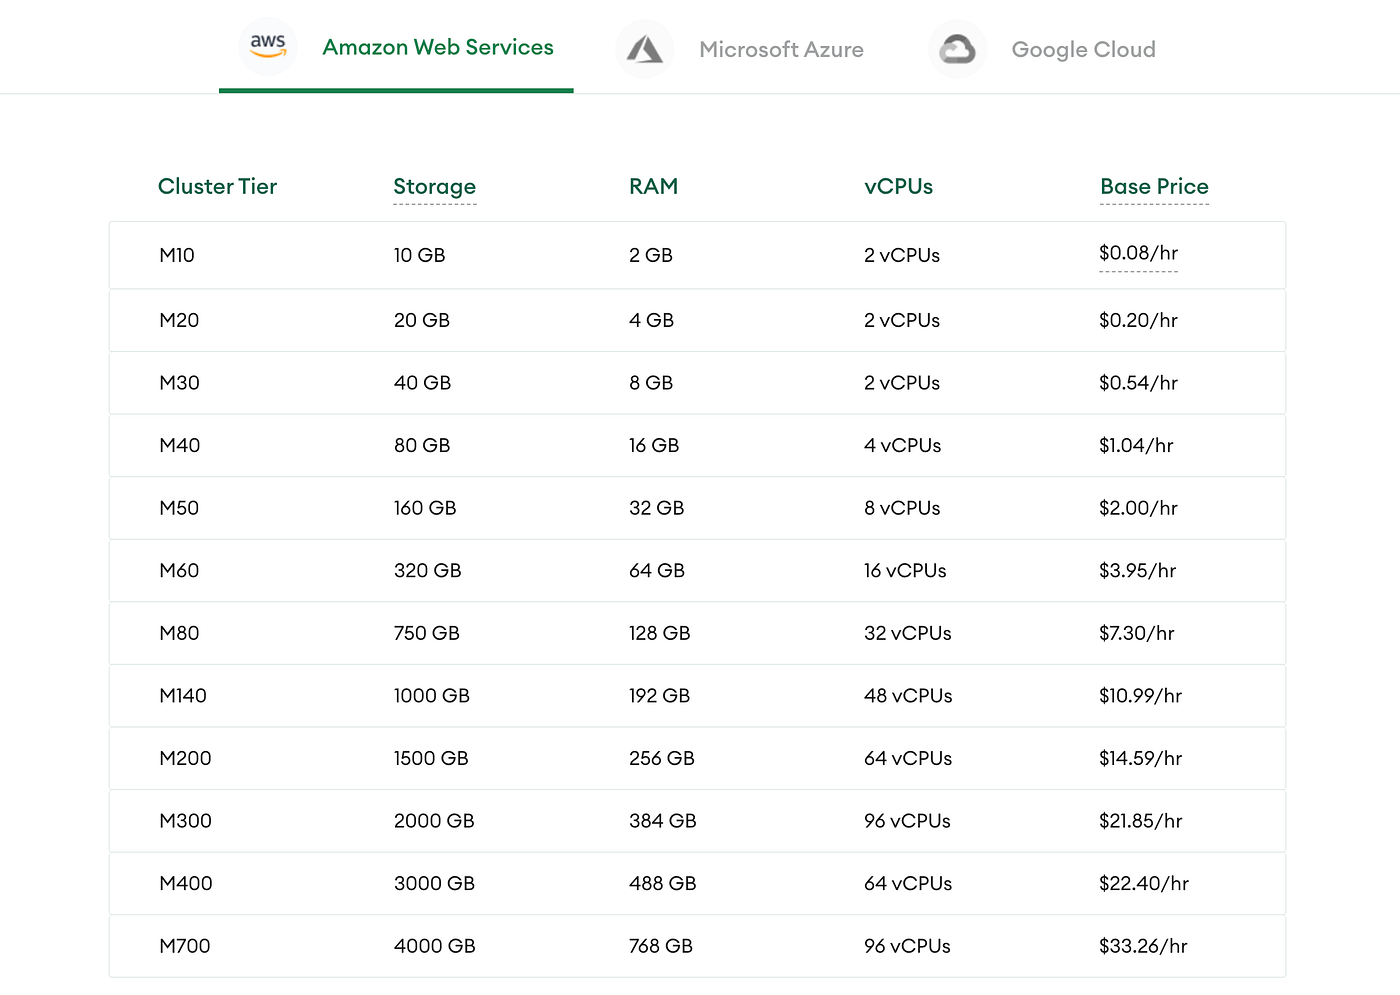
MongoDB Cluster Tiers and Pricing (src: https://www.mongodb.com/pricing)
Incidents observed
- Usually during the month end whenever there is high traffic the application would slow down and the client requests would timeout. This resulted in 5xx errors and associated alerts were sent frequently during month end.
- The landing page of the application would take forever to load which contributed to many incidents complaining of blank screen or search not working. Also, for many operations users had to re-try by clicking on the action button. This bad user experience added to the increased frustration among the application users.
- The mongo cluster with Storage: 4 GB, Read TPS: ~100, Write TPS: ~10 used to auto-scale during the end of the month to M40 and sometimes to M50 tier (in recent months). During this auto-scale there were connection failures in the application which caused 5xx errors.
Underlying Problems
The incidents mentioned in the previous sections were recurring at high frequency which led to a deep analysis activity from dev team. The analysis involved checking the mongo cloud portal for slow queries. The below graph shows a sample of all the queries along with their execution times. This data can be filtered for a given time range. The data points on the upper part of the graph are the slow performing queries.
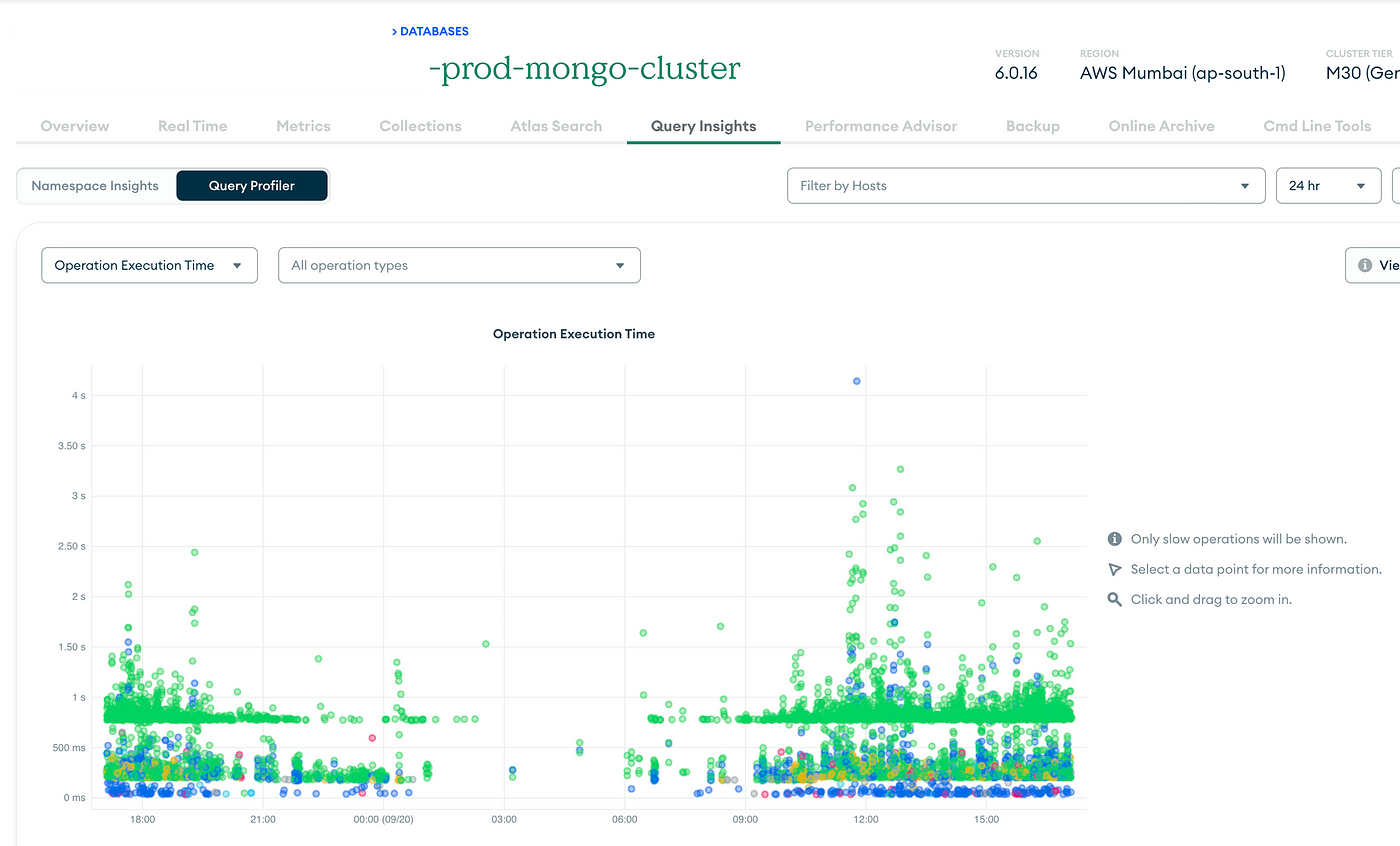
To check the latencies in the queries across operations in all the collections we can navigate to query insights section as shown below,

During this analysis we found that there were many queries which were taking more than a minute to execute. We dug deeper to see what those queries were. On clicking the data points in the above graph we could see the actual query that was fired along with some execution details and explain-statistics.

If we zoom in to the right side of the screen we can see the following interesting metrics,
- Operation Execution Time → Time taken to execute the query
- Examined:Returned Ratio → This ratio talks about how many documents had to be scanned in order to return the final results.
- Docs Examined → No of Documents that had to be scanned in order to return the final results.
- Docs Returned → The final set of documents which were sent as results of the query
By examining these metrics along with the query details, we made some key observations and fixes which are listed in the below section.
Key Observations & Fixes
1. Collation
We saw that there were queries where the index was not being used although there was an index present for the fields in the query conditions. For example,
Consider this example on a collection of pincodes,
collection: pincodes_master
index: state_1_city_1
query: db.pincodes_master.find({state: Karnataka, city: Bengaluru}, collation: locale: en, strength: 2})
If you look at the query above you would expect that the query will use the index state_1_city_1 to return results. But, when we did an explain on the above query we saw that a coll-scan was performed and the index was not used.
On careful observation of the query, we see that there is a section in the query called collation. It turns out that if there is a collation specified in the query then there should be an index with collation created in order for the query to use the index. Let us understand what collation is. According to mongodb official documentation,

The primary reason to use collation is to do any language specific string comparisons. For example, we can do a comparison of two strings or characters based on language specific rules. So, it is important to mention the locale while specifying a collation in the query.
Why was collation used in the Application?
The data being generated in the application and the master data imported from external systems was usually not of good quality and there were often mistakes with case (upper/lower) or formatting (example: top-up vs Top Up). Often there were production incidents reported due to these inconsistent data fields. This was the primary reason for introducing collation in the queries so as to do a case-insensitive search on these fields. This was a quick fix by the developer courtesy of StackOverflow. The mistake the dev did is, not creating an index with collation and assuming that the existing index will work.
Solution: Create index with Collation
As a solution to fix this issue, we created an index with collation. The way to do it is mentioned below,
db.pincodes_master.createIndex({state:1, city:1},{collation:{locale:"en",strength:2}})
After this was done the queries started using the correct index and the execution times came from 10+ seconds to few milliseconds.
2. Regular Expression Queries
There were a lot of regular expression queries written across different collections. If there is a regular expression match condition on a field then the index is not used during query execution and involves an expensive coll-scan. On careful observation of all the different regexp queries it was seen that,
- Some of the fields did not require pattern matching as they represented some kind of unique IDs of the document where there was no need of regexp and a simple match query would suffice. One such example was field
caseId. - For some fields regexp query had to be applied because the underlying data was not consistent in terms of the casing (upper/lower). One such example is a field
caseTypewhich had values likeLEGAL, TECHNICAL, Legal, legal, Technical, technicaletc. For these kind of fields with fixed ENUM values, we took a step to correct the data. This required history data correction and also changes in the application code to sanitise the data during the write operation.
After the above changes were applied, we saw a significant improvement in performance as the query execution now started using the underlying index.
3. Wrong index creation strategy
Many a times, there is a tendency to do a quick fix for performance on slow running queries by creating indexes. If this is not done correctly it will not solve the purpose and adds an additional overhead of managing a huge list of indexes which can eventually hamper the write performance on the cluster. Some such mistakes are mentioned below,
Creating multiple single field indexes on a collection
Whenever we saw that a particular query was slow performing we used to identify the conditional field and blindly create an index for it in a hope that it would improve performance. The fact is, it did improve the query performance but we ended up creating a huge list of indexes. At one point there were 57 indexes on a single collection, which is insane and above the mongodb recommended max number of 20
Blindly following index creation recommendations from mongodb cloud portal
There is a performance advisor section in the mongo cloud which gives a good view of the state of the cluster in terms of performance and also tries it’s best to provide recommendation on actions to take for performance improvement. But, many a times we have observed that the recommendations are similar to the ones discussed in point 1 and we usually end up with huge number of indexes if we follow this blindly.

After doing a bit of reading around performance improvements, we got to know about some best practices for index creation which addresses the issues discussed in points 1 and 2,
Solution: Compound indexes
There is a powerful concept of compound index which ensures that we do not end up creating a lot of indexes and also at the same time make sure that multiple queries involving different fields on the same collection can use one compound index. Compound indexes can dramatically improve query response times. There are certain rules to be followed while creating compound indexes,
The ESR (Equality, Sort, Range) Rule
Equality refers to an exact match on a single value. The following exact match queries scan the pincodes_master collection for documents whose state field exactly matches Karnataka.
db.pincodes_master.find( { state: "Karnataka" } )
db.pincodes_master.find( { state: { $eq: "Karnataka" } } )
Index searches make efficient use of exact matches to limit the number of documents that need to be examined to complete a query. Put the fields that require exact matches first in your index.
Sort determines the order for results. Sort follows equality matches because the equality matches reduce the number of documents that need to be sorted. Sorting after the equality matches also allows MongoDB to do a non-blocking sort.
The following example queries the pincodes_master collection. The output is sorted by population:
db.pincodes_master.find( { state:"Karnataka"} ).sort( { population: 1 } )
To improve query performance, create an index on the state and population fields:
db.pincodes_master.createIndex( { state: 1, population: 1 } )
stateis the first key because it is an equality match.populationis indexed in the same order (1) as the query.
Range filters scan fields. The scan doesn't require an exact match, which means range filters are loosely bound to index keys. To improve query efficiency, limit the range bounds and use equality matches to reduce the number of documents to scan.
Range filters resemble the following,
db.pincodes_master.find( { totalAreaInSqKm: { $gte: 10} } )
MongoDB cannot perform an index sort on the results of a range filter. Place the range filter after the sort predicate so MongoDB can use a non-blocking index sort.
More on the ESR rule here
Cardinality rule
It is an extension to the ESR rule which states that the fields with highest cardinality should be on the left most side of the index followed by the fields with relatively lower cardinality because the MongoDB indexes use a B-tree data structure. Fields with data type boolean, or status fields which hold enum values have low cardinality, whereas text fields which store free text or some kind of IDs have high cardinality. In our pincodes_master example, the right way to create index would be,
db.pincodes_master.createIndex({state:1,city:1,isActive:1,population:1,totalAreaInSqKm:1})
In the above, isActive is a boolean field
After identifying and creating compound indexes by following the ESR + Cardinality rule, and dropping the previously created indexes, we were left with a small number of indexes on our highly used collection (indexes count came down from 57 to 15).
The Result
After applying all the optimisations mentioned above, we could see major boost in query performance and dramatic reduction in CPU utilisation which has enabled us to downscale from M40/M50 to M30. The below screenshot shows the current view of the Normalised CPU

We can see from the graph that the max CPU utilisation lingers somewhere around 18% in the current M30 tier. So, there is scope to downscale the cluster even further to M20. This analysis is on-going as we need to consider the memory utilisation metric which is currently at 70% and take steps to optimise this.
Best Practices
After having had the pitfalls, we have come up with a set of best practices to be followed in order to get the best out of mongodb.
- Data Modelling: Spend enough time in understanding the domain so as to identify the correct entities and the characteristics of the properties (uniqueness, cardinality etc) so as to create right level of abstractions, minimise duplication and effectively create indexes.
- Data Sanitisation: Make sure the data written in the mongodb documents are sanitised (standard set of rules to be applied before storing data. For example, all email ids to be in lowercase and without leading or trailing spaces, all enum fields should follow one naming convention with defined casing.
- Avoid Collation queries as far as possible unless absolutely necessary
- Create compound indexes by following the ESR rule combined with cardinality rule.
- Effective Querying: Make sure all the queries use index and there is no query which relies on coll scan (unless its an exception or a less frequently used query)
- Pagination: Make sure the queries use pagination wherever there is a list of documents to be retrieved. Avoid using
findAll()query - Have TTL fields for logs/audit data with a defined archival strategy
- Effective Searching: Use Atlas search for complex search requirements which involves doing a free text search on multiple fields.
- Storage of blobs: There is a limitation on the size of document in mongodb collection (default 16 Mb). For all standard use cases this should be more than sufficient unless you decide to store media/files inside the collections. This is a bad practice and should be avoided. The references to the files can be part of the mongodb document but the original file should be stored on object storage like S3.
- Isolation of Cluster: If multiple applications share a common cluster then it is very difficult to pin point the cause of performance issues. Also, one application will affect the performance of the other because of the shared access. So make sure the application uses a cluster that is not shared.
- Frequent monitoring: Even after following all the best practices there is always a chance of something being missed out, so keep a habit of regularly monitoring the cluster for query performance, CPU utilisation, Memory utilisation and other key metrics which can indicate the health of your cluster.
메타데이터
- post_id
- 09e45f091afd
- slug
- mongodb-performance-optimisation-09e45f091afd
- url
- https://medium.com/@nitishdeshpande_75025/mongodb-performance-optimisation-09e45f091afd
- canonical_url
- https://medium.com/@nitishdeshpande_75025/mongodb-performance-optimisation-09e45f091afd
- author_url
- https://medium.com/@nitishdeshpande_75025
- status
- ok
- fetched_at
- 2026-06-21 20:33:08