Modify and Monitor Environmental Controls in Packet Tracer
📘 Overview
Modify and Monitor Environmental Controls in Packet Tracer
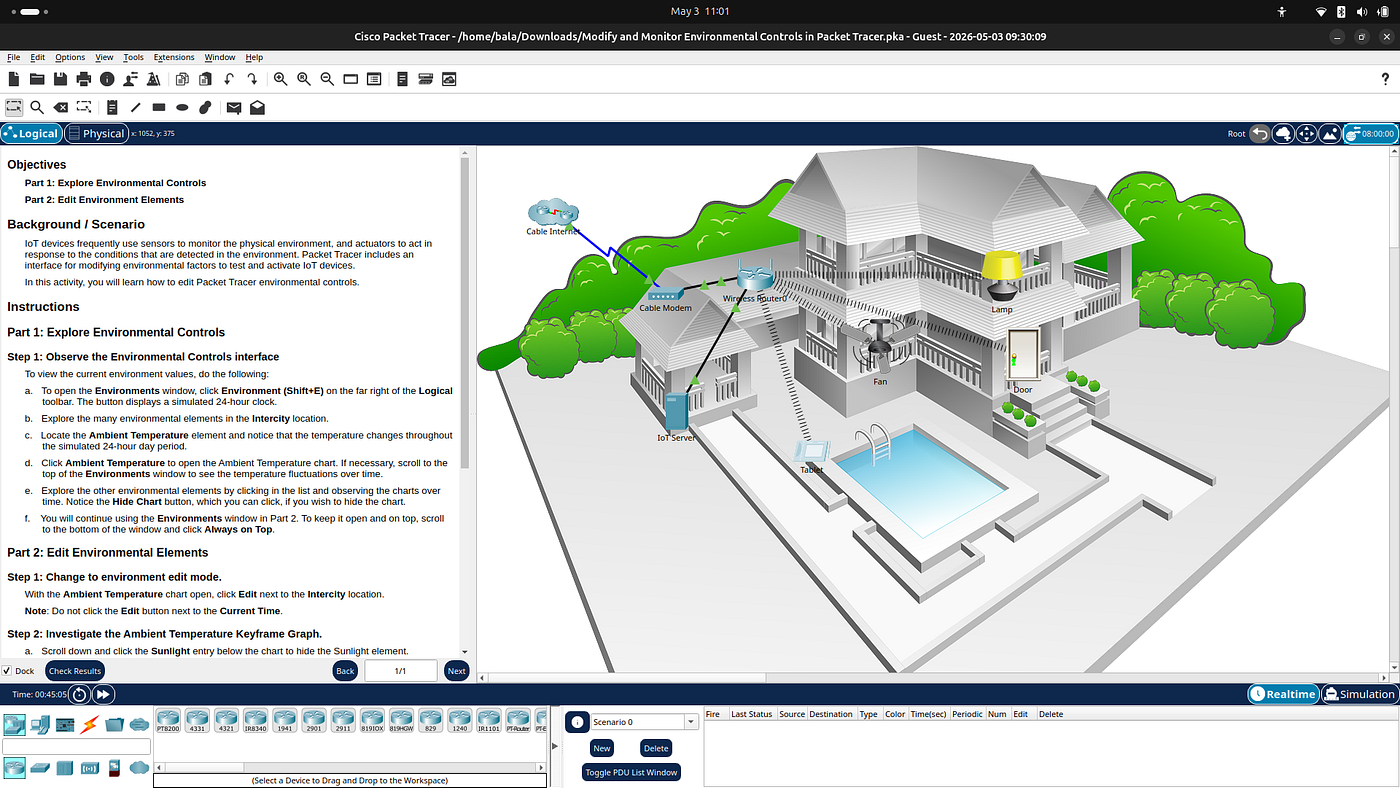
📘 Overview
This lab demonstrates how IoT devices in Cisco Packet Tracer interact with environmental conditions such as temperature, sunlight, and time of day.
IoT sensors detect changes in the environment, and actuators respond accordingly. Packet Tracer allows simulation of these real-world environmental factors for testing and learning purposes.
🎯 Objectives
Part 1: Explore Environmental Controls
- Open and observe the Environment interface
- Study temperature and other environmental elements
- Understand how values change over a 24-hour cycle
Part 2: Edit Environment Elements
- Modify environmental keyframes
- Customize temperature patterns
- Observe how changes affect simulation behavior
🧠 Key Concepts
🌡️ Environmental Controls
Packet Tracer simulates real-world conditions such as:
- Ambient Temperature
- Sunlight
- Time-based variations
📊 Keyframes
Keyframes are fixed control points in a 24-hour graph:
- Each keyframe represents a specific time
- Values between keyframes are automatically interpolated
Example keyframe times:
- 00:00 (Midnight)
- 06:00 (Morning)
- 12:00 (Noon)
- 18:00 (Evening)
- 23:59 (Night)
🧪 Part 1: Explore Environmental Controls
Step 1: Open Environment Window
- Click Environment (Shift + E) in Packet Tracer
- A 24-hour simulation panel opens
Step 2: Observe Environment Elements
- Navigate to Intercity location
- View environmental parameters such as:
- Ambient Temperature 🌡️
- Sunlight ☀️
Step 3: Study Temperature Graph
- Click Ambient Temperature
- Observe the temperature variation across 24 hours:
- Low temperature at night
- High temperature during midday
Step 4: Explore Other Factors
- Click other environmental items
- Observe how each behaves over time
- Use Hide Chart if needed
Step 5: Keep Window Active
- Enable Always on Top
- This keeps the environment window visible during work
⚙️ Part 2: Edit Environmental Elements
Step 1: Enter Edit Mode
- Click Edit next to Intercity location
- ⚠️ Do NOT click edit for current time
Step 2: Understand Keyframe Graph
You will see temperature control points (keyframes):

TimeRole00:00Start of day06:00Morning12:00Midday18:00Evening23:59End of day
Step 3: Modify Temperature (Example: Summer Simulation 🌞)
Set values as follows:
TimeTemperature00:0020°C06:0028°C12:0037°C18:0028°C23:5920°C
➕ Optional Addition
An extra value like:
| 01:00 | 21°C |
👉 This is NOT a problem. It only adds more detail to the graph curve.
Step 4: View Changes
- Click View Mode
- Observe updated temperature graph
- Packet Tracer automatically smooths values between keyframes
Step 5: Live Observation
- Temperature continuously changes in real-time simulation
- Values transition smoothly between keyframes
🔁 Resetting Changes
If you make a mistake:
Option 1: Manual Reset
- Delete unwanted keyframes
- Restore original values
Option 2: Reload Activity
- Close and reopen the Packet Tracer file
- This restores default settings

🧠 Important Learning Outcome
After completing this lab, you understand:
- How IoT devices depend on environmental data
- How simulation environments affect device behavior
- How keyframe-based graphs control real-world simulation models
- How temperature interpolation works in time-based systems
⚡ Conclusion
Packet Tracer’s Environmental Controls allow realistic simulation of:
- Daily temperature changes
- Environmental variation over time
- IoT device response testing
This helps in building real-world IoT automation and smart system understanding.

🏁 End of Lab
메타데이터
- post_id
- 09fdf49fb1f2
- slug
- modify-and-monitor-environmental-controls-in-packet-tracer-09fdf49fb1f2
- url
- https://medium.com/@bala838063/modify-and-monitor-environmental-controls-in-packet-tracer-09fdf49fb1f2
- canonical_url
- https://medium.com/@bala838063/modify-and-monitor-environmental-controls-in-packet-tracer-09fdf49fb1f2
- author_url
- https://medium.com/@bala838063
- status
- ok
- fetched_at
- 2026-06-27 07:40:21