Your DataLoader Is Starving Your GPU. Here is How to Prove It.
A slow PyTorch training job doesn’t always mean your model is slow. Sometimes, the GPU is ready, but the data isn’t. Here’s how to prove it…
Your DataLoader Is Starving Your GPU. Here is How to Prove It.
A slow PyTorch training job doesn’t always mean your model is slow. Sometimes, the GPU is ready, but the data isn’t. Here’s how to prove it in 2 minutes.
A slow PyTorch training job doesn’t always mean your model is slow. Sometimes, the GPU is primed and ready. The batch is not.
This is one of the easiest bottlenecks to misread in machine learning. GPU utilization drops, step time spikes, and the run feels slow. The natural reaction is to start tweaking the model, CUDA settings, or distributed config. But if your input path is the bottleneck, those changes are just rearranging deck chairs on the Titanic.
Before tuning a single hyperparameter, ask: Where exactly did the step time go?
The Pattern of a Starved GPU
A DataLoader bottleneck rarely announces itself directly. Instead, it leaves a crime scene in your telemetry:
- Low GPU utilization (often bouncing unexpectedly).
- High or rising step time.
- Normal memory pressure (no OOMs or strange spikes).
- A massive, unexplained gap before useful GPU work starts.
The root cause varies: too few (or too many) DataLoader workers, expensive custom collation, heavy on-the-fly image decoding, or tokenization sitting in the hot path. In distributed setups, it might be slow object storage, small-file overhead, or unevenly sharded data causing a single rank to drag down the whole cluster.
The golden rule of debugging here is simple: Do not guess. Verify.
The Proof: A Real Experiment
To see how drastically this hidden bottleneck distorts performance, I ran the same PyTorch training setup twice. The only difference? The DataLoader speed.
Here’s what TraceML showed:
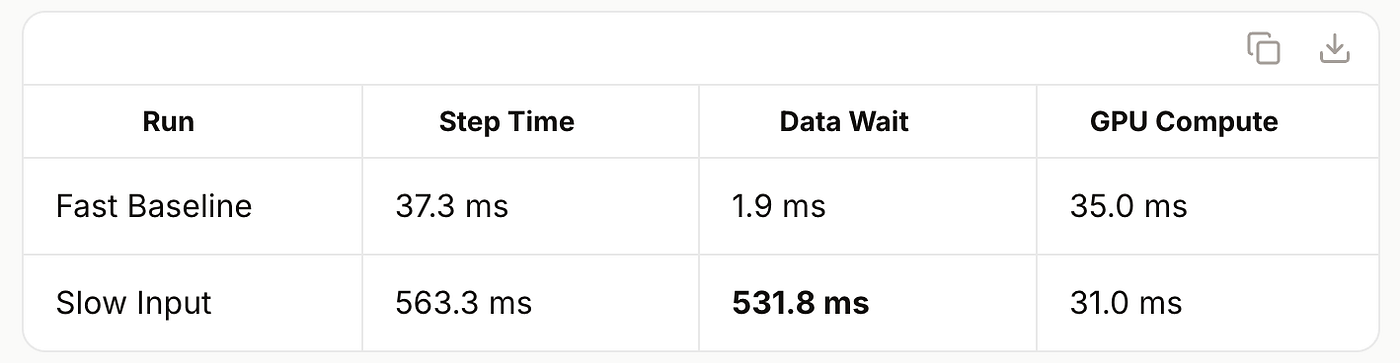
The model compute stayed identical (31 v/s 35ms). The DataLoader stall added 530ms of wait time, turning a healthy, compute-bound run into a grinding, input-bound halt. The GPU utilization plummeted to 7% simply because the hardware spent most of its time waiting for the next batch.
Reproduce It Yourself
Want to see this in action? Try it with TraceML:
# 1. Clone the repo
git clone https://github.com/traceopt-ai/traceml
cd traceml

# 2. Run the fast baseline (no stalls)
traceml run python examples/dataloader_bottleneck_demo.py --args --scenario fast

# 3. Run the slow input path (DataLoader stall)
traceml run python examples/dataloader_bottleneck_demo.py --args --scenario slow
Compare the outputs. In the fast run, you will see:
+----------------------------------------------------------------------------+
|  Step Time: COMPUTE-BOUND                                                  |
|  - Data wait: 1.9ms | GPU compute: 35.0ms | Step time: 37.3ms              |
+----------------------------------------------------------------------------+
In the slow run, you will see:
+----------------------------------------------------------------------------+
|  Step Time: INPUT STRAGGLER                                                |
|  - Data wait: 531.8ms | GPU compute: 31.0ms | Step time: 563.3ms           |
+----------------------------------------------------------------------------+
Full runnable guide with the exact commands: https://traceopt.ai/guides/pytorch-dataloader-bottleneck/
Why “Low GPU Utilization” Is a Dangerous Metric
Many developers treat low GPU utilization as a diagnosis. It’s not, it’s a symptom. A GPU can sit idle for a dozen reasons:
- The DataLoader is stalling.
- Host-to-Device (H2D) transfers are throttling.
- Compute kernels are too short or heavily fragmented.
- The process is stuck waiting on a synchronization barrier.
- One distributed rank is lagging behind the others.
Without phase-level timing, you will tune the wrong thing.
Your Checklist When Input Dominates
If TraceML confirms your run is input-bound, turn your attention to the data pipeline:
- DataLoader & Transfer Mechanics
- Are you using
num_workers=os.cpu_count() // 2? - Is
persistent_workers=Trueenabled to prevent teardown overhead? - Are you using
prefetch_factor=2andpin_memory=True?
2. Preprocessing Hot Spots
- Are you handling heavy image/video decoding or tokenization on the fly?
- Are your custom
collate_fnroutines efficient, or are they re-allocating memory poorly? - Can repeated, static augmentations or feature extractions be cached to disk beforehand?
3. Storage & Sharding
- Is cloud object storage (S3/GCS) or a network filesystem introducing latency?
- Are you suffering from small-file overhead instead of reading sequential chunks (e.g., WebDataset or TFRecords)?
- Are your data shards unevenly sized, creating straggler ranks in distributed training?
The Takeaway
Two slow training runs can look identical from the outside but require entirely different fixes.
- If compute dominates → Optimize the model (kernels, precision, architecture).
- If input dominates → Fix the data pipeline (workers, prefetching, storage).
Stop guessing. Measure first.
Try It Yourself
TraceML is open source: https://github.com/traceopt-ai/traceml
pip install traceml-ai
traceml run python examples/dataloader_bottleneck_demo.py --args --scenario slow
What do you see?
Open a GitHub issue with your final_summary.json . For more guides, visit our website. If this helps, star TraceML on GitHub.
메타데이터
- post_id
- 0b219f112e2f
- slug
- your-dataloader-is-starving-your-gpu-here-is-how-to-prove-it-0b219f112e2f
- url
- https://medium.com/@abhinavsriva/your-dataloader-is-starving-your-gpu-here-is-how-to-prove-it-0b219f112e2f
- canonical_url
- https://medium.com/@abhinavsriva/your-dataloader-is-starving-your-gpu-here-is-how-to-prove-it-0b219f112e2f
- author_url
- https://medium.com/@abhinavsriva
- status
- ok
- fetched_at
- 2026-06-11 15:16:29




