The Global Stress Test
The queue model crosses the Atlantic (and the Pacific)
The Global Stress Test
The queue model crosses the Atlantic (and the Pacific)
The previous chapter validated the capacity model against nine Spanish and European parks. The results were instructive: the model performs well at high-volume parks with homogeneous demand distribution (PortAventura), systematically overestimates where demand concentrates on a handful of attractions (Warner), and underestimates where real operational friction exceeds declared CPH (Phantasialand).
The question now is: do those patterns hold when the model crosses the Atlantic? What happens with parks of massive scale, different operational cultures, more aggressive queue management systems, and attraction formats that simply don’t exist in Spain?
This chapter applies the same D/D/1 model to nine parks outside Spain: from the most visited park in the world to a French cinema park, passing through Japan, China, South Korea and the heart of the American industry.
Before the numbers, the same two warnings as the previous chapter.
First: the model describes peak days. The two-, three- or five-hour queues that appear in these pages are not the average experience at these parks — they are what happens on the worst day of the year. At a park like Magic Kingdom, with 17 million annual visitors, there are perhaps fifteen or twenty days per year at that level of pressure; for the rest of the year the experience is very different.
Second: the CPH figures published by manufacturers assume all trains or vehicles running simultaneously, with optimal loading and no interruptions. In real operation, throughput drops by 15 to 40 percent due to maintenance, breakdowns, slow loading or cultural factors. That difference appears in no published data, but it is what determines the actual queue experience. Tokyo DisneySea demonstrates that operating close to the theoretical is possible; Cedar Point demonstrates the opposite.
Magic Kingdom (WDW) — 17.7 million visitors, the world’s largest
Magic Kingdom, at Walt Disney World (Florida), is the most visited theme park on the planet. In 2023 it received 17.72 million visitors, operating 365 days per year. The daily average exceeds 48,500 visitors, but the design peak — days like Christmas, New Year’s or Thanksgiving — can exceed 70,000 visitors in a single day.
Applying the 65% simultaneous occupancy factor, that means up to 45,500 people inside the park at the same time. That is a scale no Spanish or European park in the previous chapter handles. PortAventura, the largest in our previous sample, peaks at 35,000 — roughly half.
Peak simultaneous occupancy (Magic Kingdom) = 70,000 × 0.65 = 45,500 peopleWhat does Magic Kingdom do with 45,500 simultaneous people? Its main attraction portfolio is deep, but with very specific bottlenecks:

Applying the model to a 70,000-visitor day:
Estimated total experiences   = 70,000 × 6 = 420,000
Peak-hour demand              = 420,000 × 0.60 / 6h ≈ 42,000 PPH aggregate
Empirical validation (thrill-data.com, queue-times.com, 2024 season): Seven Dwarfs Mine Train records peak-day averages of 90–120 minutes, with spikes of 180 minutes at Christmas. Peter Pan’s Flight holds queues of 60–90 minutes on peak days — significantly less than the model predicts.
The model overestimates here for two reasons. First: Magic Kingdom operates with Lightning Lane, a virtual queue system that diverts approximately 30–40% of demand from the most popular attractions into priority lanes, reducing the standby queue. Second: the park has more than 25 operating attractions, which distributes demand far more than the model’s assumption of 6 experiences per visitor captures. A Magic Kingdom guest does not do the 6 main attractions — they do perhaps 10–12, including minor rides, shows, parades and character meet-and-greets.
The pattern holds regardless: Seven Dwarfs Mine Train (1,200 CPH) is the modern attraction with the lowest throughput in the park, and its queues are systematically the longest, confirming the rule from the previous chapter. Peter Pan’s Flight (600 CPH) is a textbook case of a classic attraction with obsolete capacity that survives only because younger visitors don’t prioritise it.
The lesson: even the world’s most visited park, with Disney’s resources, cannot escape CPH arithmetic. Seven Dwarfs Mine Train’s queues are not an operational error — they are the direct consequence of choosing a 1,200 CPH format for an attraction generating blockbuster demand.
Tokyo DisneySea — 14 million visitors, operational excellence
Tokyo DisneySea is the most critically acclaimed theme park in the world. Consistently voted the best theme park on the planet by industry awards (Thea Awards), it receives approximately 14 million visitors per year across just 64 hectares — half the size of PortAventura, a quarter of Magic Kingdom.
The design peak is estimated at 45,000 visitors. Applying 65% simultaneous occupancy: 29,250 people in the park at the same time.
Peak density = 640,000 m² × 0.47 / 29,250 = 10.3 m²/personTen square metres per person at absolute peak. It is the highest density in the entire study — comparable to Phantasialand, and well below the 16 m²/person of the project we are designing. The difference is that Tokyo DisneySea has solved the capacity equation with a combination of high CPH and extraordinarily efficient demand management.

The three anchor attractions — Tower of Terror, Journey to the Center of the Earth and Toy Story Mania! — average 1,500 CPH. That is an extraordinary figure for attractions based on scenes and effects.
Empirical validation (queue-times.com and thrill-data.com, 2024–2025): Queue times at Tokyo DisneySea are surprisingly short for a park of its density. Soaring: Fantastic Flight, the most in-demand attraction, records a peak average of 60–90 minutes. Tower of Terror rarely exceeds 40 minutes on average. Journey to the Center of the Earth holds at 50–70 minutes.
The model predicts longer queues than observed. Why? Three concurrent factors:
First: Japanese operational culture. Tokyo Disney Resort operates to a dispatch standard no other park matches. Vehicles are loaded in seconds, safety instructions are delivered during movement, and dispatch intervals are maintained even during queues — they do not slow down to “give guests time.”
Second: the Standby Pass system. Tokyo DisneySea uses a virtual pass system that is neither a FastPass nor a paid system. It is a demand-distribution mechanism that smooths peaks without generating the “two-tier queue” perception of American systems.
Third: the park operates 365 days but demand self-regulates. On the densest days, the park fills to the point where the experience becomes uncomfortable, and local visitors simply choose another day. The combination of weather forecasting, school calendars and cultural tradition produces a flatter demand distribution than any Western park.
The lesson: the model works, but operational culture can shift the result by up to 40%. Tokyo DisneySea demonstrates that declared CPH is not the only factor — real loading speed, operational discipline and demand management can produce queues 30–50% shorter than pure arithmetic predicts.
Universal Islands of Adventure (Orlando) — 10 million visitors, the Hagrid’s case
Islands of Adventure (IOA) at Universal Orlando received approximately 10 million visitors in 2023. It operates roughly 365 days per year with an estimated design peak of 40,000 visitors and simultaneous occupancy of 26,000 people.
The reason IOA deserves its own analysis in this study is a single attraction: Hagrid’s Magical Creatures Motorbike Adventure.

Hagrid’s has a declared CPH of 1,700 PPH — one of the highest in the study. It is an Intamin launched coaster with 14 riders per vehicle, designed specifically to maximise throughput. 1,700 PPH exceeds Shambhala (1,680), Blue Fire (1,720), and most anchor attractions at any park in the sample.
And yet its real queues are legendary for their length.
Empirical validation (queue-times.com, May 2026): At the time of writing, Hagrid’s is showing a queue of 140 minutes on a mid-range attendance day. Historical data shows peaks of 240–300 minutes during high season, years after opening.
Peak-hour demand (40,000 visitors) ≈ 24,000 PPH aggregate
Percentage of visitors wanting Hagrid's ≈ 25%
Demand on Hagrid's ≈ 6,000 PPH
Hagrid's CPH = 1,700
Estimated queue (D/D/1) = (6,000 − 1,700) × 2h / 1,700 = ~5 hours
The model predicts 5-hour queues. Real peak queues are 3–4 hours. The discrepancy is explained by the fact that not all visitors who want Hagrid’s attempt it during peak hours, and because the park has a Virtual Queue system that redistributes part of demand. But 3–4 hours of real queue for a 1,700 CPH attraction is an anomaly that deserves explanation.
Hagrid’s is an attraction with infinite demand. It is the newest Harry Potter attraction in the Universal Orlando resort, in the park with the world’s most iconic Harry Potter experience (Hogsmeade + Hogwarts Castle). The novelty has not worn off after 7 seasons. The “I need to ride Hagrid’s” factor is so high that even at 1,700 CPH, demand exceeds capacity for most of the day.
The Hagrid’s case contradicts a conclusion from the previous chapter — where we stated that 1,400–1,500 CPH is sufficient to keep queues below 60 minutes. The necessary additional condition is that demand must not exceed CPH by a factor greater than 2. When demand on an attraction is 3 or 4 times its CPH, no throughput figure can save it.
VelociCoaster (1,200 CPH) illustrates the opposite case: a next-generation attraction with lower CPH than Hagrid’s but significantly shorter queues (60–90 min at peak). The difference is that VelociCoaster does not carry the same cultural demand — it is not “the Harry Potter attraction”. Its demand is high but not infinite.
The lesson: the model needs a correction factor for attractions with extreme cultural load — those that, through their IP, transcend capacity metrics. For those attractions, even 1,700 CPH may be insufficient.
Disneyland Paris — 10.2 million visitors, the Crush’s Coaster case
Disneyland Paris receives approximately 10.2 million visitors at its Disneyland Park and 5.5 million at Walt Disney Studios (soon to be Disney Adventure World). Together the two parks total around 15.8 million annual visitors.
The design peak at Walt Disney Studios is estimated at 20,000 visitors. That is where the attraction we need to examine is located: Crush’s Coaster.
Crush’s Coaster (2007) is a spinning coaster themed to Finding Nemo. It is, by a wide margin, the attraction with the longest queues in all of Disneyland Paris — including the main park.

Empirical validation (queue-times.com, historical 2014–2026): Crush’s Coaster records a historical average of 65 minutes wait, with a peak average of 96 minutes. On the most extreme days, the queue reaches 300 minutes (the maximum queue-times.com records).
Crush's Coaster CPH = ~700
Peak-hour demand on attraction = ~2,500 PPH
Estimated queue = (2,500 − 700) × 2 / 700 ≈ ~5 hours
Crush’s Coaster is the clearest case of structural imbalance between demand and capacity in the entire sample. With 700 CPH and the demand it generates as the only modern coaster in the studios park, queues are unmanageable without intervention. Disney has addressed it with a Premier Access system (paid) that diverts part of demand, but the standby queue remains the longest in the resort.
The data point for the project: an attraction of ~700 CPH in a park with 20,000 visitors produces 60-minute queues on an average day and 3–5 hour queues at peak. No theming, IP or experience quality compensates for that arithmetic. The decision to install a low-throughput attraction must be accompanied by a demand management strategy from the design stage — not added when queues are already a problem.
Shanghai Disneyland — 9 million visitors, capacity engineering from day one
Shanghai Disneyland opened in 2016 with a different philosophy to any other Disney park: capacity was designed from the first sketch.
The result is Pirates of the Caribbean: Battle for the Sunken Treasure, a dark ride combining the world’s largest panoramic screen of its type, state-of-the-art animatronics, a magnetic boat system with 360° movement and a CPH of ~2,400 PPH. It is, by a substantial margin, the highest-throughput attraction at any Disney park in the world.
Pirates Shanghai CPH = ~2,400 PPHFor comparison:
- Pirates Disneyland Paris: ~1,800 PPH
- Pirates Magic Kingdom: ~1,800 PPH
- Seven Dwarfs Mine Train: ~1,200 PPHTRON Lightcycle Power Run (estimated 1,400 CPH) and Roaring Rapids (~1,600 CPH) complete a portfolio where no main attraction falls below 1,100 CPH.
The model applied to Shanghai Disneyland:
Estimated peak: 40,000 visitors
Simultaneous occupancy: 26,000 people
Peak-hour demand: ~24,000 PPH aggregate
Empirical validation (queue-times.com, 2024–2025): Pirates of the Caribbean in Shanghai rarely exceeds 40 minutes even on high-attendance days. TRON holds at 45–75 minutes. The model’s predictions are consistent with observed data.
The lesson from Shanghai Disneyland is the most important in this chapter for our own project: when CPH is designed from the beginning as a system requirement, not a consequence of the attraction, queues stay under control even under high demand. Pirates of the Caribbean in Shanghai receives as much demand as any Disney attraction in the world, but because its CPH is 2,400, queues never spike.
It is not coincidence that Shanghai Disneyland is the modern Disney park with the shortest average queues. It is the result of a deliberate design decision.
Everland (South Korea) — 5.85 million visitors, the Asian non-Disney reference
Everland, South Korea’s largest park, received 5.85 million visitors in 2024. Owned by Samsung, it operates 365 days per year with an estimated design peak of 30,000 visitors.
The main attraction is Monimo RUSH (formerly T-Express), an Intamin wooden coaster opened in 2008. At 56 metres tall and 104 km/h, it is the tallest, fastest and longest wooden coaster in Asia.

Empirical validation (forum queues and reviews, 2024–2025): Monimo RUSH holds queues of 60–90 minutes on peak days, with spikes of 120 minutes on summer weekends. That is significantly less than the model would predict for a single 1,500 CPH anchor in a 30,000-visitor park.
The explanation is that Everland, like most Asian parks, has a different demand structure: visitors spend more time in non-mechanical areas (gardens, safaris, shows, parades) than in adrenaline attractions. The Western model of “6 experiences per visitor” does not apply directly — an Everland visitor might do 3–4 mechanical attractions and spend the rest of the day at the zoo, the themed gardens and seasonal events.
Correction factor for Asian parks with zoo/safari zone:
Experiences per visitor ≈ 4, not 6
This reduces aggregate demand on mechanical attractions by approximately 33%, producing shorter queues than the base model would predict.
The lesson: the model needs to be calibrated by park profile. A park with a zoo, themed gardens and high-capacity shows has lower pressure on its mechanical attractions than a pure coaster park.
Cedar Point (Ohio) — 4 million visitors, pure coaster park
Cedar Point, in Sandusky, Ohio, is the definitive roller coaster park: 17 coasters across 147 hectares, a coaster density no other park matches. It received 4.05 million visitors in 2023, operating approximately 150 days per year — summer season plus Halloween events only.
That short operating window compresses demand: the design peak is estimated at 25,000 visitors.

Maverick (Intamin, 2007) is the most striking case. With an estimated CPH of ~600 PPH — the lowest of any major coaster at Cedar Point — it is an attraction the model immediately flags as problematic.
Peak-hour demand on Maverick (25,000 visitors) ≈ 2,000 PPH
Maverick CPH = 600
Estimated queue = (2,000 − 600) × 2 / 600 = ~4.7 hours
Empirical validation (queue-times.com, 2024): Maverick records average queues of 90–120 minutes during high season, with peaks of 180 minutes. That is significantly less than the model predicts — because Cedar Point operates Fast Lane, a paid queue system that diverts between 20% and 40% of demand from the most popular attractions.
Steel Vengeance (1,200 CPH), the park’s highest-rated attraction, records queues of 60–120 minutes at peak. Millennium Force (1,400 CPH) rarely exceeds 45 minutes.
The most interesting data point: Cedar Point demonstrates that in a pure coaster park, visitors do more experiences than in a storytelling park. The estimated average is 8–10 experiences per visitor, not 6 — because there are no long shows, no immersive zones, no safaris consuming time. The whole day is optimised for maximising coaster rides.
That means greater pressure on the capacity system, but also more predictable visitor behaviour for the model.
The lesson: Cedar Point is the extreme opposite of Everland. In a pure coaster park, visitors maximise mechanical experiences, and the 6-experience model understates demand — 8–10 is more accurate. That raises aggregate demand and means even 1,200 CPH attractions can generate 2-hour queues.
Parc Astérix — 2.9 million visitors, France’s new reference
Parc Astérix, 30 km from Paris, received 2.9 million visitors in 2025 — its best year ever. It operates approximately 200 days per year, with an estimated design peak of 22,000 visitors.
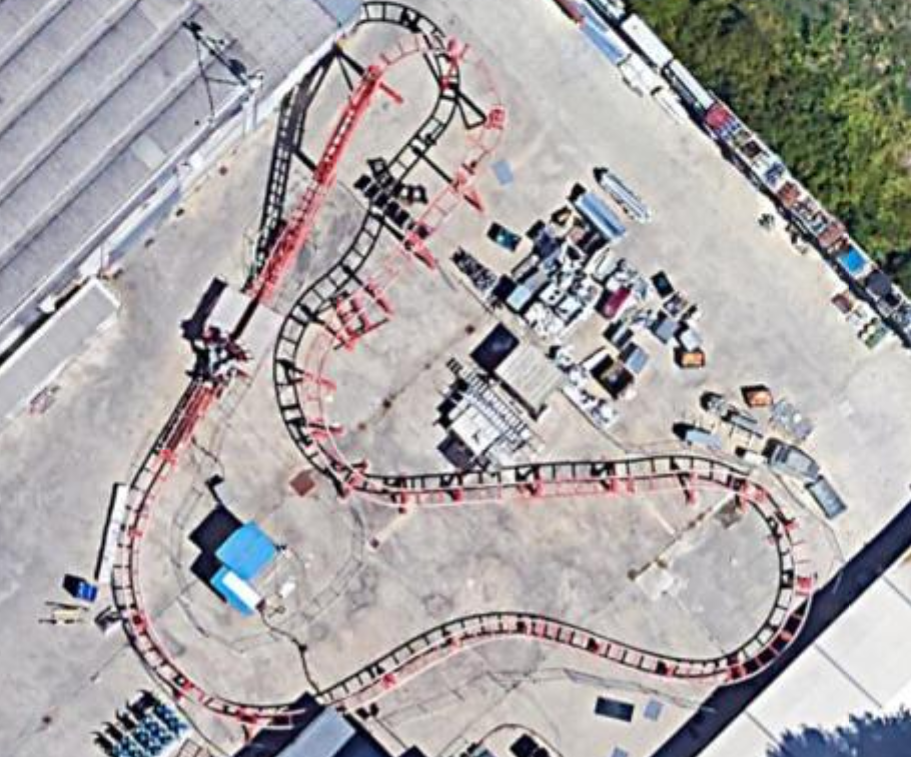
The attraction of interest here is Toutatis, opened in 2023. It is an Intamin launched coaster with 4 launches, 1,250 metres of track and an estimated CPH of ~1,200 PPH.
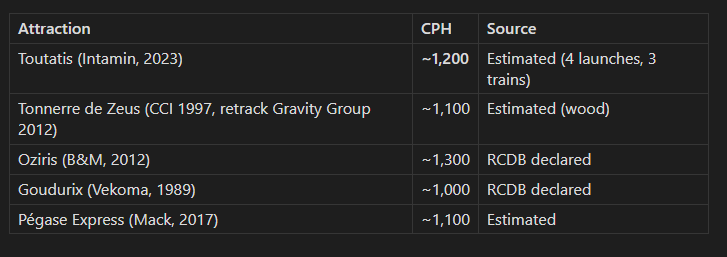
Toutatis is the perfect case study for validating the pattern from the previous chapter: “the newest attraction always has the worst queues.”
Empirical validation (queue-times.com and reviews, 2024–2025): In its first full season (2024), Toutatis recorded queues of 90–150 minutes on peak days, while Tonnerre de Zeus (the established benchmark) held at 30–60 minutes.
Applying the model:
Peak: 22,000 visitors
Peak-hour demand: ~13,200 PPH aggregate
Demand on Toutatis at peak: ~2,500 PPH (novelty factor)
Toutatis CPH: 1,200
Estimated queue: (2,500 − 1,200) × 2 / 1,200 = ~2.2 hours
Empirical validation: 90–150 minutes observed. The prediction is within the correct range for high-season days. The bracket “90–150” captures the difference between a June weekday and a May bank holiday Saturday.
The positive lesson: Toutatis, at 1,200 CPH, generates long but manageable queues (2 hours at peak, not 4–5). Had Toutatis been 900 CPH like Uncharted at PortAventura, queues would have been 3–4 hours. Intamin’s decision to design this coaster with 3 trains and an efficient loading system is the difference between “long but acceptable” and “inoperable without Virtual Queue.”
Futuroscope — 1.9 million visitors, the fixed-session metric
Futuroscope, near Poitiers (France), is a theme park of a different type: its main offering is image, sound and technology attractions — 4D cinema halls, simulators, immersive experiences — more than traditional roller coasters.
It received 1.9 million visitors in 2024, operating 365 days per year. The design peak is estimated at 15,000 visitors.
The main attraction is Objectif Mars (Intamin, 2020), a family spinning coaster with pre-show and post-show, with a declared CPH of 1,000 (RCDB).
But most Futuroscope experiences do not operate on a continuous CPH metric — they operate on fixed-capacity sessions:

The capacity metric for a cinema-based park is different: the bottleneck is not the CPH of an individual attraction but the scheduling of sessions across the day. A 300-seat hall with 4 sessions per hour can absorb 1,200 people per hour, but only if sessions are staggered and visitors choose different time slots.
Peak-hour demand (15,000 visitors) ≈ 9,000 PPH aggregate
Estimated aggregate park capacity at peak ≈ 7,500 PPH
Estimated deficit ≈ 1,500 PPH
Empirical validation (reviews and attendance data, 2024–2025): Futuroscope rarely generates extreme queues. Typical wait times on high-attendance days are 30–60 minutes for main attractions and 15–30 minutes for the rest. The reason: the session system forces a natural distribution of demand — visitors cannot pile up at a single attraction because the hall fills and the next session is 30–60 minutes away.
The metric relevant for the project: in a park with fixed-session attractions, the capacity problem shifts from CPH to schedule design. A poorly staggered system produces 90-minute waits even when aggregate capacity is sufficient. A well-staggered system keeps waits below 30 minutes even under high demand.
The lesson: if the project includes shows or fixed-session experiences (a flying theatre, a 4D hall, an immersive cinema), the session schedule is as important as the declared CPH.
Global model validation

What the global validation teaches about the model
The table above extends the validation from the previous chapter to a global context. The error patterns hold, but new nuances emerge.

Three conclusions about the model not present in the previous chapter:
First: the model needs a correction factor by park profile. The assumption of 6 experiences per visitor works in Western storytelling parks (Disney, Universal, PortAventura). But it fails at the extremes: a park with a zoo and gardens (Everland) needs a factor of 4; a pure coaster park (Cedar Point) needs 8–10. The model is not broken — it needs to be parameterised by park type.
Second: paid queue systems are not noise — they are the new standard. In 2026, every park in the sample with more than 4 million visitors has some form of paid queue avoidance. The D/D/1 model predicts the queue that would exist without that system, which at global parks is systematically higher than the real queue. To use the model as a design tool, a demand discount of 20–40% must be applied to the main attractions in parks with established paid systems.
Third: the model correctly identifies the problematic attractions even when absolute values are off. Seven Dwarfs Mine Train has the worst queues in Magic Kingdom even though the model predicts 155 minutes and reality is 90–120. Crush’s Coaster has the worst queues in Disneyland Paris even though the model predicts 5 hours and reality ranges from 60 to 300 minutes depending on the day. The relative ranking is robust even when the absolutes are not.
What the model says about all of them — now at global scale
Crossing the results of the nine global parks with the nine European parks from the previous chapter, five patterns emerge that transcend regions and scales.
1. Throughput does not scale linearly with park size
Magic Kingdom (17.7M visitors) has attractions with 1,800 CPH. Shanghai Disneyland (9M) has an attraction with 2,400 CPH. The smaller park has the higher-capacity attraction. The reason is not budget — it is that Shanghai was designed with CPH as a requirement, while Magic Kingdom carries attractions from the 1970s with throughputs of 600–1,200 CPH. The size of the park does not determine the CPH of its attractions; the design date and capacity philosophy do.
2. A 1,700 CPH attraction can still produce 3-hour queues if demand is culturally infinite
Hagrid’s contradicts the rule that “high CPH = short queues.” When an attraction is backed by an IP the size of Harry Potter, in the most visited resort in Orlando, and is the most recent addition to that IP, demand can exceed any realistic throughput. The lesson for the project: even with a 1,400+ CPH anchor, the main attraction will need active demand management if the chosen IP generates national anticipation.
3. The range of “experiences per visitor” is wider than assumed

The 6-experience model works for the project (a European storytelling park). But the range shows that the same model applied to a coaster park would underestimate demand by 40%, and applied to a zoo park would overestimate it by 40%.
4. Parks that design for capacity from day one have a structural advantage that cannot be recovered afterwards
Shanghai Disneyland (2016) and Futuroscope (renovated through the 2010s) demonstrate that when CPH is a design requirement rather than a consequence, the park operates with shorter average queues throughout its entire life. Magic Kingdom has carried the burden of Peter Pan’s Flight (600 CPH, 1971) for 55 years. You cannot redesign an attraction to double its throughput without demolishing and rebuilding it. The capacity decision is made once and cannot be corrected afterwards without replacement CAPEX.
5. Queue management is not an add-on — it is part of park design from the beginning
In 2026, not a single park in the global sample operates without some form of demand management: Lightning Lane (Disney), Fast Lane (Cedar Fair), Universal Express (Universal), Premier Access (Disney Paris), Standby Pass (Tokyo Disney). Not one. The decision is no longer “whether” to implement a virtual queue system — it is “which one.” And the choice between a paid system (Lightning Lane, Fast Lane) and a free one (Tokyo’s Standby Pass) determines which visitors have a good experience and which spend the day in queues.
What this means for the project
The model has crossed the Atlantic and the Pacific and remains standing. But the conclusions for the project are more nuanced than before.
1. The minimum CPH for the main anchor rises to 1,400. The evidence from Toutatis (1,200 CPH, 2h at peak) and Hagrid’s (1,700 CPH, 3h due to infinite demand) shows that 1,200 is enough for a park to function, but not to stand out. If the project wants its flagship attraction to stay below 60 minutes on peak day — and that should be the ambition — it needs 1,400–1,600 CPH in the main anchor, with a loading design that minimises operational friction.
2. The queue management system must be free and integrated from design. Tokyo DisneySea demonstrates that a no-cost virtual pass distributes demand more equitably. Magic Kingdom and Cedar Point demonstrate that paid systems create a two-speed experience. For a park that wants to define itself as “the most welcoming park in Spain,” the queue model decision is not technical — it is a positioning decision.
3. The attraction portfolio must be designed to minimise low-CPH rides. The global sample confirms that 600–900 CPH attractions (Peter Pan, Crush’s, Maverick) generate disproportionate queues relative to their contribution to aggregate throughput. In the project portfolio, every attraction below 1,000 CPH must be explicitly justified — not as “thematic filler” but as a demand-distribution tool with an associated queue management strategy.
4. The operating calendar and visitor profile determine real pressure on the system. Cedar Point (150 days) compresses demand and generates more intense peaks. Efteling (365 days) distributes it. The decision on how many days per year the project operates is not only economic — it is a capacity engineering decision that determines the design peak.
5. The opening attraction will define the park’s reputation for 3 to 5 years. Hagrid’s has spent 7 years generating the longest queue at Universal Orlando. Crush’s Coaster has spent 19 years as the worst experience at Disneyland Paris. The project’s first major attraction must be a 1,400+ CPH anchor with an active demand management system from day one — and with an IP that generates the desire to visit without generating infinite demand.
The next chapter closes the engineering and validation cycle with a question no number has yet answered: knowing how many people can come, how many attractions are needed and what queues to expect — how much does all of this cost and how does it get paid for? The financial model of the project.
This series examines the feasibility of a theme park in Asturias from scratch, using the same tools that would apply to a real project. The models are estimates; the conclusions are for the reader to draw.
Published in **Ride Intelligence** — theme park analysis: engineering, capacity, economics.
Published chapters:
- Chapter 1 — Could Asturias Have the Best Theme Park in Spain?
- Chapter 2 — Where to Build It
- Chapter 3 — What Kind of Park Should This Be
- Chapter 4 — The Worst Day of the Year
- Chapter 5 — The Stress Test
- Chapter 6 — The Global Stress Test (this article)
메타데이터
- post_id
- 0b73ed3dcc58
- slug
- the-global-stress-test-0b73ed3dcc58
- url
- https://medium.com/ride-intelligence/the-global-stress-test-0b73ed3dcc58
- canonical_url
- https://medium.com/ride-intelligence/the-global-stress-test-0b73ed3dcc58
- author_url
- https://medium.com/@lluisabg
- status
- ok
- fetched_at
- 2026-06-09 15:37:30