When OT Meets IT: What Happens When a Smart Grid Meets a Lakehouse
How AVEVA CONNECT and Databricks are unlocking the intelligence utilities have always had but never fully used.
When OT Meets IT: What Happens When a Smart Grid Meets a Lakehouse
How AVEVA CONNECT and Databricks are unlocking the intelligence utilities have always had but never fully used.
There is a moment, the first time you walk into a utility control room, where you just stop.
Screens everywhere. Thousands of signals updating in real time. A live map of the grid breathing — load shifting, breakers opening and closing, voltage holding steady across a network that spans an entire city. Operators moving with quiet confidence, making decisions that most people outside this room will never think about.
It is one of the most sophisticated operational environments on the planet. And it generates data — rich, precise, physically meaningful data.
Here is the thing I have come to understand after spending years in this space, the engineers have always known there was more in that data than they were able to use. The ambition to do more, to predict failures before they happen, to reason across the whole fleet, to stop being purely reactive was never the missing piece.
The technology was.
That has now changed. And the industry is starting to move.
For years, the question the grid answered was: what is happening right now?Useful? No doubt. Essential.
But once the technology stops being the constraint, a different question starts surfacing. Slowly at first, then louder.
What about what happens next?
This article explores the architecture that makes that possible — how OT data and modern Lakehouse platforms come together, and what it takes to get there.
“This is a reference architecture based on current industry patterns and emerging integrations, not a single implementation.”
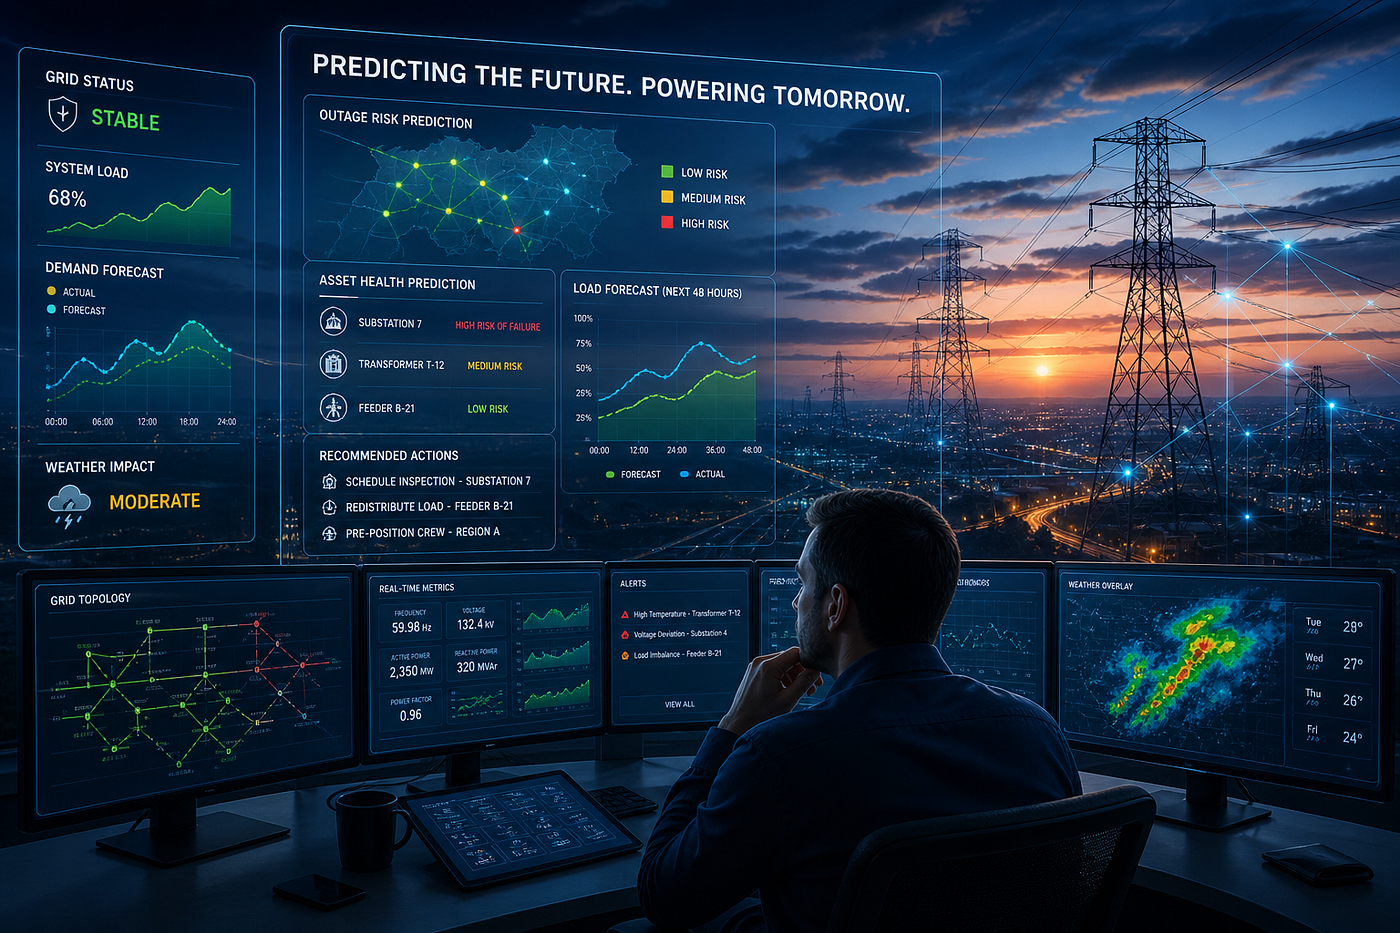
The Future of Grid Operations: Where Data Meets Foresight
The Future of Grid Operations: Where Data Meets Foresight
But before the technology can deliver on any of that promise, something has to come first.
And it is not a platform decision. It is an organizational one.
Data quality first.
A predictive model trained on inconsistent asset identifiers, unvalidated historian tags, or incomplete maintenance records will confidently tell you the wrong thing. In an environment where decisions have physical consequences, confidently wrong is worse than no answer at all.
Before you can ask what comes next, you have to trust what you have.
That means the unglamorous work. Reconciling asset IDs across PI, GIS, and your work management system. Cleaning the tag library. Establishing data ownership so someone is accountable when something looks off. None of that is technology. It is discipline.
Then the mindset shift.
Most utilities still treat data as a byproduct of operations — siloed by system, siloed by department, accessible only to whoever built the last query. That model leaves most of the value on the table.
The real shift is treating data as a shared organizational asset. Where an engineer in asset management can answer their own question without waiting weeks for an IT ticket. Where everyone works from the same trusted source.
That is what self-serve analytics on a governed Lakehouse actually looks like. Not just open access. Governed access. Unity Catalog handling lineage, ownership, and permissions so you can open the platform broadly without losing control of it.
One platform. One version of the truth. Everyone able to ask their own questions.
Get that foundation right, and what comes next gets very interesting.
Two Worlds, One Breakthrough
OT systems: Deterministic, precise. The richest operational dataset in any industry.
Lakehouse platforms: Built to ingest at scale, combine data from anywhere, and find patterns across years of history.
Individually, each is remarkable. Together, something shifts.
That historian data lands in the Lakehouse and suddenly it is not isolated anymore. It sits alongside weather records, GIS asset data, outage logs going back a decade. Each source alone tells you something limited. Together, they stop telling you what is happening and start telling you what these conditions have meant before, across thousands of assets, over years.
What Becomes Possible
With the foundation in place, here are three use cases worth exploring.
Predict failures before they happen
A transformer does not just fail. It fails after a slow accumulation sustained load, elevated temperature, deferred maintenance, aging insulation. Those conditions leave a signature in the data.
A model can be trained on years of fleet-wide history to learn that signature. When it sees the same combination forming on an asset right now, it surfaces it before any alarm fires, before any threshold is breached.
A maintenance visit gets scheduled. The transformer gets serviced. The failure that would have happened never does.
Storm response that starts before the storm
An incoming weather system is not just a forecast it is a query against everything you already know. Which feeders in its path have the highest historical outage rate under similar conditions? Which assets sit in high-vegetation-risk zones that GIS has flagged? Which are already showing load or temperature stress in the historian?
Cross-reference all of that, and before the first call comes in, you already know where the network is vulnerable. Crews get positioned. Vegetation-risk feeders get prioritized. You stop guessing and start preparing.
Repair or replace — with data, not gut feel
When maintenance history, outage frequency, asset age, and depreciation all live in the same platform, the decision stops being a judgment call. You can see which assets cost the most to maintain, which fail most often, and which capital investments reduce the most network risk over the next decade.
The Architecture That Makes It Real

OT/IT architecture with Databricks
A common pattern for this architecture typically includes three layers.
Getting data out of OT — safely
A lightweight agent sits in the IT Zone alongside the PI Data Archive. It makes an outbound-only HTTPS connection to AVEVA CONNECT in Azure. Nothing inbound ever touches the OT environment. No firewall exceptions into operations. Data flows one direction: out.
I know people will say connecting OT systems to data platforms is too risky and they are not wrong to ask the question. The architecture that works keeps it that way: data flows one direction out of OT into the Lakehouse, the analytics layer informs human decisions, and the OT systems keep full authority over the physical world.
Into the Lakehouse — without rebuilding everything
AVEVA CONNECT delivers data to Databricks via Delta Sharing an open protocol from a strategic AVEVA-Databricks partnership, live in production as of AVEVA World 2025.
Minimizing the need for custom ETL pipelines and data duplication. Databricks reads directly via short-lived, read-only tokens. The PI Asset Framework context travels with the data tag hierarchies, asset relationships, engineering units. What arrives is structured, contextually rich operational data already organized around your physical asset model.
“In practice, utilities often use a mix of approaches including batch pipelines, streaming ingestion, and custom integrations depending on latency requirements, existing systems, and organizational maturity.”
Organized so it can be trusted
Inside Databricks, the Medallion architecture does the work. Raw OT data lands in Bronze. Silver is where it gets cleaned and joined a transformer’s PI tag linked to its GIS record, maintenance history, and depreciation profile. Gold converges OT, Finance, and GIS into unified asset health scores and predictive models.
Unity Catalog provides lineage, access control, and audit trails across the whole platform. Governance baked in, not bolted on.
The Intelligence Was Always There
What is structurally hard for any human no matter how sharp is simultaneously holding ten years of fleet-wide failure signatures across thousands of assets in mind while managing a live grid. Identifying the twelve assets right now that share the same risk fingerprint as something that failed eighteen months ago, two hundred kilometres away.
That is not a gap in skill. That is the honest arithmetic of human attention versus the scale of the problem.
Machine learning across a Lakehouse does not have that constraint. It holds the entire historical pattern library and quietly compares it against what is happening right now, across every asset, all at once.
Not as an alarm that something is already wrong. As a signal that something might be — before it becomes an incident.
And every prevented incident feeds back into the model. Makes it sharper. The system keeps learning.
Utilities have spent decades building the infrastructure to collect this data. The sensors, the historians, the communication networks all of it accumulating signal for years.
The question was never whether there is enough data. There has always been extraordinary data.
The grid has been talking for years.
We finally have something that can listen.
And more importantly — something that can learn from it.
메타데이터
- post_id
- 0cb1908f9128
- slug
- when-ot-meets-it-what-happens-when-a-smart-grid-meets-a-lakehouse-0cb1908f9128
- url
- https://medium.com/@mansoor711/when-ot-meets-it-what-happens-when-a-smart-grid-meets-a-lakehouse-0cb1908f9128
- canonical_url
- https://medium.com/@mansoor711/when-ot-meets-it-what-happens-when-a-smart-grid-meets-a-lakehouse-0cb1908f9128
- author_url
- https://medium.com/@mansoor711
- status
- ok
- fetched_at
- 2026-06-22 17:31:34



