Valgrind: A Powerful Tool for Memory Debugging and Profiling
1. Introduction
Valgrind: A Powerful Tool for Memory Debugging and Profiling
1. Introduction
Ensuring your programs run correctly and efficiently in software development is just as crucial as writing the initial code. Bugs that hide deep within memory management — like leaks, overflows, or using uninitialized variables — can lead to unpredictable crashes, security vulnerabilities, and frustrating user experiences. This is where Valgrind comes into play: a powerful open-source suite of tools designed to help developers detect and resolve memory-related errors and performance issues in their code.
In essence, Valgrind is a dynamic analysis tool. Instead of examining your code statically (just by reading the source), it monitors the actual execution of your program, keeping a close eye on how memory is allocated, accessed, and freed. The flagship tool in the Valgrind suite, called Memcheck, is particularly adept at spotting subtle problems such as invalid memory reads/writes, memory leaks, and mismanagement of heap allocations. Furthermore, it includes profilers to analyze cache usage, track heap memory usage over time, and detect threading bugs in concurrent applications.
Memory debugging and profiling are crucial, especially in languages like C and C++, where developers manage manual memory. Unlike languages with automatic garbage collection, these languages put the burden of memory safety squarely on the developer’s shoulders. A small oversight can lead to vulnerabilities that attackers may exploit or reliability issues that are nearly impossible to reproduce.
2. What is Valgrind?
Valgrind is more than just a memory error detector. It’s a comprehensive suite of programming tools for dynamic analysis of binaries. First released in 2002, Valgrind quickly became an essential part of the developer’s toolkit, especially for those working with low-level languages. Its modular architecture allows developers to choose from tools, each targeting a different aspect of program analysis, from memory checking to profiling and concurrency error detection. Fundamentally, Valgrind works by simulating a CPU and memory system, running your program in an instrumented environment that can monitor, log, and analyze its behavior in real time.
The Valgrind suite includes several powerful tools designed for a specific purpose. The most widely used tool, Memcheck, checks every memory access in your program, detecting issues such as accessing freed memory, reading uninitialized values, and leaking memory allocations. Furthermore, for performance tuning, Valgrind offers Callgrind, which helps profile your application by gathering information about function calls and their computational costs, and Cachegrind, which analyzes cache usage to pinpoint inefficiencies. Moreover, tools like Massif provide insights into heap memory usage over time, helping developers optimize memory-hungry programs. Meanwhile, concurrency tools such as Helgrind and DRD focus on threading issues, identifying potential race conditions and deadlocks that can be notoriously difficult to track down.
Valgrind was initially developed for Linux and remains best supported on this platform. It works out of the box on most major Linux distributions. Also, it supports macOS, albeit with some limitations — especially with newer versions of the operating system or specific hardware architectures. Official support for Windows is absent, though there are experimental ports and alternative tools with similar capabilities. While Valgrind is designed with compiled languages like C and C++ in mind (where manual memory management and pointer arithmetic are common sources of bugs), it can sometimes be used with other languages, particularly when those languages rely on native extensions or libraries written in C or C++. However, Valgrind is generally not applicable for purely interpreted or managed languages.
Common use cases for Valgrind span the entire software development lifecycle. During development, programmers use it to catch bugs early, i.e., before they ship into production and become costly or dangerous. Furthermore, Valgrind is often part of the continuous integration pipeline in open-source projects, helping ensure code quality with every commit. Moreover, security researchers use Valgrind to find exploitable memory issues that could lead to vulnerabilities such as buffer overflows, use-after-free, or double-free errors.
3. Core Tools in the Valgrind Suite
Valgrind’s real strength lies in its modular architecture, which offers tools that target various aspects of program analysis. Each tool is tailored to a specific kind of bug or performance issue, allowing developers to mix and match their approach based on the needs of their project.
The core of the Valgrind suite is Memcheck, a memory error detector that has become an industry standard for catching elusive bugs in C and C++ programs. In particular, Memcheck tracks every memory allocation, deallocation, and access in your application. It finds issues such as reading or writing beyond the boundaries of allocated memory (buffer overflows), accessing memory that has already been freed (use-after-free), and memory leaks caused by forgotten allocations. Furthermore, it can identify the use of uninitialized values, which can lead to subtle and unpredictable bugs. Memcheck achieves this by running your program in a virtual environment where every memory operation is monitored and checked for correctness. Therefore, the result is a detailed report that pinpoints the source of memory errors.
Another essential tool is Callgrind, which focuses on profiling your program’s execution to help understand where time and resources are being spent. Callgrind collects detailed statistics about function calls, including call counts and the computational cost of each function. This information is essential when optimizing your code, as it highlights performance bottlenecks and shows which routines dominate execution time. Also, Callgrind integrates with visualization tools like KCachegrind, which can present the collected data as call graphs and annotated source code. This visual approach makes it much easier to navigate large and complex codebases when trying to improve efficiency.
For developers concerned with memory usage, Massif is the tool of choice. Massif is a heap profiler that tracks memory allocations over time, helping you see how your program’s memory footprint changes as it runs. Unlike Memcheck, which is primarily about correctness, Massif is about optimization. It can help you identify the largest consumers of heap memory and pinpoint where optimizations will have the most significant impact. The output from Massif can be visualized with tools like ms_print, which creates easy-to-read graphs showing memory usage trends. Therefore, this can be particularly useful for applications that need to run on resource-constrained systems, or for tracking down memory spikes and leaks that appear only after long periods of use.
In addition, multithreaded programs present a new set of challenges, particularly regarding synchronization and shared data. This is where Helgrind comes into play. Helgrind is designed to detect synchronization errors such as data races, which occur when two threads access the same memory location concurrently and at least one of them writes to it. Data races can lead to subtle, hard-to-reproduce bugs that may only appear under certain timing conditions.
Valgrind also includes several other specialized tools. For example, Cachegrind is another profiler that provides detailed analysis of CPU cache usage, helping you understand how well your code interacts with the processor’s cache and where you might be experiencing cache misses. In addition, DRD is a race condition detector similar to Helgrind, but with a different approach to analyzing thread interactions.
4. Practical Examples
The real power of Valgrind becomes clear when you see it in action on real-world code. Let’s walk through a simple C program that contains a couple of common memory errors. By analyzing the program’s behavior with and without Valgrind, you’ll see how easy it is to identify and fix these issues using the tool’s detailed reports.
Consider the following C code, which intentionally includes a memory leak and an invalid memory access:
#include <stdio.h>
#include <stdlib.h>

int main() {
    int *array = malloc(5 * sizeof(int));
    array[5] = 10;  // Oops! Out-of-bounds write
    // Missing: free(array);  // Memory leak
    return 0;
}
If you compile and run this program as-is, you may not see any immediate errors or warnings, depending on your system and compiler settings. The out-of-bounds write (array[5] = 10;) might not cause a crash, but it writes beyond your allocated memory (since valid indices are 0 to 4). The missing free(array); means that the memory you requested with malloc is never returned to the system, resulting in a memory leak.
Now, let’s run this binary through Valgrind with Memcheck. Suppose you compiled the code into an executable called example. Open a terminal and run:
gcc valgrind_ex.c -o valgrind_ex
valgrind --leak-check=full --track-origins=yes ./valgrind_ex
can@can-VMware-Virtual-Platform:~/vulnerability_research$ valgrind --leak-check=full --track-origins=yes ./valgrind_ex
==5211== Memcheck, a memory error detector
==5211== Copyright (C) 2002-2022, and GNU GPL'd, by Julian Seward et al.
==5211== Using Valgrind-3.22.0 and LibVEX; rerun with -h for copyright info
==5211== Command: ./valgrind_ex
==5211==
==5211== Invalid write of size 4
==5211== at 0x10916B: main (in /home/can/vulnerability_research/valgrind_ex)
==5211== Address 0x4a7f054 is 0 bytes after a block of size 20 alloc'd
==5211== at 0x4846828: malloc (in /usr/libexec/valgrind/vgpreload_memcheck-amd64-linux.so)
==5211== by 0x10915E: main (in /home/can/vulnerability_research/valgrind_ex)
==5211==
==5211==
==5211== HEAP SUMMARY:
==5211== in use at exit: 20 bytes in 1 blocks
==5211== total heap usage: 1 allocs, 0 frees, 20 bytes allocated
==5211==
==5211== 20 bytes in 1 blocks are definitely lost in loss record 1 of 1
==5211== at 0x4846828: malloc (in /usr/libexec/valgrind/vgpreload_memcheck-amd64-linux.so)
==5211== by 0x10915E: main (in /home/can/vulnerability_research/valgrind_ex)
==5211==
==5211== LEAK SUMMARY:
==5211== definitely lost: 20 bytes in 1 blocks
==5211== indirectly lost: 0 bytes in 0 blocks
==5211== possibly lost: 0 bytes in 0 blocks
==5211== still reachable: 0 bytes in 0 blocks
==5211== suppressed: 0 bytes in 0 blocks
==5211==
==5211== For lists of detected and suppressed errors, rerun with: -s
==5211== ERROR SUMMARY: 2 errors from 2 contexts (suppressed: 0 from 0)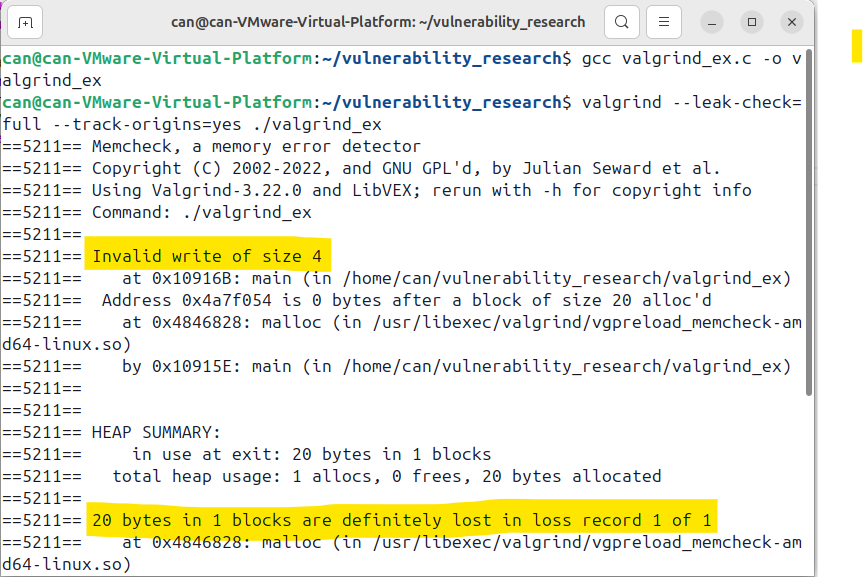
Valgrind has flagged two key issues. First, it reports an “Invalid write of size 4,” highlighting that the program is writing just past the end of the allocated block. This is a classic off-by-one error that could lead to data corruption or segmentation faults in more complex programs. Second, Valgrind’s heap summary notes that “20 bytes in 1 block are definitely lost,” indicating a memory leak.
After making changes and recompiling, running the program through Valgrind again should result in a clean report, with no errors or memory leaks detected. This process demonstrates the practical value of Valgrind: it provides immediate, actionable feedback that guides you directly to hidden bugs, making your code safer and more reliable.
5. Using Other Valgrind Tools
While Memcheck is Valgrind’s most well-known tool, the suite offers several other powerful utilities designed to tackle different aspects of program analysis. By leveraging these specialized tools, developers can gain insight into performance, memory usage, and threading behavior.
One of the most valuable tools for performance optimization is Callgrind. It is an essential tool for profiling program execution and understanding which parts of your code consume the most computational resources. Let’s walk through a practical example using a simple C program that performs some mathematical calculations.
// fib.c
#include <stdio.h>

int fib(int n) {
    if (n <= 1)
        return n;
    return fib(n - 1) + fib(n - 2);
}

int main() {
    int n = 20;
    printf("fib(%d) = %d\n", n, fib(n));
    return 0;
}
This program recursively computes the 20th Fibonacci number, a classic example with easily measurable performance bottlenecks due to its exponential time complexity.
Step 1: Compile with Debug Information
For the most useful profiling results, compile the program with debugging symbols and without optimizations:
gcc -g -O0 fib.c -o fibStep 2: Run the Program with Callgrind
Now, use Valgrind’s Callgrind tool to collect profiling data:
valgrind --tool=callgrind ./fibcan@can-VMware-Virtual-Platform:~/vulnerability_research$ valgrind --tool=callgrind ./fib
==5979== Callgrind, a call-graph generating cache profiler
==5979== Copyright (C) 2002-2017, and GNU GPL'd, by Josef Weidendorfer et al.
==5979== Using Valgrind-3.22.0 and LibVEX; rerun with -h for copyright info
==5979== Command: ./fib
==5979==
==5979== For interactive control, run 'callgrind_control -h'.
fib(20) = 6765
==5979==
==5979== Events : Ir
==5979== Collected : 520838
==5979==
==5979== I refs: 520,838The output file (callgrind.out.<pid>) contains detailed information about every function call and instruction executed.
Step 3: Interpreting Callgrind Output
You can review the results with the callgrind_annotate tool for a quick summary:
callgrind_annotate callgrind.out.<pid>can@can-VMware-Virtual-Platform:~/vulnerability_research$ callgrind_annotate callgrind.out.5979
--------------------------------------------------------------------------------
Profile data file 'callgrind.out.5979' (creator: callgrind-3.22.0)
--------------------------------------------------------------------------------
I1 cache:
D1 cache:
LL cache:
Timerange: Basic block 0 - 109257
Trigger: Program termination
Profiled target: ./fib (PID 5979, part 1)
Events recorded: Ir
Events shown: Ir
Event sort order: Ir
Thresholds: 99
Include dirs:
User annotated:
Auto-annotation: on
--------------------------------------------------------------------------------
Ir
--------------------------------------------------------------------------------
520,838 (100.0%) PROGRAM TOTALS
--------------------------------------------------------------------------------
Ir file:function
--------------------------------------------------------------------------------
372,122 (71.45%) fib.c:fib'2 [/home/can/vulnerability_research/fib]

Step 4: Visualizing with KCachegrind
For a more visual and interactive analysis, use KCachegrind (Linux) or QCachegrind (cross-platform):
kcachegrind callgrind.out.<pid>
KCachegrind displays call graphs, source code annotations, and function cost summaries. You’ll see visually that the fib function is called recursively many times, and it dominates the program’s resource usage. This demonstrates that the recursive implementation is inefficient for large inputs—a classic insight that leads developers to consider memoization or iterative approaches.
Massif is Valgrind’s heap profiler. It tracks your program’s heap memory usage over time, helping you spot unexpected memory growth, leaks, or inefficient usage. Let’s go through a practical example.
This program allocates memory for several arrays and holds some references while freeing others:
#include <stdio.h>
#include <stdlib.h>

#define ARRAY_SIZE 100000

int main() {
    int *a = malloc(ARRAY_SIZE * sizeof(int));
    int *b = malloc(ARRAY_SIZE * sizeof(int));
    int *c = malloc(ARRAY_SIZE * sizeof(int));

    // Use the arrays a, b, and c
    for (int i = 0; i < ARRAY_SIZE; ++i) {
        a[i] = i;
        b[i] = i * 2;
        c[i] = i * 3;
    }

    free(b); // Only b is freed early

    // Simulate long-running computation
    for (int i = 0; i < 10000000; ++i) {
        a[0]++;
        c[0]++;
    }

    // Forget to free a and c (memory leak)
    return 0;
}
Step 1: Compile with Debug Info
gcc -g -O0 massif_example.c -o massif_exampleStep 2: Run the Program with Massif
valgrind --tool=massif ./massif_exampleThis will generate an output file named massif.out.<pid> (where <pid> is the process ID).
Step 3: Analyze the Massif Output
To view the memory usage over time in a readable format, use:
ms_print massif.out.<pid>The output is given below.
can@can-VMware-Virtual-Platform:~/vulnerability_research$ ms_print massif.out.7319
--------------------------------------------------------------------------------
Command:            ./massif_example
Massif arguments:   (none)
ms_print arguments: massif.out.7319
--------------------------------------------------------------------------------

    MB
1.144^   ::::::::::::::::::::::::::::::::::::::::::::::::::::::::::::::::::::#
     |   :                                                                   #
     |   :                                                                   #
     |   :                                                                   #
     |   :                                                                   #
     |   :                                                                   #
     |   :                                                                   #
     |   :                                                                   #
     |   :                                                                   #
     |   :                                                                   #
     |   :                                                                   #
     |   :                                                                   #
     |   :                                                                   #
     |   :                                                                   #
     |   :                                                                   #
     |   :                                                                   #
     |   :                                                                   #
     |   :                                                                   #
     |   :                                                                   #
     |   :                                                                   #
   0 +----------------------------------------------------------------------->Mi
     0                                                                   2.820

Number of snapshots: 6
 Detailed snapshots: [4 (peak)]

--------------------------------------------------------------------------------
  n        time(i)         total(B)   useful-heap(B) extra-heap(B)    stacks(B)
--------------------------------------------------------------------------------
  0              0                0                0             0            0
  1        157,246          400,008          400,000             8            0
  2        157,284          800,016          800,000            16            0
  3        157,322        1,200,024        1,200,000            24            0
  4      2,957,364        1,200,024        1,200,000            24            0
100.00% (1,200,000B) (heap allocation functions) malloc/new/new[], --alloc-fns, etc.
->33.33% (400,000B) 0x10917E: main (massif_example.c:7)
|
->33.33% (400,000B) 0x10918C: main (massif_example.c:8)
|
->33.33% (400,000B) 0x10919A: main (massif_example.c:9)

--------------------------------------------------------------------------------
  n        time(i)         total(B)   useful-heap(B) extra-heap(B)    stacks(B)
--------------------------------------------------------------------------------
  5      2,957,364          800,016          800,000            16            0
Helgrind is Valgrind’s tool for detecting data races and synchronization errors in multithreaded C and C++ programs. Data races can be subtle and hard to spot, but often lead to unpredictable behavior, crashes, and difficult-to-reproduce bugs. Helgrind analyzes how threads access shared data and helps you ensure that all shared accesses are correctly synchronized.
Sample C Program: Unsynchronized Counter
#include <stdio.h>
#include <pthread.h>

#define NUM_ITER 100000

int counter = 0;

void* increment(void* arg) {
    for (int i = 0; i < NUM_ITER; ++i) {
        counter++;
    }
    return NULL;
}

int main() {
    pthread_t t1, t2;

    pthread_create(&t1, NULL, increment, NULL);
    pthread_create(&t2, NULL, increment, NULL);

    pthread_join(t1, NULL);
    pthread_join(t2, NULL);

    printf("Final counter value: %d\n", counter);
    return 0;
}
This program creates two threads that increment a global counter without proper synchronization — a classic scenario for a data race:
This code intentionally omits any synchronization mechanism (like a mutex) to highlight the kind of bug Helgrind can detect.
Step 1: Compile with Debug Info
gcc -g -O0 -pthread helgrind_example.c -o helgrind_exampleStep 2: Run the Program with Helgrind
valgrind --tool=helgrind ./helgrind_exampleStep 3: Example Helgrind Output and Interpretation
can@can-VMware-Virtual-Platform:~/vulnerability_research$ valgrind --tool=helgrind ./helgrind_example
==7721== Helgrind, a thread error detector
==7721== Copyright (C) 2007-2017, and GNU GPL'd, by OpenWorks LLP et al.
==7721== Using Valgrind-3.22.0 and LibVEX; rerun with -h for copyright info
==7721== Command: ./helgrind_example
==7721==
==7721== ---Thread-Announcement------------------------------------------
==7721==
==7721== Thread #3 was created
==7721==    at 0x499DA23: clone (clone.S:76)
==7721==    by 0x499DBA2: __clone_internal_fallback (clone-internal.c:64)
==7721==    by 0x499DBA2: __clone_internal (clone-internal.c:109)
==7721==    by 0x491054F: create_thread (pthread_create.c:297)
==7721==    by 0x49111A4: pthread_create@@GLIBC_2.34 (pthread_create.c:836)
==7721==    by 0x4854975: ??? (in /usr/libexec/valgrind/vgpreload_helgrind-amd64-linux.so)
==7721==    by 0x109235: main (helgrind_example.c:19)
==7721==
==7721== ---Thread-Announcement------------------------------------------
==7721==
==7721== Thread #2 was created
==7721==    at 0x499DA23: clone (clone.S:76)
==7721==    by 0x499DBA2: __clone_internal_fallback (clone-internal.c:64)
==7721==    by 0x499DBA2: __clone_internal (clone-internal.c:109)
==7721==    by 0x491054F: create_thread (pthread_create.c:297)
==7721==    by 0x49111A4: pthread_create@@GLIBC_2.34 (pthread_create.c:836)
==7721==    by 0x4854975: ??? (in /usr/libexec/valgrind/vgpreload_helgrind-amd64-linux.so)
==7721==    by 0x109218: main (helgrind_example.c:18)
==7721==
==7721== ----------------------------------------------------------------
==7721==
==7721== Possible data race during read of size 4 at 0x10C014 by thread #3
==7721== Locks held: none
==7721==    at 0x1091BE: increment (helgrind_example.c:10)
==7721==    by 0x4854B7A: ??? (in /usr/libexec/valgrind/vgpreload_helgrind-amd64-linux.so)
==7721==    by 0x4910AA3: start_thread (pthread_create.c:447)
==7721==    by 0x499DA33: clone (clone.S:100)
==7721==
==7721== This conflicts with a previous write of size 4 by thread #2
==7721== Locks held: none
==7721==    at 0x1091C7: increment (helgrind_example.c:10)
==7721==    by 0x4854B7A: ??? (in /usr/libexec/valgrind/vgpreload_helgrind-amd64-linux.so)
==7721==    by 0x4910AA3: start_thread (pthread_create.c:447)
==7721==    by 0x499DA33: clone (clone.S:100)
==7721==  Address 0x10c014 is 0 bytes inside data symbol "counter"
==7721==
==7721== ----------------------------------------------------------------
==7721==
==7721== Possible data race during write of size 4 at 0x10C014 by thread #3
==7721== Locks held: none
==7721==    at 0x1091C7: increment (helgrind_example.c:10)
==7721==    by 0x4854B7A: ??? (in /usr/libexec/valgrind/vgpreload_helgrind-amd64-linux.so)
==7721==    by 0x4910AA3: start_thread (pthread_create.c:447)
==7721==    by 0x499DA33: clone (clone.S:100)
==7721==
==7721== This conflicts with a previous write of size 4 by thread #2
==7721== Locks held: none
==7721==    at 0x1091C7: increment (helgrind_example.c:10)
==7721==    by 0x4854B7A: ??? (in /usr/libexec/valgrind/vgpreload_helgrind-amd64-linux.so)
==7721==    by 0x4910AA3: start_thread (pthread_create.c:447)
==7721==    by 0x499DA33: clone (clone.S:100)
==7721==  Address 0x10c014 is 0 bytes inside data symbol "counter"
==7721==
Final counter value: 200000
==7721==
==7721== Use --history-level=approx or =none to gain increased speed, at
==7721== the cost of reduced accuracy of conflicting-access information
==7721== For lists of detected and suppressed errors, rerun with: -s
==7721== ERROR SUMMARY: 2 errors from 2 contexts (suppressed: 1 from 1)
What does this mean?
- “Possible data race during write of size 4 at 0x10C014 by thread #3”:
Helgrind detected that two threads are writing to the exact memory location (
counter) at the same time, without synchronization. - Code references:
It points directly to line 10 in your code (
counter++;inincrement), and also gives you the thread information. - Conflicting access: It notes this write “conflicts with a previous write” by the other thread — classic signature of a data race.
Step 4: How to Fix
To resolve the race condition, add a pthread_mutex_t and lock/unlock it during the critical section:
#include <stdio.h>
#include <pthread.h>

#define NUM_ITER 100000

int counter = 0;
pthread_mutex_t lock;

void* increment(void* arg) {
    for (int i = 0; i < NUM_ITER; ++i) {
        pthread_mutex_lock(&lock);
        counter++;
        pthread_mutex_unlock(&lock);
    }
    return NULL;
}

int main() {
    pthread_t t1, t2;
    pthread_mutex_init(&lock, NULL);

    pthread_create(&t1, NULL, increment, NULL);
    pthread_create(&t2, NULL, increment, NULL);

    pthread_join(t1, NULL);
    pthread_join(t2, NULL);

    printf("Final counter value: %d\n", counter);
    pthread_mutex_destroy(&lock);
    return 0;
}
can@can-VMware-Virtual-Platform:~/vulnerability_research$ valgrind --tool=helgrind ./helgrind_example_no_vulnc
==7856== Helgrind, a thread error detector
==7856== Copyright (C) 2007-2017, and GNU GPL'd, by OpenWorks LLP et al.
==7856== Using Valgrind-3.22.0 and LibVEX; rerun with -h for copyright info
==7856== Command: ./helgrind_example_no_vulnc
==7856==
Final counter value: 200000
==7856==
==7856== Use --history-level=approx or =none to gain increased speed, at
==7856== the cost of reduced accuracy of conflicting-access information
==7856== For lists of detected and suppressed errors, rerun with: -s
==7856== ERROR SUMMARY: 0 errors from 0 contexts (suppressed: 167123 from 8)Thanks for reading,
Can
메타데이터
- post_id
- 0ce39f8b73fd
- slug
- valgrind-a-powerful-tool-for-memory-debugging-and-profiling-0ce39f8b73fd
- url
- https://medium.com/@can-ozkan/valgrind-a-powerful-tool-for-memory-debugging-and-profiling-0ce39f8b73fd
- canonical_url
- https://medium.com/@can-ozkan/valgrind-a-powerful-tool-for-memory-debugging-and-profiling-0ce39f8b73fd
- author_url
- https://medium.com/@can-ozkan
- status
- ok
- fetched_at
- 2026-08-12 23:53:48