Integrating SQL and Python for Data Analysis and Visualization: A Project-Based Guide
Integrating SQL and Python for Data Analysis and Visualization: A Project-Based Guide
Introduction:
In today’s world, terms like data, data science, and AI have become household names. This isn’t just a passing trend — these technologies genuinely have the potential to transform the world and the way we live. Numerous reports and articles suggest that fields like Data Science and Artificial Intelligence are expected to grow significantly in the coming years. As a result, the demand for roles such as data analysts, data scientists, machine learning engineers, data engineers, and other data-related positions has increased tremendously.
Across these roles, a few essential skills and technologies are fundamental: Python, SQL, and key Python libraries like pandas, matplotlib, numpy, and seaborn. In this post, we’ll explore these core skills through simple explanations. I’ll explain these topics using a project I recently completed, presenting each concept in both an abstract and practical way.
To make it easier to follow along, I’ll share screenshots from my Jupyter Notebook, breaking down each cell of code and explaining the output step by step. Additionally, I’ll include a link to the full project on my GitHub page, so you can explore it in more detail.
Let’s dive in!
The following are the topics we are going to delve into in this post,
- What is Database
- What is SQL
- What is a Jupyter Notebook
- Connecting Jupyter Notebook with SQL
- Importing all the Necessary Libraries
- Connection Object
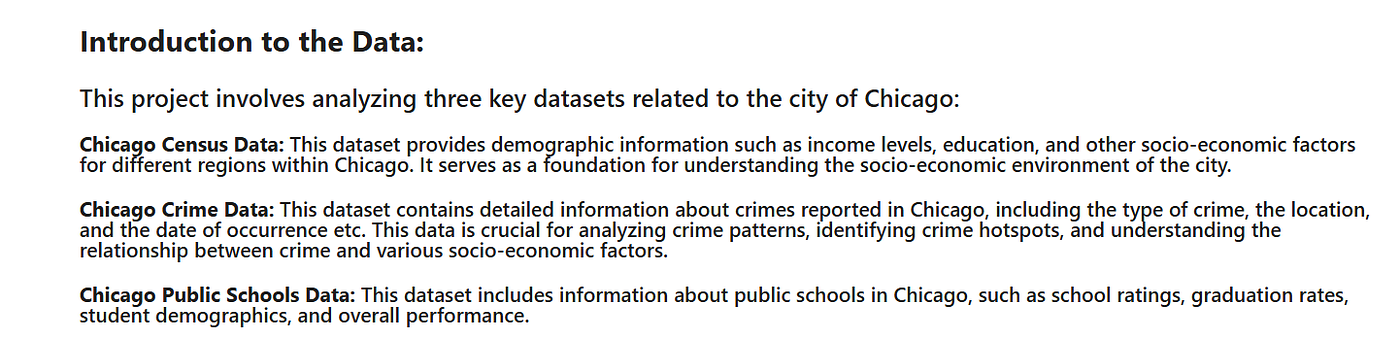
- Introduction to the Data
- Objectives of this Project
- Loading the Data
- Solving Problems using SQL
- Data Visualization
- Conclusions and Suggestions
… Let’s get started!
What is a Database?
As the name suggests, data science revolves around data — any form of information. Data is fundamental to all emerging fields. To gain insights from data, we often deal with massive datasets, sometimes reaching millions or even billions of rows. This brings up an important question: Where is all this data stored? The answer is “Databases”.
In simple terms, a database is a place where data is stored. However, databases don’t just store data — they also have other crucial functions such as:
- Retrieving Data: Accessing specific data when needed.
- Filtering Data: Sorting or filtering data to find the exact information required.
- Managing Data: Organizing, updating, and maintaining data efficiently.
Data can exist in two forms: “structured” and “unstructured”.
- Structured data is organized into rows and columns, like a table. Each column represents a unique attribute (e.g., name, sport, height, weight), and each row represents a different entry (e.g., an athlete). Although structured data is somewhat organized, it often requires cleaning before use — removing irrelevant, duplicate, or null values. This process is known as “Data Cleaning”.
- Unstructured data, on the other hand, doesn’t follow a predefined format. It can include text files, images, videos, emails, social media posts etc. This type of data is typically more complex to handle.
In this post, we’ll focus on structured data, leaving unstructured data for a future discussion.
What is SQL?
To communicate with databases that store structured data, we use a language called “SQL (Structured Query Language)”. SQL isn’t a typical programming language — it’s designed specifically for interacting with databases. It is simple yet powerful, and it’s an essential tool for anyone dealing with data.
SQL allows you to:
- Define data structures (tables, columns, etc).
- Insert, update, or delete data.
- Query data to retrieve specific information.
SQL is only applicable to structured data and is categorized into three main subgroups:
- Data Definition Language (DDL): For defining and modifying the structure of the database (creating tables, altering schemas).
- Data Manipulation Language (DML): For adding, updating, or deleting data.
- Data Querying Language (DQL): For querying and retrieving data.
What is a Jupyter Notebook?
A Jupyter Notebook is an open-source, web-based tool where you can write and run code in small chunks. Its like a digital notebook that mixes code, explanations, and results together. It’s widely used in data science, machine learning, and scientific research. Its in a cell format meaning there will be cells and in each cell we can write and test our code and the output is shown right below the cell. It is primarily used for python, but it also supports other programming languages like R, Julia, Java, C, Scala and Fortran.
Jupyter Notebooks can include: —
- Code cells: Where you can write and execute code (commonly Python, though other languages are supported).
- Markdown cells: For adding explanations and documentation.
- Output cells: To display results of code execution, such as numbers, plots, or tables.
- Interactive visualizations: Easily integrates with libraries like Matplotlib, Seaborn, and Plotly to visualize data in real-time.
Since we can execute the code step-by-step, it makes it useful for testing, debugging, and documenting your process. Jupyter Notebooks can be saved, shared, and reused, making them great for collaborative work, tutorials, and reproducible research.
Connecting Jupyter Notebook with SQL
While SQL is generally used in environments like MySQL, PostgreSQL, Oracle, etc., it can also be used in Jupyter Notebook with Python. To do this, we need to connect our notebook to an SQL database. Once connected, we can query the database using either a connection cursor object or Magic SQL. Here, we will focus on using Magic SQL.
- Magic SQL: It enables us to directly write SQL queries in Jupyter Notebook cells and get the results instantly.
To set this up, we need the ipython-sql library:
- ipython-sql: This library connects Jupyter Notebook to an SQL database and enables us to use Magic SQL commands (
**%sqland `%%sql`**) to query SQL statements directly from the notebook.
Here are the steps:
- Install the ipython-sql library into your environment if it’s not already installed.
- Load the Magic SQL extension into the notebook.
- Connect to a database.
These steps are demonstrated in the screenshot below:
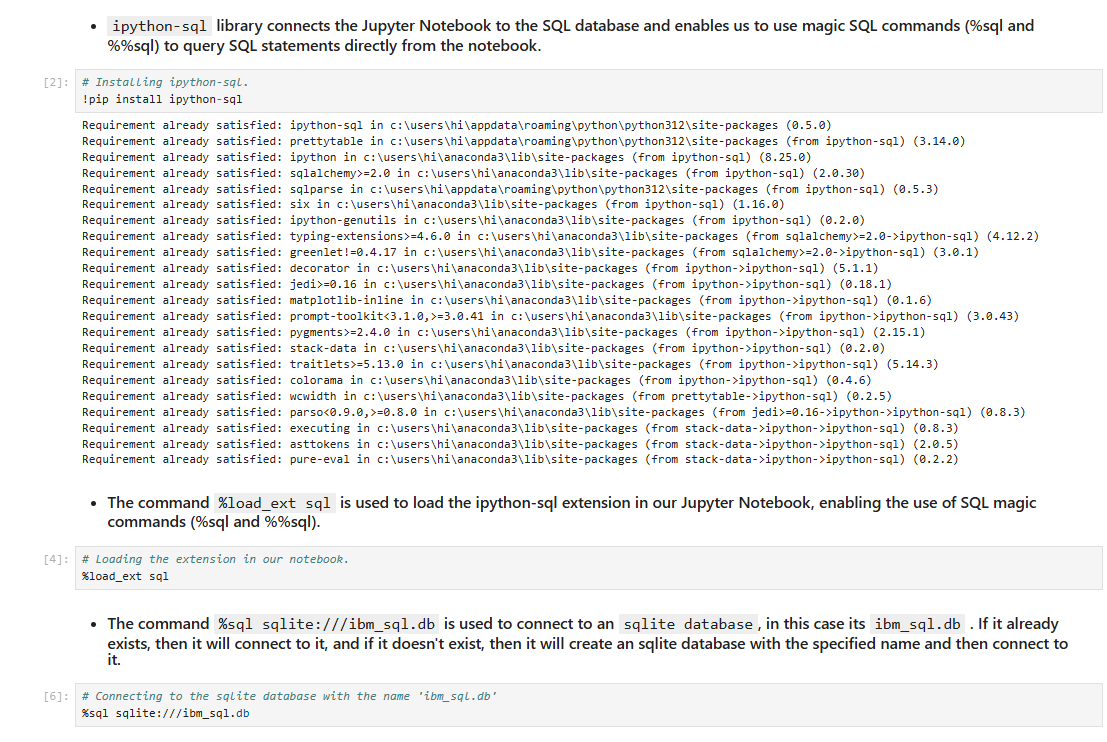
Here SQLite is the actual database engine, a lightweight, serverless relational database.
If the database we specify already exists, Jupyter Notebook will connect to it. If it doesn’t exist, a new database will be created with the specified name, and the connection will be established to the newly created database.
Importing all the Necessary Libraries
Now as our notebook is connected to a sqlite database, to continue furthur, we have to import all the necessary libraries for this project : Pandas, Matplotlib, Seaborn and sqlite3.
- Pandas: A powerful Python library for data manipulation and analysis. It provides data structures like DataFrames, making it easy to clean, filter, and manipulate large datasets. Pandas is also used to load data into the notebook from various file formats, such as CSV, Excel, JSON, and SQL databases.
- Matplotlib: A widely used Python library for creating static, animated, and interactive visualizations. It allows you to create plots like line charts, bar charts, histograms, etc.
- Seaborn: Built on top of Matplotlib, Seaborn is a Python library that simplifies creating attractive and informative statistical visualizations like heatmaps, pair plots, and box plots.
- sqlite3: This is used to connect to and interact with SQLite databases in Python, allowing you to create, read, update, and delete data stored in SQLite databases directly from your code.
Importing the necessary libraries is demonstrated in the screenshot below:

Connection Object
Now, we will create a connection object using sqlite3. In simple terms, a connection object is a variable that represents the connection between the notebook and the SQLite database. When the connection object is used, it indicates that we are interacting with this specific database. We will use this connection object to load data into the database.
The following screenshot demonstrates how to create a connection using sqlite3:

Here, we are connecting to the ibm_sql.db database that we created earlier.
Introduction to the Data
Objectives of this Project

Loading the Data
Now, we will load data from a CSV file using pandas.

Now as we have the data in a dataframe we will insert it into the database using pandas and the connection object.

Here,
- if_exists = ‘replace’ : This parameter means that if a table with the specified name already exists in the database, it will be replaced with the new one.
- index = ‘false’ : This parameter ensures that the index of the DataFrame is not added as a separate column in the database table.
- method = ‘multi’ : This parameter allows the data to be inserted all at once, rather than row by row. This is more efficient in terms of time and resources.
I’ve loaded two other csv files in the same way,

Solving Problems Using SQL
Finally, we have everything set up. The data has been successfully loaded into the database. Now, we can explore, clean, and analyze the data. In this case, I’ll use SQL to understand the data and extract some insights.
I’ve solved 10 problems using Magic SQL in this notebook. Below, I’ll show a few of them.


Data Visualization
Now, let’s create some cool data visualizations to better understand the data. We’ll use Matplotlib and Seaborn to plot the data based on our objectives. The screenshots below will display the objective, the code, the output plot, and our findings from the visualization.


Here is the conclusion about the census data,

After all the analysis and visualizations, here are the final conclusions and suggestions,


In conclusion, we’ve learned how to use SQL, Python, and libraries like Pandas and Matplotlib for data analysis and visualization. I hope you found this guide helpful!
The possibilities with data analysis are endless. I encourage you to apply what you’ve learned to your own projects, and feel free to reach out if you’d like to discuss more.
Thank you for reading! If you have any suggestions or would like to explore these concepts further, don’t hesitate to get in touch. Happy coding!
Stay tuned for more posts, and feel free to connect with me on LinkedIn.
메타데이터
- post_id
- 0dca0dbc0c58
- slug
- integrating-sql-and-python-for-data-analysis-and-visualization-a-project-based-guide-0dca0dbc0c58
- url
- https://medium.com/@saaisujith007/integrating-sql-and-python-for-data-analysis-and-visualization-a-project-based-guide-0dca0dbc0c58
- canonical_url
- https://medium.com/@saaisujith007/integrating-sql-and-python-for-data-analysis-and-visualization-a-project-based-guide-0dca0dbc0c58
- author_url
- https://medium.com/@saaisujith007
- status
- ok
- fetched_at
- 2026-06-26 06:47:43