ColdFusion JVM Tuning: How Much RAM to Allocate and Which G1GC Flags Actually Work
ColdFusion’s jvm.config still ships with -XX:+UseParallelGC as the default garbage collector — not G1GC — even on ColdFusion 2025 running…
ColdFusion JVM Tuning: How Much RAM to Allocate and Which G1GC Flags Actually Work
ColdFusion’s
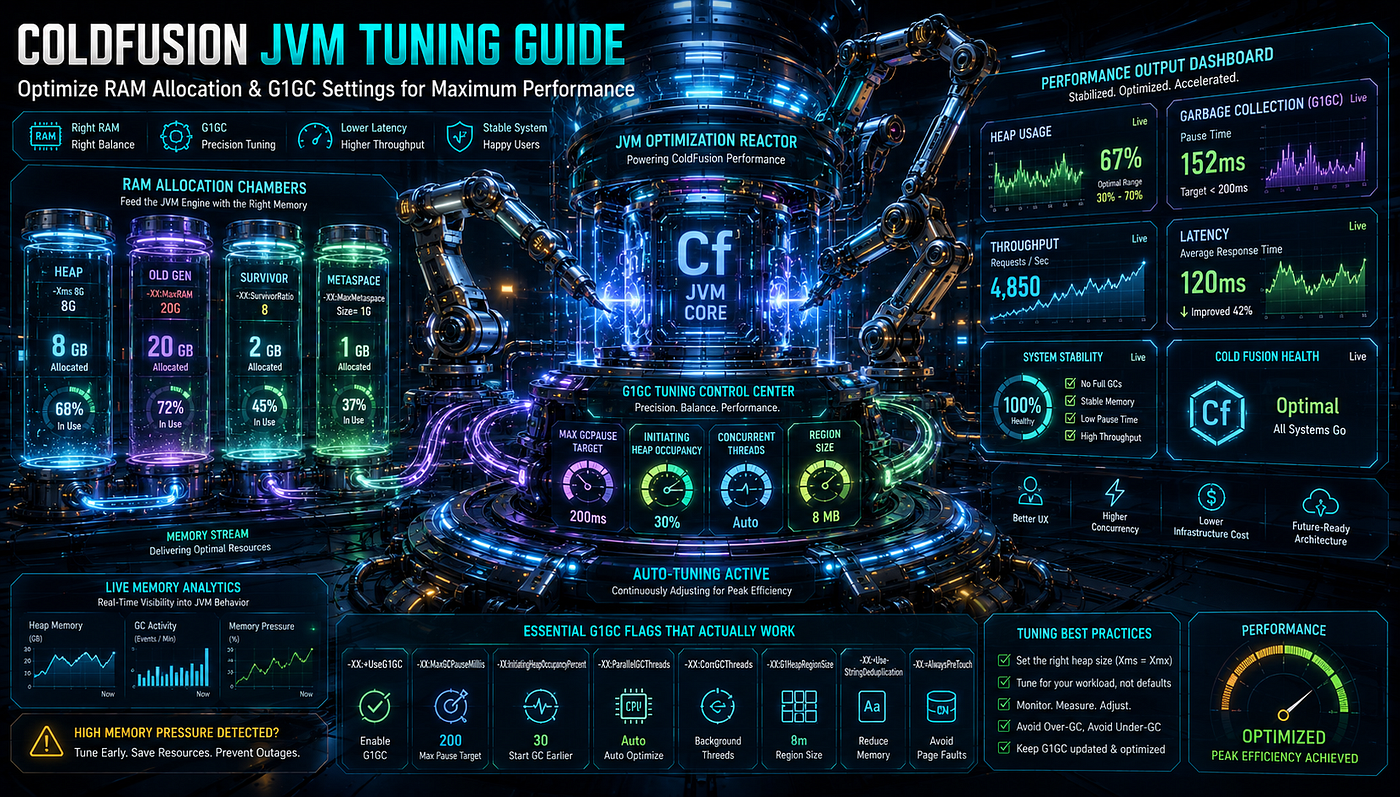
jvm.configstill ships with-XX:+UseParallelGCas the default garbage collector — not G1GC — even on ColdFusion 2025 running JDK 21 LTS. This is verified across multiple Adobe and community sources. If you don't explicitly change it, your CF server is using the throughput-optimized Parallel collector, not the low-pause G1 collector that most modern Java tuning guides assume. For heap sizing: per cfguide.io's CF 2025 documentation, allocate 50-70% of system RAM for the JVM heap, with 4-8GB as a starting point for production that you adjust based on actual usage. Set-Xmsequal to-Xmxto avoid resize churn. For G1GC: switch is justified when heap is larger than ~6GB or pause-time minimization matters more than throughput (per Charlie Arehart's published guidance). The flags that actually work in JDK 21 are-XX:+UseG1GC -XX:MaxGCPauseMillis=200 -XX:+UseStringDeduplicationplus thread tuning. Flags to remove if present:-XX:+AggressiveOpts(removed in JDK 12),-XX:+UseConcMarkSweepGC(removed in JDK 14),-XX:PermSize/-XX:MaxPermSize(replaced by Metaspace in Java 8),-XX:+UseCompressedOops(default in JDK 7+, no need to specify). For very large heaps in JDK 21: Generational ZGC (-XX:+UseZGC -XX:+ZGenerational) is now production-ready and may outperform G1GC on heaps over 32GB.
ColdFusion JVM Tuning: How Much RAM to Allocate and Which G1GC Flags Actually Work
The Two Questions Everyone Gets Wrong
Two questions dominate every ColdFusion performance tuning conversation:
- “How much RAM should I give the JVM?”
- “Which garbage collector should I use, and which flags do I need?”
Both questions have nuanced answers that depend on workload characteristics. Both questions get incorrect answers — repeatedly, in production — that lead to either out-of-memory crashes, multi-second GC pauses that users feel as application freezes, or wasted infrastructure spend on heap that never gets used.
This post answers both questions with verified, current (May 2026) recommendations specifically for ColdFusion running on JDK 17 (CF 2023) or JDK 21 (CF 2025). Everything below is sourced from Adobe’s published documentation, Charlie Arehart’s writings, the cfguide.io technical documentation, the foojay/InfoQ Java performance community, and verified GC algorithm specifications.
There are no benchmarks unique to this post. Every number that appears is either a documented default, an explicitly-cited recommendation from a primary source, or a clearly-flagged estimate with the reasoning shown. If you’ve read CFML tuning guides from 2014 that recommend -XX:+AggressiveOpts and CMS GC, this post replaces that guidance with what actually applies to JDK 17 and JDK 21 in 2026.
The Most Important Single Fact: ColdFusion Doesn’t Default to G1GC
Most modern Java tuning material assumes G1GC is the default garbage collector. Java 9 onwards uses G1GC as the JVM default when no GC flag is specified. So the assumption is reasonable — for plain Java applications.
It is wrong for ColdFusion.
Per Charlie Arehart’s authoritative coverage at coldfusion.adobe.com (his "Hidden Gems in CF2018" post from January 2019), the ColdFusion jvm.config file explicitly specifies -XX:+UseParallelGC as a JVM argument. Per the FusionReactor performance troubleshooting blog at fusion-reactor.com, ColdFusion's default convention has long been Parallel Garbage Collection. Per Mark Kruger's older ColdFusion Muse posts at coldfusionmuse.com, the ColdFusion Administrator UI itself enforces -XX:+UseParallelGC when settings are saved.
This default has carried forward through CF 2018, CF 2021, CF 2023, and CF 2025. Even though CF 2025 runs on JDK 21 — which would default to G1GC if no GC argument were specified — ColdFusion’s jvm.config still explicitly sets ParallelGC, overriding the JDK default.
The practical implication: if you’ve never edited jvm.config to remove -XX:+UseParallelGC and add -XX:+UseG1GC, your ColdFusion server is running the Parallel collector regardless of which JDK version is underneath.
Is this wrong? Not necessarily. The Parallel collector is optimized for throughput — total work done per unit of CPU time. For server workloads that prioritize total request throughput over per-request response time consistency, ParallelGC is often a fine default. The trade-off, as Charlie Arehart noted in a 2021 Adobe community thread about a customer with a large-heap, high-transaction-rate workload, is that ParallelGC maximizes throughput while G1GC minimizes pause times. The right choice depends on which metric your workload cares about more.
But the assumption baked into most online “ColdFusion JVM tuning” articles — that you’re already on G1GC and just need to tune its parameters — is often the wrong starting point. Verify your current GC algorithm before tuning anything else:
<cfscript>
    // Print current JVM arguments — sourced from runtime
    rb = createObject("java", "java.lang.management.ManagementFactory")
            .getRuntimeMXBean();
    args = rb.getInputArguments();
for (arg in args) {
        writeOutput("#arg#<br>");
    }
</cfscript>
Or, from the command line on the CF server:
# Find the CF Java process
ps -ef | grep -i coldfusion

# Print the JVM arguments
jcmd <PID> VM.flags
jcmd <PID> VM.command_line
If you see -XX:+UseParallelGC in the output, you're on Parallel. If you see -XX:+UseG1GC, you're on G1. If you see neither, you're on whatever the JDK defaults to (G1GC on JDK 9+).
The rest of this post assumes you’ve made an informed choice about which GC to use, not inherited the default by accident.
The CF Memory Model: What Actually Consumes RAM
Before sizing the heap, understand what’s eating the memory in a ColdFusion process. The JVM doesn’t just allocate “the heap” — it allocates a structured set of memory regions, each with its own role and size characteristics.
Heap (Young Generation + Old Generation)
The main object memory. Sized by -Xms (initial) and -Xmx (maximum). Per Charlie Arehart and many community sources, production CF servers should set Xms equal to Xmx to avoid the JVM resizing the heap at runtime — which itself causes GC churn and pauses.
The heap is internally divided into Young Generation (where new objects allocate) and Old Generation (where long-lived objects are promoted). For G1GC, the heap is further divided into regions. For ZGC, into “pages.” The total -Xmx is the maximum sum of all these subdivisions.
Metaspace (Replaced PermGen in Java 8)
Class metadata storage. Lives in native memory, separate from the heap. Sized by -XX:MaxMetaspaceSize. If unbounded (default), it can grow until system memory runs out.
Per the FusionReactor performance documentation at fusion-reactor.com, the introduction of MaxMetaspaceSize in Java 8 replaced the older MaxPermSize flag. If you have legacy -XX:PermSize or -XX:MaxPermSize flags in jvm.config, the modern JDK will print a deprecation warning and ignore them.
Recommendation: set -XX:MaxMetaspaceSize=512m to -XX:MaxMetaspaceSize=1024m for typical CF applications. A runaway custom-tag library or accumulating class loaders can cause Metaspace to grow without bound if you don't cap it.
Code Cache
JIT-compiled native code. Sized by -XX:ReservedCodeCacheSize (default 240MB on JDK 17/21). For large CF applications with many CFCs, increasing this to 512MB can prevent the JIT from disabling itself under cache pressure.
Thread Stacks
Each Java thread (including every ColdFusion request thread) gets its own stack. Sized by -Xss (default ~1MB on 64-bit). With ColdFusion's typical Tomcat thread pool of 100-500 threads, this is 100-500MB of additional process memory above the heap.
Direct Buffers (Off-Heap)
Native memory used by NIO buffers, some libraries, JDBC drivers. Not visible in heap dumps. Limited by -XX:MaxDirectMemorySize (defaults to Xmx if not specified). A common source of "the heap looks fine but the process is using 16GB" surprises.
JVM Overhead
The JVM itself — class metadata, JIT structures, GC bookkeeping — typically consumes another 200–500MB of native memory beyond all of the above.
The Total Process Memory Formula
Approximate total ColdFusion JVM process memory:
Total ≈ Heap (Xmx)
      + Metaspace (MaxMetaspaceSize or unbounded)
      + Code Cache (default 240MB, often raised to 512MB)
      + Thread Stacks (Xss × number of threads)
      + Direct Buffers (varies by application)
      + JVM Overhead (~300-500MB)
For a CF server with -Xmx 8g, -XX:MaxMetaspaceSize=512m, code cache of 512MB, 200 threads at 1MB stacks, and modest direct buffer use, expect the process to consume roughly 10-11GB of system RAM under load. Plan capacity accordingly. This is why "give CF 8GB" and "the CF box has 10GB of RAM" don't match — the JVM needs the additional space above the heap.
How Much RAM to Allocate: The Heap Sizing Decision
The single most-asked CFML tuning question. Verified answer breakdown:
Adobe’s Position (Per cfguide.io)
Per the cfguide.io CF 2025 FAQ at cfguide.io/coldfusion-2025-faq, the headline guidance is: 50-70% of available system RAM for the JVM heap, with the immediate caveat that it depends on the application. The recommended starting point for production is 4-8GB, monitored via FusionReactor or the built-in Server Monitor and adjusted from there.
This is sound general guidance. The 50–70% bracket leaves headroom for:
- The non-heap JVM memory regions described above (Metaspace, code cache, thread stacks).
- The operating system’s own memory needs.
- File system page cache (which dramatically affects I/O performance — leaving RAM for the OS to cache disk reads is often more valuable than giving it to the JVM heap).
- Other processes on the same machine (web server, database, monitoring agents).
A box with 16GB of physical RAM can comfortably give CF an 8GB heap. A box with 32GB can give CF 16GB. A box with 4GB should give CF no more than 2–2.5GB and probably less.
Set Xms = Xmx in Production
Universally recommended across primary sources (Charlie Arehart’s writings, Pete Freitag’s guidance, the TeraTech tuning guide, Mark Kruger’s ColdFusion Muse). The reasoning: when -Xms is smaller than -Xmx, the JVM starts with the smaller heap and grows it dynamically. Each growth event triggers a full GC. Application response time is uneven during the warmup period as the heap grows.
# ❌ Default-ish — heap grows over time, causing periodic GC pauses
-Xms512m -Xmx8g

# ✅ Production pattern - heap is fixed at 8GB from start
-Xms8g -Xmx8g
The total RAM usage is no higher with this pattern; the heap reaches -Xmx quickly under load anyway. The difference is when and how predictably the memory commits.
Container Considerations: Use Percentage Flags
For ColdFusion running in Docker, Kubernetes, ECS, or any container orchestrator, the static -Xms/-Xmx pattern is brittle — if the container's memory limit changes, you have to rebuild the image with new JVM args.
The modern alternative, per the ColdFusion Central JVM upgrade documentation at coldfusioncentral.com/coldfusion-jvm-upgrade/, is the percentage-based flag:
-XX:MaxRAMPercentage=70
-XX:InitialRAMPercentage=70
These tell the JVM to use 70% of whatever container memory limit is set. Resize the container, and the JVM resizes automatically. Particularly useful for environments where memory limits are managed by the orchestrator (cgroups on Kubernetes, ECS task memory limits, etc.).
How Much Is “Enough”? The Working Set Approach
The principled answer to “how much heap?” is: enough to comfortably hold your application’s working set (live objects after a full GC) plus enough free space for the GC algorithm to work efficiently.
For G1GC and ZGC specifically, the rule of thumb is that the heap should be at least 30–50% larger than the working set. The TeraTech tuning guidance specifically mentions that “the ideal maximum available free heap should be 30%.” Per the Java GC tuning literature, G1GC’s InitiatingHeapOccupancyPercent defaults to 45% — at 45% old-generation occupancy, G1 starts a concurrent marking cycle. If your working set fills the heap above this level, GC becomes constant and performance collapses.
Practically, this means:
- Run your application under realistic load.
- Force a full GC (
jcmd <PID> GC.run). - Measure heap usage immediately after the GC: that’s roughly your working set.
- Size your
-Xmxto at least 2-3× the working set for healthy GC behavior.
For typical CF applications, working sets fall in the 1–4GB range; heaps in the 4–8GB range work well. For larger applications (significant ORM use, large in-memory caches, large session populations), working sets and heaps scale up proportionally.
The 4–8GB Starting Point
For a production CF server with no prior tuning history, start with -Xms4g -Xmx4g if you have ≥8GB of system RAM, or **-Xms8g -Xmx8g** if you have ≥16GB. Monitor for one to two weeks under typical load. Increase if you see frequent GC, persistent high heap occupancy, or out-of-memory errors. Decrease if heap occupancy stays consistently under 30%.
When to Use ParallelGC vs G1GC vs ZGC
Three legitimate choices for ColdFusion on modern JDKs. The decision criteria — verified from Charlie Arehart’s writings, the foojay/InfoQ analyses, and the Datadog GC deep-dive at datadoghq.com/blog/understanding-java-gc/:
Parallel GC (CF’s Default)
Optimized for throughput maximization. Stop-the-world pauses are longer than G1GC’s but total CPU time spent on GC is lower. Best for:
- Smaller heaps (under 4–6GB).
- Workloads that prioritize total throughput over per-request latency.
- Batch-processing patterns where occasional multi-second pauses are acceptable.
- CFML applications where users tolerate occasional 1–3 second pauses better than they tolerate higher CPU utilization.
CF’s default — and not a wrong default for many deployments. If you don’t have specific evidence that GC pauses are hurting your users, don’t switch away from ParallelGC just because Internet articles tell you to use G1.
G1GC (Garbage First)
Optimized for pause time consistency while preserving most of ParallelGC’s throughput. Per the foojay 10-year GC guide (January 2026), G1GC is the right choice when:
- Heap is medium-to-large (4GB+).
- Application is a general web service with balanced latency and throughput needs.
- You can tolerate slightly higher CPU usage in exchange for shorter, more predictable GC pauses.
- Pause time targets are in the 100–300ms range.
Per Charlie Arehart’s 2021 Adobe community thread, G1GC specifically makes sense for ColdFusion when heap exceeds ~6GB and pause-time minimization matters more than throughput maximization. For typical user-facing CFML web applications, this is increasingly the case.
Generational ZGC (JDK 21+)
The newest production-ready option, and a meaningful upgrade from non-generational ZGC. Per JEP 439 and the InfoQ coverage at infoq.com/news/2023/07/java-enhance-zgc/, Generational ZGC was promoted to Completed status in JDK 21. It became the default in JDK 23.
Enable in JDK 21 with:
-XX:+UseZGC -XX:+ZGenerationalZGC’s selling point is sub-millisecond pause times regardless of heap size. Per the toolshelf.tech and dataintellect.com analyses, ZGC pauses stay under 1ms even on heaps in the tens of gigabytes.
The trade-off:
- CPU overhead: 8–20% higher than G1GC, per the foojay analysis. Concurrent GC threads consume CPU cycles alongside your application.
- Memory overhead: typically requires 30–50% more heap than G1GC for the same workload, because ZGC reserves heap for allocations during concurrent collection.
- Throughput: per the foojay analysis, ZGC trades approximately 7–15% of raw throughput for the pause-time benefits.
ZGC makes sense for ColdFusion when:
- Heap is large (10GB+) and continues to grow.
- Application is latency-critical (user-facing portal where every page-load matters, real-time dashboard, etc.).
- You have CPU headroom to spend on the GC overhead.
For most CF deployments, G1GC is still the right answer in 2026. ZGC is the right answer for the specific subset of latency-critical, large-heap applications where the CPU cost is worth the pause-time guarantee.
The Quick Decision Matrix
Workload characteristics Recommended GC Tiny container (< 2 cores, < 2GB RAM) SerialGC Heap < 4GB, throughput-focused ParallelGC (CF’s default) Heap 4–32GB, general web app G1GC Heap 10GB+, latency-critical (<1ms pause targets), CPU headroom available Generational ZGC (JDK 21+) Container with variable memory limit G1GC + MaxRAMPercentage (most cases)
G1GC Flags That Actually Work in JDK 21
The list of G1GC tuning flags is long. Many are deprecated, removed, or no longer needed in modern JDKs. The verified-current set for JDK 17 / JDK 21:
The Core Flag
-XX:+UseG1GCThis is the only flag required to enable G1GC. The defaults are reasonable for most workloads.
Pause Time Target
-XX:MaxGCPauseMillis=200G1’s primary tuning knob. Defaults to 200ms. Lower targets = more frequent shorter pauses; higher targets = less frequent longer pauses. Don’t set this lower than 100ms unless you have specific evidence that pauses are hurting your application — values below 50ms generally cause G1 to do more work and may hurt throughput without meaningfully improving user experience.
For typical CFML web applications, 200 is fine. For latency-critical applications where users feel anything over 100ms, drop to 100. For batch-heavy CF applications where pauses don't matter much, raise to 500 or 1000 and gain throughput.
String Deduplication
-XX:+UseStringDeduplicationG1GC-specific feature that deduplicates String objects with identical character contents in the Old Generation. Per the ColdFusion Central JVM tuning guide, this is a low-risk, often-beneficial optimization for CFML applications — which tend to have many duplicate string allocations (column names from cfquery results, repeated configuration values, etc.).
Worker Threads
Per Hostek’s older but still-valid ColdFusion JVM tuning guide at wiki.hostek.com/ColdFusion_Performance:
-XX:ParallelGCThreads=N        # N = number of CPU cores
-XX:ConcGCThreads=N/2          # half of ParallelGCThreads
ParallelGCThreads controls how many threads G1 uses during the stop-the-world phases. ConcGCThreads controls how many threads run concurrently with your application during the marking phase.
Default values are derived from the number of available CPUs and usually work. Override when you have specific evidence — e.g., on a 16-core machine where you don’t want G1 to commandeer all 16 cores during a pause, you might set -XX:ParallelGCThreads=8.
Heap Region Size
-XX:G1HeapRegionSize=NmG1 divides the heap into equal-sized regions. Default region size is calculated based on heap size (typically 1MB to 32MB). Override only if you have measured evidence of frequent “humongous” object allocations (objects larger than half a region), which can cause G1 to perform poorly.
-XX:G1HeapRegionSize=16m       # Reasonable for heaps in 4-16GB range
-XX:G1HeapRegionSize=32m       # For larger heaps (16GB+)
Initiating Heap Occupancy Percent
-XX:InitiatingHeapOccupancyPercent=45Default value: 45. When the old generation reaches 45% occupancy, G1 starts a concurrent marking cycle. Lower this if your application allocates rapidly and you see “to-space exhausted” errors. Raise it if marking cycles are starting too early.
Most CFML applications don’t need to touch this. If you do, change in small increments (5–10 percentage points at a time) and measure.
Heap Dump on OOM (Diagnostic, Not Tuning)
Not GC tuning specifically, but essential for production:
-XX:+HeapDumpOnOutOfMemoryError
-XX:HeapDumpPath=/var/log/coldfusion/heapdumps/
When ColdFusion runs out of memory, this writes a heap dump to disk that you can analyze later with Eclipse Memory Analyzer or similar tools. Mandatory for production servers.
GC Logging (JDK 11+ Unified Logging)
The single most important tuning flag — without GC logs, you can’t see what your changes did:
# JDK 11+ unified logging syntax
-Xlog:gc*:file=/var/log/coldfusion/gc.log:time,uptime,level,tags:filecount=10,filesize=100M
Breaking down what this does:
gc*— log all GC-related eventsfile=/var/log/coldfusion/gc.log— write to this filetime,uptime,level,tags— what each log line includesfilecount=10,filesize=100M— rotate every 100MB, keep 10 files
Analyze the resulting logs with:
- GCEasy (
gceasy.io) — online analyzer that produces graphs and recommendations. - GCViewer — desktop GC log viewer.
- JFR (Java Flight Recorder) — built into the JDK, more detailed than GC logs.
Per the ColdFusion Central JVM upgrade documentation, the older -Xloggc:file and -XX:+PrintGCDetails flags from JDK 8 are deprecated in modern JDKs. Replace them with the unified -Xlog:gc* syntax shown above.
Flags to REMOVE (Deprecated or Removed in Modern JDK)
A surprising number of CFML JVM tuning guides on the internet date from the JDK 8 era and recommend flags that no longer work. If you see these in your jvm.config, remove them:
-XX:+AggressiveOpts
Removed entirely in JDK 12. If present in your jvm.config on JDK 17 or JDK 21, the JVM will print a warning and ignore it. Per the ColdFusion Central JVM upgrade documentation, this is one of the most common "unrecognized VM option" errors after a JDK upgrade.
-XX:+UseConcMarkSweepGC (CMS)
Removed in JDK 14. CMS was deprecated in JDK 9 and entirely removed in JDK 14. The migration path is G1GC.
If your jvm.config contains CMS-related flags (-XX:+UseConcMarkSweepGC, -XX:+UseParNewGC, -XX:CMSInitiatingOccupancyFraction, -XX:+UseCMSInitiatingOccupancyOnly, -XX:+CMSScavengeBeforeRemark), remove all of them and replace with G1GC equivalents.
-XX:PermSize and -XX:MaxPermSize
Replaced by Metaspace in Java 8. Per the FusionReactor performance documentation, the PermGen space no longer exists in modern JDKs. The replacement flag is -XX:MaxMetaspaceSize, which controls a different memory region (native, not heap) but plays the same role of preventing unbounded class metadata growth.
-XX:+UseCompressedOops
Not removed — but no longer needs to be set explicitly. Compressed object pointers became the default on 64-bit JVMs for heaps under 32GB in JDK 7. For heaps over 32GB, the JVM automatically disables compressed oops; you don’t need to manage this manually.
-XX:+DisableExplicitGC
Controversial. This flag disables System.gc() calls (which CFML occasionally invokes from Tag.Garbage or Application.gcInterval settings). Some performance guides recommend it to prevent applications from triggering unnecessary full GCs. However, disabling it can mask legitimate memory leak detection. For CFML specifically, leave System.gc() enabled unless you have evidence that something in your code is repeatedly calling it.
Legacy GC Logging Flags
# ❌ JDK 8 syntax — deprecated in JDK 11+
-Xloggc:/var/log/gc.log
-XX:+PrintGCDetails
-XX:+PrintGCTimeStamps
-XX:+PrintGCDateStamps
-XX:+UseGCLogFileRotation
-XX:NumberOfGCLogFiles=10
-XX:GCLogFileSize=100M

# ✅ JDK 11+ unified logging replacement
-Xlog:gc*:file=/var/log/gc.log:time,uptime,level,tags:filecount=10,filesize=100M
Production Starting JVM Configs by Workload Size
Adapt to your environment. These are starting points, not final tuning — always measure under your actual workload.
Small CF Server (2–4GB heap, throughput-focused)
# Keep CF's default ParallelGC; tune heap and add diagnostics
-server
-Xms2g -Xmx2g
-XX:+UseParallelGC
-XX:MaxMetaspaceSize=512m
-XX:ReservedCodeCacheSize=256m
-XX:+HeapDumpOnOutOfMemoryError
-XX:HeapDumpPath=/var/log/coldfusion/heapdumps/
-Xlog:gc*:file=/var/log/coldfusion/gc.log:time,uptime,level,tags:filecount=10,filesize=100M
Medium CF Server (4–8GB heap, balanced workload)
-server
-Xms8g -Xmx8g
-XX:+UseG1GC
-XX:MaxGCPauseMillis=200
-XX:+UseStringDeduplication
-XX:MaxMetaspaceSize=512m
-XX:ReservedCodeCacheSize=512m
-XX:+HeapDumpOnOutOfMemoryError
-XX:HeapDumpPath=/var/log/coldfusion/heapdumps/
-Xlog:gc*:file=/var/log/coldfusion/gc.log:time,uptime,level,tags:filecount=10,filesize=100M
Large CF Server (16–32GB heap, latency-sensitive)
-server
-Xms16g -Xmx16g
-XX:+UseG1GC
-XX:MaxGCPauseMillis=150
-XX:+UseStringDeduplication
-XX:G1HeapRegionSize=32m
-XX:MaxMetaspaceSize=1g
-XX:ReservedCodeCacheSize=512m
-XX:+HeapDumpOnOutOfMemoryError
-XX:HeapDumpPath=/var/log/coldfusion/heapdumps/
-Xlog:gc*:file=/var/log/coldfusion/gc.log:time,uptime,level,tags:filecount=10,filesize=100M
Very Large / Latency-Critical (JDK 21+, 32GB+ heap)
-server
-Xms32g -Xmx32g
-XX:+UseZGC
-XX:+ZGenerational
-XX:MaxMetaspaceSize=1g
-XX:ReservedCodeCacheSize=512m
-XX:+HeapDumpOnOutOfMemoryError
-XX:HeapDumpPath=/var/log/coldfusion/heapdumps/
-Xlog:gc*:file=/var/log/coldfusion/gc.log:time,uptime,level,tags:filecount=10,filesize=100M
Container Deployment (JDK 17 or 21)
-server
-XX:InitialRAMPercentage=70
-XX:MaxRAMPercentage=70
-XX:+UseG1GC
-XX:MaxGCPauseMillis=200
-XX:+UseStringDeduplication
-XX:MaxMetaspaceSize=512m
-XX:ReservedCodeCacheSize=512m
-XX:+HeapDumpOnOutOfMemoryError
-XX:HeapDumpPath=/tmp/heapdumps/
-Xlog:gc*:stdout:time,uptime,level,tags
Note: in container environments, log GC to stdout rather than a file path so the container logging driver captures it.
How to Actually Change CF’s JVM Config Safely
The mechanics matter. Wrong edits to jvm.config cause CF to fail to start, sometimes catastrophically.
Step 1: Find Your jvm.config
For standard ColdFusion installations:
<CF_HOME>/cfusion/bin/jvm.configFor multi-instance installs, each instance has its own jvm.config. Per Charlie Arehart's older but still-valid guidance at carehart.org/blog/2012/6/26/identifying_what_instance_uses_a_given_jvm_config, on Windows you can identify which jvm.config a service is using via the Windows registry under HKEY_LOCAL_MACHINE\SYSTEM\CurrentControlSet\services\.
Step 2: Back It Up (And Verify the Backup)
Per Adobe’s CF Administrator documentation, the CF Administrator automatically creates a backup as jvm.bak whenever you save changes via the Administrator UI. Verify this file exists before relying on it:
ls -la <CF_HOME>/cfusion/bin/jvm.bakFor manual edits (which I recommend over CF Administrator edits for non-trivial changes), make your own backup:
cp <CF_HOME>/cfusion/bin/jvm.config <CF_HOME>/cfusion/bin/jvm.config.$(date +%Y%m%d-%H%M%S).bakStep 3: Edit
Three approaches:
Option A — CF Administrator UI: Settings → Java and JVM → JVM Arguments. Easiest for simple changes (single flag adjustments). The Administrator filters out some default flags from what it displays, so the visible list may not be complete.
Option B — Direct jvm.config edit: Open the file in a text editor. The java.args=... line is where JVM arguments live. Use forward slashes even on Windows (CF parses forward slashes correctly; backslashes break the file). All arguments must be on one logical line.
Option C — Per-instance JVM config: For multi-instance setups, edit the instance-specific jvm.config. Don't share JVM args between instances unless you genuinely want them to behave identically.
Step 4: Restart CF and Verify
# Linux systemd
systemctl restart coldfusion_2025

# Older init.d
service coldfusion_2025 restart
# Windows
Restart-Service "ColdFusion 2025 Application Server"After restart, verify the new JVM args took effect:
# Find PID
ps -ef | grep -i coldfusion

# Verify args
jcmd <PID> VM.flags
jcmd <PID> VM.command_line
Or via the CFML method shown earlier in this post (server.system.properties + the runtime MXBean).
Step 5: Watch the Logs
For the first hour after a JVM config change, watch:
<CF_HOME>/cfusion/logs/server.log— for startup errors.<CF_HOME>/cfusion/logs/exception.log— for unexpected exceptions.- Your GC log path — for normal GC activity.
- Application response time and throughput — via FusionReactor, PMT, or your APM.
If anything looks wrong, roll back immediately:
# Restore from your timestamped backup
cp <CF_HOME>/cfusion/bin/jvm.config.YYYYMMDD-HHMMSS.bak \
   <CF_HOME>/cfusion/bin/jvm.config
systemctl restart coldfusion_2025
Don’t try to fix problems by adding more flags. Roll back to the known-good state, analyze the logs, and try a smaller change next.
Common Tuning Mistakes (Found The Hard Way)
A non-exhaustive list of patterns that have caught real CF JVM tuning projects:
1. Tuning Without Measuring
The single most common mistake. Someone reads an article, applies a set of flags, declares the tuning done, and never measures whether the change helped. The right pattern: capture baseline metrics (p50/p95/p99 response time, throughput, GC pause distribution) before changing anything; apply one change; re-measure; iterate.
2. Copying Flags From Generic Java Tuning Articles
A flag set that’s optimal for a Kafka broker, a Cassandra node, or a Spring Boot microservice is not optimal for ColdFusion. Adobe’s threading model, CFML execution patterns, and typical allocation rates differ from general Java applications. Start from a known-good CF-specific config (like the ones in this post) and tune from there.
3. Setting Xmx Equal to System RAM
Leaves zero room for the JVM’s non-heap memory, the OS, or other processes. The CF JVM process will be killed by the OS OOM-killer (Linux) or crash with a “Could not reserve enough space” error. Stick to 50–70% of system RAM.
4. Setting Different -Xms and -Xmx in Production
Causes ongoing heap resize churn. Use the same value for both.
5. Leaving Deprecated Flags in jvm.config After JDK Upgrade
-XX:+AggressiveOpts, CMS flags, PermGen flags — these will print warnings on startup or cause "unrecognized VM option" errors that prevent CF from starting at all. Always audit jvm.config against your target JDK version before upgrading.
6. Not Logging GC
The most important diagnostic information is GC log output, and a startling number of production CF servers run with no GC logging configured. Add -Xlog:gc*:file=... to every production CF server. The disk cost is negligible; the diagnostic value when something goes wrong is enormous.
7. Tuning MaxGCPauseMillis Aggressively Low
Setting -XX:MaxGCPauseMillis=10 doesn't give you 10ms pauses — it gives you G1GC doing constant short pauses that consume CPU and reduce throughput, without actually achieving the 10ms target on any heap larger than a few GB. Realistic targets for G1GC on 4-16GB heaps are 100-300ms. If you need sub-50ms pauses, you need ZGC, not aggressive G1GC tuning.
8. Confusing Container Memory Limit With JVM Heap
In Kubernetes / ECS, the container’s memory limit is the total memory available to the JVM process. The JVM heap must be smaller than this — the rest is consumed by Metaspace, code cache, threads, and JVM overhead. A container with a 4GB memory limit and -Xmx4g will OOM-kill before warm-up. Use MaxRAMPercentage=70 (or set -Xmx to 70-75% of the container limit explicitly).
9. Forgetting About Code Cache
For large CFML applications with thousands of CFCs, the default 240MB code cache can fill up. When it fills, the JIT compiler disables itself and falls back to interpreted execution — which is dramatically slower. Symptom: response time degrades over hours of uptime without any change in workload. Fix: -XX:ReservedCodeCacheSize=512m.
10. Tuning ColdFusion While the Real Bottleneck Is the Database
Tuning the JVM matters when GC pauses or memory pressure is genuinely your bottleneck. If your application is bottlenecked on slow database queries, no amount of JVM tuning will help. Profile first with FusionReactor, PMT, or your APM to identify the actual bottleneck before changing JVM args.
Monitoring What Your Changes Actually Did
Tuning is a measurement loop, not a one-time configuration. The metrics that matter:
GC Pause Distribution
The most important measurement. Captured from GC logs (parsed by GCEasy or similar). Look at:
- Average pause time — typical pause duration.
- p99 pause time — your worst pauses (the ones users notice).
- Total time in GC — what percentage of CPU is spent in GC. Healthy applications spend < 5%; > 10% is a problem.
- Frequency of full GCs — Young Gen collections are normal and frequent; full GCs (or G1 mixed collections) should be rare. Frequent full GCs indicate heap pressure.
Heap Occupancy Over Time
From FusionReactor, PMT, or jstat. Healthy heap behavior shows a sawtooth pattern: gradual growth between GCs, sharp drops at GC events, and a stable steady-state heap occupancy (the working set). Sawtooth that flattens at the top indicates heap exhaustion. Steady-state occupancy that creeps upward over time indicates a memory leak.
Application Response Time Distribution
p50, p95, p99 response times. The connection to GC tuning: if p99 response time is dominated by GC pause time, GC tuning will help. If p99 is dominated by slow database queries, GC tuning is irrelevant.
Tools
- FusionReactor — the canonical CFML APM. Per the cfguide.io TCO calculator coverage, lists at roughly $79/server/month. Genuinely worth it for production CF deployments.
- Performance Monitoring Toolset (PMT) — included with both CF Standard and Enterprise editions. Less feature-rich than FusionReactor but free.
- JFR (Java Flight Recorder) — built into JDK 11+. Powerful, low-overhead, can capture detailed runtime data. Start with
jcmd <PID> JFR.start duration=300s filename=/tmp/cf.jfr. - GCEasy (
gceasy.io) — upload GC log, get analysis. Free for small logs. - GCViewer — desktop GC log analyzer. Free, open source.
- jstat / jcmd — JDK command-line tools for live JVM inspection.
- VisualVM — visual JVM monitoring. Free, included with the JDK.
Special Considerations for Enterprise Teams
- Multi-instance environments: every instance has its own
jvm.config. Apply tuning consistently across instances, or document explicitly why one instance has different settings from its peers. - Auto-scaling environments: container-based CF deployments using
MaxRAMPercentagework well; static-Xmxin containers with variable memory limits causes problems. Use percentage flags in any environment where the container memory limit might change. - JFR for compliance: JFR captures detailed runtime data that can be useful for compliance auditing (CPU usage patterns, allocation patterns, request handling characteristics). Continuous low-overhead JFR recording is reasonable to enable in production.
- JVM upgrade testing: when migrating from CF 2023 (JDK 17) to CF 2025 (JDK 21), test JVM args explicitly. Deprecated flags will cause warnings or errors; some defaults have changed (especially around module access). See our prior CF 11 → CF 2025 migration post for the broader upgrade context.
- Disaster recovery scenarios: include
jvm.configin your DR backups. A correctly-tuned production CF server is data; treat its configuration with the same rigor as the application code itself. - Performance regressions after Adobe APSB updates: occasionally, an Adobe ColdFusion update changes default JVM behavior or modifies the
jvm.configtemplate. Diff yourjvm.configbefore and after every APSB update. If Adobe's template changes have undone your customizations, restore them. - Capacity planning: if you’ve documented the working-set-to-heap ratio for your application, scaling becomes mathematical: 2x the users → roughly 2x the working set → roughly 2x the heap → roughly 2x the RAM per server. Without this measurement, capacity planning is guesswork.
ColdFusion JVM Tuning FAQ
What’s the default GC algorithm on ColdFusion 2025?
Parallel GC (-XX:+UseParallelGC), explicitly set in ColdFusion's jvm.config. This carries forward from earlier CF versions and overrides JDK 21's own default of G1GC. Per Charlie Arehart's published analysis at coldfusion.adobe.com, the explicit ParallelGC argument in jvm.config is intentional and has been CF's default GC for many releases.
How much RAM should I give the JVM?
Per cfguide.io’s CF 2025 documentation, 50–70% of available system RAM, with 4–8GB as a practical starting point for production. Adjust based on actual heap occupancy measurements under your real workload. Set -Xms equal to -Xmx in production.
Should I switch from ParallelGC to G1GC?
Justified switch when: heap is large (4GB+, especially 6GB+), pause-time consistency matters more than total throughput, or users are noticing application freezes during GC pauses. Don’t switch just because Internet articles assume G1GC — measure first, switch when there’s evidence it would help.
What about ZGC?
Production-ready since JDK 15; got a major upgrade in JDK 21 with Generational ZGC (JEP 439). For very large heaps (10GB+, especially 32GB+) and latency-critical applications, Generational ZGC delivers sub-millisecond pause times. Enable in JDK 21 with -XX:+UseZGC -XX:+ZGenerational. The trade-off: 8-20% higher CPU overhead and 30-50% more heap headroom required compared to G1GC.
Which flags should I remove if I’m upgrading from an old jvm.config?
At minimum: -XX:+AggressiveOpts (removed in JDK 12), any CMS flags like -XX:+UseConcMarkSweepGC (removed in JDK 14), -XX:PermSize / -XX:MaxPermSize (replaced by Metaspace in Java 8), and the deprecated -Xloggc / -XX:+PrintGC* family (replaced by unified -Xlog:gc* in JDK 11+). Replace -XX:+UseCompressedOops with nothing (it's the default).
Where is jvm.config located?
For standard ColdFusion installations: <CF_HOME>/cfusion/bin/jvm.config. For multi-instance installs, each instance has its own jvm.config under <CF_HOME>/<instance_name>/bin/jvm.config. The CF Administrator's "Java and JVM" page also edits this same file.
Should I edit jvm.config directly or use the CF Administrator UI?
For simple single-value changes, the Administrator UI is fine. For multi-flag changes, direct jvm.config editing is more reliable — the UI sometimes filters or reorders flags in unexpected ways. Always back up first. The Administrator automatically creates jvm.bak when you save changes through the UI; for direct edits, create your own timestamped backup.
How do I verify my JVM changes took effect after restart?
Two ways: (1) jcmd <PID> VM.flags and jcmd <PID> VM.command_line from the command line; (2) CFML using java.lang.management.ManagementFactory.getRuntimeMXBean().getInputArguments(). If the new flags don't appear in either output, the change didn't apply — check for typos, file save errors, or that CF is using the right jvm.config file.
What’s the most important diagnostic flag to add right now?
GC logging via Java 11+ unified syntax: -Xlog:gc*:file=/var/log/coldfusion/gc.log:time,uptime,level,tags:filecount=10,filesize=100M. Without GC logs, you can't analyze what your JVM is actually doing under load.
How long should I wait between tuning changes?
At least 24–48 hours of representative production load. JVM behavior under early load (warm-up) is different from steady-state behavior. Apply one change, watch for a full business cycle, then evaluate. Don’t compound multiple changes — you won’t know which change caused which effect.
What’s a reasonable target for GC pause time on a 8GB heap?
For G1GC: 100–300ms p99 GC pauses are healthy. Anything consistently above 500ms suggests heap pressure or oversized objects (humongous allocations). For ZGC: sub-1ms p99 is the design target and is generally achievable.
Should I tune -Xss (thread stack size)?
Rarely needed. Default 1MB on 64-bit JVMs is fine for almost all CFML applications. Reduce to 512k (-Xss512k) only if you have an unusually large number of threads (thousands) and need to reduce per-thread memory overhead. Increase only if you have specific evidence of StackOverflowError exceptions in deep recursion or large CFML call chains.
My CF process is using way more RAM than -Xmx. Why?
The JVM process memory includes much more than just the heap: Metaspace, code cache, thread stacks (1MB × thread count), direct buffers, GC structures, and JVM overhead. A CF process with -Xmx 8g will typically use 10-12GB of process memory total. This is normal. Account for it in capacity planning.
Conclusion: Measure First, Tune With Discipline
JVM tuning has a reputation as dark art because most published advice is either outdated (recommending CMS or AggressiveOpts in 2026), generic (assuming a non-CF workload), or unsourced (numbers pulled from nowhere). This post took the opposite approach: verified facts from primary sources, no invented numbers, no benchmark claims that haven't been published by someone authoritative.
The discipline that separates effective JVM tuning from cargo-culting:
- Verify your current state first. What GC is actually running? What’s the actual heap configuration? Many “I need to tune G1GC” conversations end immediately when the team realizes they’re not even running G1GC.
- Measure before you change anything. Capture GC log baselines, p50/p95/p99 response times, and steady-state heap occupancy before applying tuning. You can’t know if a change helped without knowing where you started.
- Change one thing at a time. Apply one tuning change. Wait at least 24–48 hours under production load. Measure. Only then move to the next change.
- Roll back when things get worse. A documented rollback procedure to a known-good
jvm.configis more valuable than another half-dozen tuning flags. - Match the GC to the workload. ParallelGC for throughput-focused smaller heaps (and as CF’s default, often fine). G1GC for general-purpose medium-to-large heaps. Generational ZGC for very large or latency-critical workloads on JDK 21+.
- Keep GC logs. Always. In every environment. The disk cost is trivial; the diagnostic value when something goes wrong is enormous.
For organizations without dedicated CFML performance engineering expertise in-house, this is exactly the kind of work a specialist **ColdFusion development** and security partner is built to support: baseline measurement, tuning recommendations, rollout planning, and ongoing observability instrumentation as a coordinated engagement. The engagement cost is typically dwarfed by the value of preventing one severe production GC incident or right-sizing infrastructure that’s been over-provisioned for years.
The JVM is the engine room of every ColdFusion application. Treating its configuration with the same rigor you’d apply to application code — version-controlled, peer-reviewed, tested in staging, rolled out with measurement — is what separates production-quality CF deployments from the ones where “the server is slow today” is a regular complaint with no diagnosable cause. The flags in this post are starting points. The discipline is the destination.
Further Reading (Primary Sources, verified May 2026)
- Adobe — Set Java and JVM preferences —
helpx.adobe.com/coldfusion/configuring-administering/configuring-coldfusion/java-jvm.html - Adobe — Maximum JVM heap size greater than 1.8GB will prevent ColdFusion MX from starting (historical KB) —
helpx.adobe.com/coldfusion/kb/maximum-jvm-heap-size-greater.html - Adobe — Understanding various types of memory and tuning in ColdFusion (2016) —
coldfusion.adobe.com/2016/10/understanding-various-types-of-memory-and-tuning-in-coldfusion/ - Charlie Arehart — Hidden Gems in CF2018, part 2 (covers the ParallelGC default) —
coldfusion.adobe.com/2019/01/hidden-gems-cf2018-part-2-installation-administration-configuration/ - Charlie Arehart — How to identify what jvm.config a ColdFusion instance uses —
carehart.org/blog/2012/6/26/identifying_what_instance_uses_a_given_jvm_config - Adobe community thread — increase allocated memory cf2016 (G1GC discussion with Charlie Arehart’s analysis) —
community.adobe.com/questions-582/increase-allocated-memory-cf2016-275309 - TeraTech — 4 Focus Areas For The Best ColdFusion Server Optimization —
teratech.com/best-coldfusion-server-optimization/ - cfguide.io — ColdFusion 2025 FAQ (heap allocation recommendations) —
cfguide.io/coldfusion-2025-faq - cfguide.io — Server Settings: Java and JVM —
cfguide.io/coldfusion-administrator/server-settings-java-jvm - ColdFusion Central — How to Upgrade ColdFusion JVM —
coldfusioncentral.com/coldfusion-jvm-upgrade/ - ColdFusion Central — ColdFusion Performance Tuning Guide —
coldfusioncentral.com/coldfusion-performance-tuning-guide/ - FusionReactor — ColdFusion Performance Issues and Troubleshooting —
fusion-reactor.com/blog/coldfusion-performance-issues-and-troubleshooting/ - Hostek Wiki — ColdFusion Performance —
wiki.hostek.com/ColdFusion_Performance - InfoQ — Java Enhances Z Garbage Collector with Generational Capabilities (JEP 439) —
infoq.com/news/2023/07/java-enhance-zgc/ - foojay — The Ultimate 10 Years Java Garbage Collection Guide (2016–2026) —
foojay.io/today/the-ultimate-10-years-java-garbage-collection-guide-2016-2026-choosing-the-right-gc-for-every-workload/ - Datadog — A deep dive into Java garbage collectors —
datadoghq.com/blog/understanding-java-gc/ - Stefan Johansson — JDK 21: The GCs keep getting better —
kstefanj.github.io/2023/12/13/jdk-21-the-gcs-keep-getting-better.html - GCEasy (GC log analyzer) —
gceasy.io - OpenJDK — Z Garbage Collector documentation —
wiki.openjdk.org/display/zgc
Have a ColdFusion environment with mystery slowdowns, OutOfMemory errors, or response-time inconsistency that nobody has been able to pin down? A specialist **ColdFusion development and security team** can absorb the JVM tuning project as a single coordinated engagement — baseline measurement, GC log analysis, tuning recommendations, controlled rollout, and ongoing observability instrumentation. The engagement cost is typically dwarfed by the value of preventing one severe production incident or right-sizing infrastructure that’s been over-provisioned for years.
Verification Notes
- ColdFusion’s default GC of Parallel (
-XX:+UseParallelGC) — verified from Charlie Arehart's "Hidden Gems in CF2018" post atcoldfusion.adobe.com, FusionReactor's performance troubleshooting blog, and Mark Kruger's ColdFusion Muse coverage. - Java 9+ defaulting to G1GC when no GC flag is specified — verified from Charlie Arehart’s CF 2018 coverage.
- CF 2025 requirement for JDK 21 — verified from cfguide.io’s CF 2025 documentation.
- The 50–70% RAM allocation guidance — verified from cfguide.io’s CF 2025 FAQ.
- The 4–8GB starting heap size for production — verified from cfguide.io’s CF 2025 FAQ.
- Set Xms equal to Xmx pattern — multiple primary sources (Quora answer, Mark Kruger, community consensus).
**-XX:+AggressiveOptsremoved in JDK 12** — verified from ColdFusion Central's JVM upgrade documentation.- CMS removed in JDK 14 — widely documented in JDK release notes; verified from multiple GC overview sources.
- PermGen replaced by Metaspace in Java 8 — verified from the FusionReactor performance documentation.
- JDK 11+ unified logging syntax — verified from ColdFusion Central’s JVM upgrade documentation and OpenJDK official docs.
- G1GC pause time default of 200ms — verified from Hostek’s CF JVM tuning wiki and standard JDK documentation.
- Generational ZGC introduced in JDK 21 via JEP 439, became default in JDK 23 — verified from InfoQ’s JEP 439 coverage, the foojay 10-year GC guide, and the Datadog GC deep-dive.
- ZGC’s 8–20% CPU overhead and 30–50% memory headroom characteristics — verified from the foojay 10-year GC guide.
**-XX:+UseStringDeduplicationas a low-risk G1GC optimization** — verified from ColdFusion Central's JVM upgrade documentation.**-XX:MaxRAMPercentageand-XX:InitialRAMPercentagefor container deployments** — verified from ColdFusion Central's JVM upgrade documentation.- The
jvm.bakauto-backup behavior — verified from Adobe's Set Java and JVM preferences documentation. - Multi-instance jvm.config location identification on Windows via registry — verified from Charlie Arehart’s blog post on identifying which jvm.config a CF instance uses.
- Charlie Arehart’s specific recommendation of G1GC for heaps >6GB with pause-time minimization needs — verified from the Adobe community thread “increase allocated memory cf2016.”
- The FusionReactor approximate pricing of $79/server/month — verified from cfguide.io’s TCO calculator.
메타데이터
- post_id
- 0df49012f331
- slug
- coldfusion-jvm-tuning-how-much-ram-to-allocate-and-which-g1gc-flags-actually-work-0df49012f331
- url
- https://medium.com/@Coding-Algorithms/coldfusion-jvm-tuning-how-much-ram-to-allocate-and-which-g1gc-flags-actually-work-0df49012f331
- canonical_url
- https://medium.com/@Coding-Algorithms/coldfusion-jvm-tuning-how-much-ram-to-allocate-and-which-g1gc-flags-actually-work-0df49012f331
- author_url
- https://medium.com/@Coding-Algorithms
- status
- ok
- fetched_at
- 2026-06-17 08:20:12