RahulMart Business Dashboard — A Retail Sales Analysis in Excel
In my previous articles I shared my Walmart and Superstore dashboards. This is my third project and each one is teaching me something new…
RahulMart Business Dashboard — A Retail Sales Analysis in Excel
In my previous articles I shared my Walmart and Superstore dashboards. This is my third project and each one is teaching me something new. RahulMart is a fictional Indian retail business I created specifically for practice and the dataset is available on my Kaggle profile for anyone who wants to practice data analytics.
The Dataset
RahulMart is a fictional retail business based in Bangalore, India. The dataset contains 500 orders across three years from 2022 to 2024 with 14 columns covering Order ID, Order Date, Ship Mode, Sales Representative, Customer Segment, City, Region, Category, Sub-Category, Quantity, Unit Price, Discount, Sales and Profit. The business sells products across three categories which are Electronics, Clothing and Groceries through three segments which are Wholesale, Online and Retail across four regions of India.
Tools Used
Everything was built in Microsoft Excel 365 using Power Query for data cleaning, Pivot Tables for analysis and Charts for visualization.
The Cleaning Process
The dataset was already clean so Power Query work was minimal. I verified all data types, confirmed Order Date was recognized as a proper date, set Sales and Profit as Decimal Number and Quantity as Whole Number. Once verified I closed and loaded the clean data as a structured table which became the single source of truth for all dashboard formulas.
Key Metrics
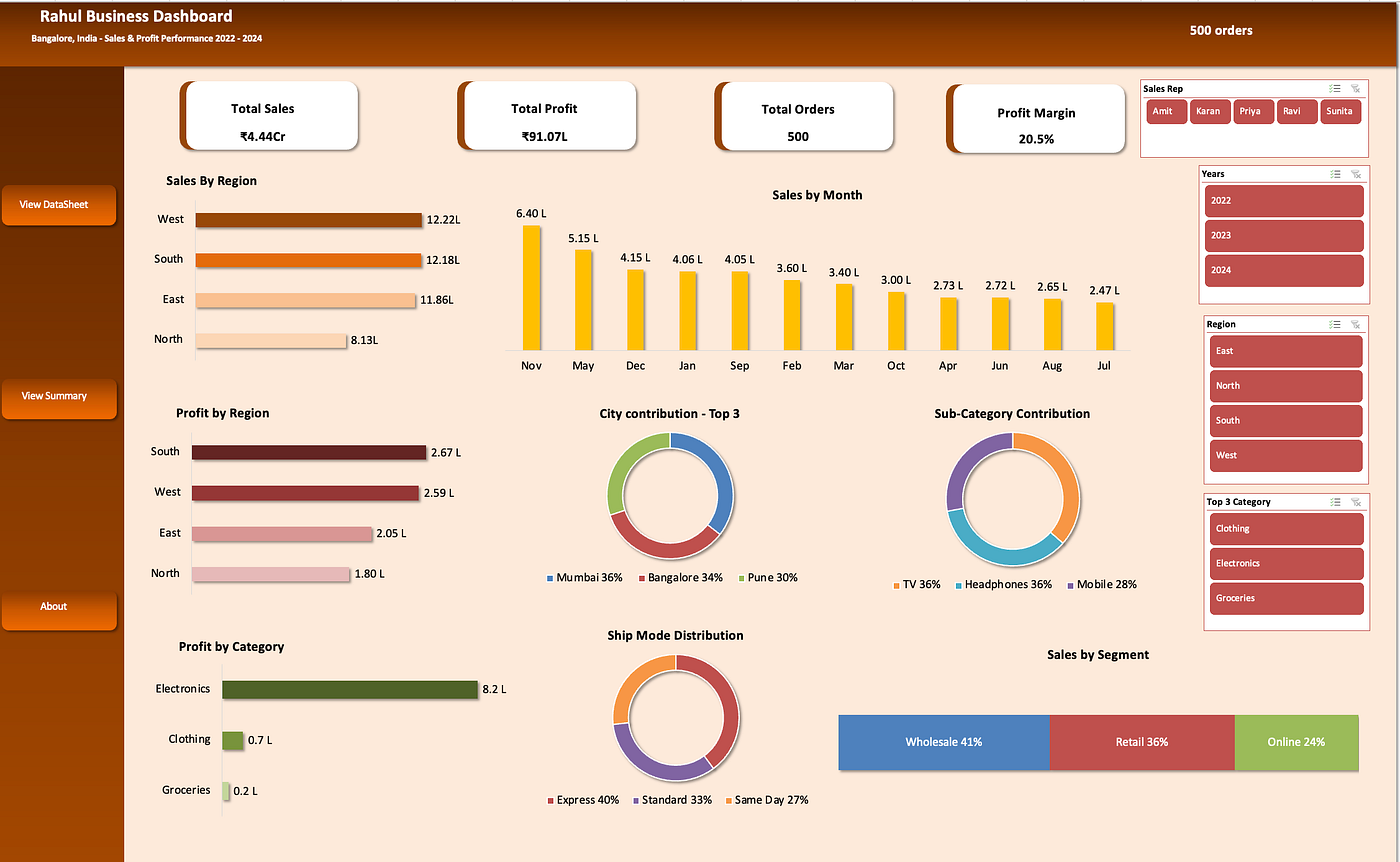
The dashboard shows four KPI cards at the top. Total Sales is 4.44 Crore rupees. Total Profit is 91.07 Lakhs. Total Orders is 500 across three years. Profit Margin is 20.5%.
Regional Performance
The Sales by Region chart shows West leading with the highest sales followed by South, East and North. However the Profit by Region chart tells a different story. South leads in profitability followed by West, East and North. This means West generates more sales but South is more profitable. South region appears to have better margins despite lower overall sales volume. This is an interesting business insight that Rahul as a business owner should investigate further.
Monthly Sales Trend
The monthly sales chart covers all three years combined from 2022 to 2024. November emerges as the peak sales month while July shows the lowest sales. This seasonal pattern is important for business planning. Rahul should ensure maximum stock and staffing in November and plan promotions in July to boost the slow month.
Category and Profit Analysis
The Profit by Category horizontal bar chart shows Electronics leading in profitability followed by Clothing and Groceries. Electronics generates 8.2 Lakhs in profit. Clothing contributes 0.7 Lakhs and Groceries 0.2 Lakhs. The significant gap between Electronics and the other two categories shows that Electronics is clearly the backbone of RahulMart’s profitability. Clothing and Groceries while necessary for a complete retail offering contribute very little to the bottom line.
City Contribution
Among the top three cities Mumbai leads with 36% of sales contribution followed by Bangalore at 34% and Pune at 30%. Together these three cities account for a significant portion of total revenue. For Rahul this means these three cities deserve the most attention in terms of marketing and inventory planning.
Sub-Category Performance
The sub-category doughnut chart shows TV and Headphones both contributing 36% each to sales, followed by Mobiles at 28%. Within the Electronics category TVs and Headphones are the strongest sellers. This tells Rahul where to focus his product stocking and promotional efforts within his best performing category.
Ship Mode Distribution
Express shipping leads at 40% of all orders followed by Standard at 33% and Same Day at 27%. The high proportion of Express and Same Day deliveries combined at 67% suggests that RahulMart customers value fast delivery. This is worth monitoring as faster delivery modes cost more and can impact profit margins if not managed carefully.
Sales by Segment
The segment analysis shows Wholesale driving 40.6% of total sales followed by Online at 35.5% and Retail at 23.8%. Wholesale is clearly the dominant channel for RahulMart. However the Online segment at 35.5% is significant and growing. Investing in the Online experience could help Rahul reduce dependency on Wholesale relationships and improve overall margins since Online typically has better margin potential than Wholesale.
What I Learned
This project taught me several important things.
First, I learned about Indian currency formatting in Excel. Showing numbers as Crore and Lakh instead of plain numbers makes dashboards immediately relatable for Indian business owners and audiences.
Second, I learned about dynamic chart labels using SUMIF and TEXT formulas combined. Instead of hardcoding percentages, I built formulas that calculate and display segment percentages automatically from the raw data. This means the labels update automatically when data changes.
Third, I learned the importance of using a dedicated Calculations sheet. Keeping all supporting formulas separate from the dashboard keeps the visual output clean and professional.
Fourth, I reinforced a lesson from my previous project. KPI cards should always pull directly from the raw data table, never from pivot tables. This ensures KPIs remain accurate even when slicers are applied to filter the dashboard.
메타데이터
- post_id
- 0eb7d8ab7e19
- slug
- rahulmart-business-dashboard-a-retail-sales-analysis-in-excel-0eb7d8ab7e19
- url
- https://medium.com/@rima8/rahulmart-business-dashboard-a-retail-sales-analysis-in-excel-0eb7d8ab7e19
- canonical_url
- https://medium.com/@rima8/rahulmart-business-dashboard-a-retail-sales-analysis-in-excel-0eb7d8ab7e19
- author_url
- https://medium.com/@rima8
- status
- ok
- fetched_at
- 2026-06-10 08:17:25