Observability Is the Backbone of Compliance
By Graham Brooks, CISSP. Graham is the Principal Consultant at Brooks Security LLC and an OpenObserve customer in multiple environments.
Observability Is the Backbone of Compliance
By Graham Brooks, CISSP. Graham is the Principal Consultant at Brooks Security LLC and an OpenObserve customer in multiple environments.
Most of my engagements start with a deadline. A customer contract requires a SOC 2 report, or the company has started handling protected health information and HIPAA now applies, and the founder wants to know where to start.
The environment I inherit is usually five years of whatever worked: two clouds, a dozen SaaS tools, services nobody remembers deploying, and nobody who can say with confidence what is actually running. I don’t fault anyone for that. Moving fast is how a startup survives. But it is a hard place to build a compliance program.
The first instinct is almost always paperwork. Buy a GRC tool and start writing policies. I push back every time. Compliance does not start with paperwork. It starts with visibility, because you cannot secure what you cannot see and you cannot attest to what you cannot prove.
Start with diagnostics, not documents
In any security operation, the first step is diagnostic and triage. Learn what you don’t know and establish the full scope of the environment before you change anything. Controls written before that step describe the environment you assume you have, not the one you actually have.
Log management is the foundation of that work. NIST defines it as the process of generating, transmitting, storing, analyzing, and disposing of log data, and calls it essential to keeping security records in enough detail for an appropriate period of time [1]. That definition is twenty years old. NIST is revising the publication now, but that core sentence has not needed to change.
And this is no longer a nice-to-have. In 2024, CISA, the FBI, the NSA, and Australia’s cyber agency jointly published baseline guidance on event logging, driven largely by attackers who “live off the land” and hide inside normal system activity [2]. When four national security agencies co-sign a document telling you to get your logging in order, the debate is over.
HIPAA formally starts somewhere else. The Security Rule’s first required implementation specification is a risk analysis, not logging [18], and OCR cites a missing or shallow risk analysis in more enforcement actions than any other failure. In practice, observability is how the risk analysis gets done. A risk analysis built from what the founder remembers deploying is fiction with a signature block. One built from two weeks of live telemetry is an inventory of what actually exists and where the sensitive data actually flows. Same requirement. Better evidence. Frameworks that put asset inventory first, like the CIS Controls, resolve the same way. Discovery comes first, and telemetry is the lion’s share of discovery.
Shadow IT is where this pays off hardest. The technique is subtraction. Take your total network traffic, subtract everything your telemetry already accounts for, and investigate what remains. Every unexplained flow is a system somebody stood up without telling anyone: no owner, no patching, no line in the risk analysis. And in most organizations that unowned remainder is a MASSIVE share of the real risk profile, precisely because nobody ever signed off on it. You cannot assess what you do not know exists. The subtraction finds it.
So when a client asks where compliance starts, my answer is always the same. We turn the lights on first.
Logging is the control that proves the other controls
Here is what makes log management unusual. Every other control needs evidence. Logging is a control AND it is the evidence for nearly everything else in the program.
Look at the frameworks my clients actually face:
SOC 2. Monitoring lives in the CC7 series of the Trust Services Criteria [3]. CC7.2 requires you to monitor system components for anomalies that could signal a security event [4]. CC7.1 requires you to detect configuration changes that introduce new vulnerabilities [5]. You do not satisfy either one with a policy document. You satisfy them with telemetry.
HIPAA. Audit controls under 45 CFR 164.312(b) are a required standard, not an addressable one [6]. You must record and examine activity in systems that touch electronic protected health information, and a separate provision requires you to regularly review those records [7]. HIPAA’s documentation rules are commonly read to pull those audit records into a six-year retention window. Specialists argue about the exact scope of that rule. Your auditor will not be impressed by the argument, so plan for six years.
PCI DSS. Requirement 10 mandates audit trails for all system components, centralized log aggregation, and twelve months of retention. Version 4.0 went further and now requires automated daily log review. A human squinting at a terminal every morning no longer counts [8].
Notice what all three keep demanding. HIPAA and PCI mandate logging outright. SOC 2 is criteria based, so in theory you could scope around it, but I have never watched an auditor accept the CC7 criteria without log evidence. And every one of these frameworks will ask you to produce log evidence for controls that have nothing to do with logging.
Logging is detective, not preventive. MFA and offboarding stop breaches, while logs only record them, which is why most priority lists put identity ahead of monitoring. In the environments I walk into, that ordering breaks down, because nobody can hand me a complete list of the systems and accounts that need securing. Harden only what you know about and you miss the things you don’t. And in practice the identity work is not waiting on the logging anyway. MFA and offboarding start week one, right alongside the collectors. But observability goes first on the calendar because audit evidence cannot be backfilled. A SOC 2 Type II tests controls operating over a window of months. You can write a policy in an afternoon. You can turn on MFA tomorrow. You cannot go back and create six months of log history. Every week without logging is a week of evidence gone forever. It is the one control where starting late is irreversible.
That is why it is the first control I implement. Stand up observability and you knock out a required control while evidence starts accumulating for everything else. It is the highest-leverage two weeks of work in the entire engagement.
The five attestations
When I pitch this to a client, I frame observability as the attestation layer for five things. Each one maps to a control family, and each one maps to a dashboard or query you can put directly in front of an auditor.
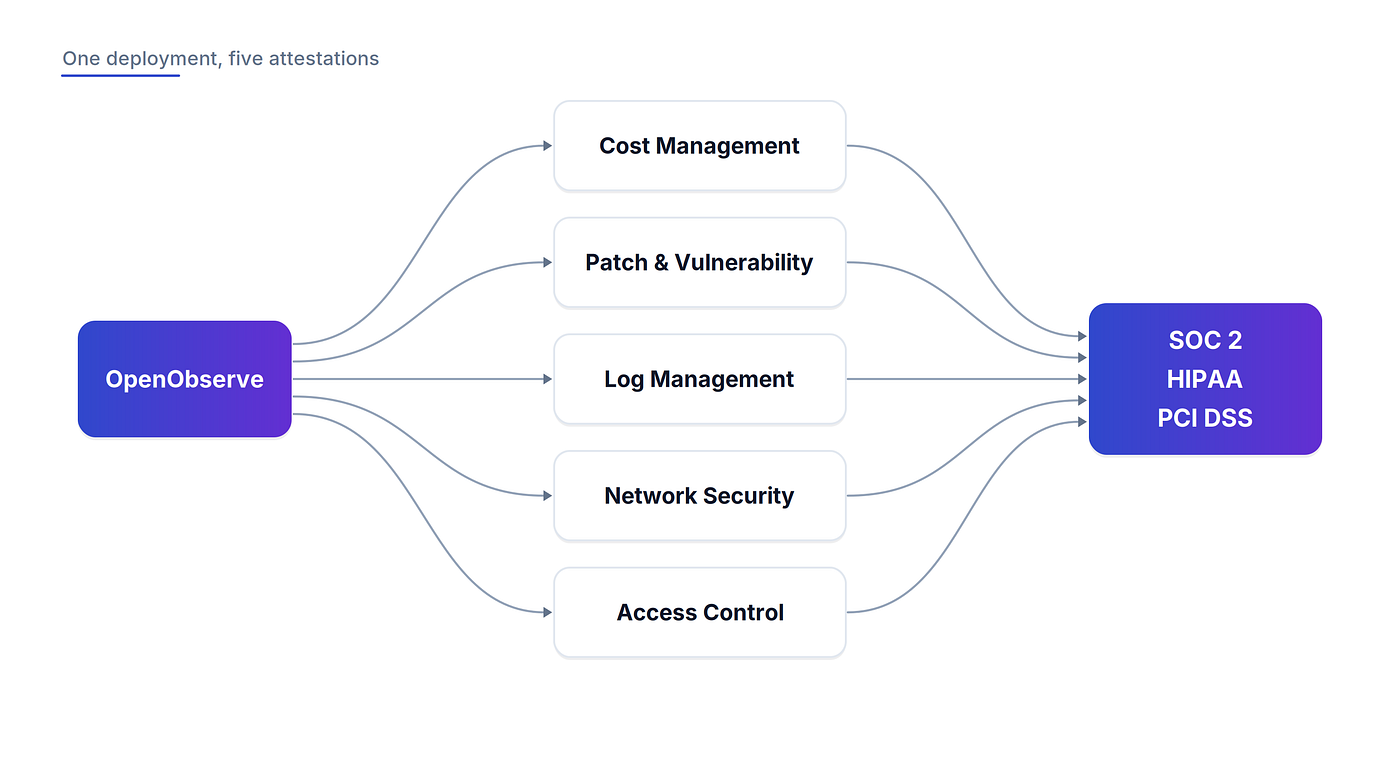
One deployment, five attestations
Cost management. Observability shows you spend, uptime, and resource usage across every platform in one place. Because log management was never just log management. It is live monitoring of what your systems actually do all day, and that usage data is exactly what you need to rightsize an environment. Auditors care about this less than CFOs do, but a company that cannot see its infrastructure cannot govern it, and governance is what SOC 2 is actually testing.
Patch and vulnerability management. When your telemetry shows configuration state and version drift, you can detect changes that introduce new vulnerabilities. That feeds directly into CC7.1 [5]. A dashboard does not replace a vulnerability scanner, and no auditor will accept one alone, but it is the evidence that ties your scans and your patch cadence to what is actually running.
Log management itself. The meta control. Your log platform attests to its own operation. Retention, integrity, and review all become queryable facts instead of claims.
Network security. Web application firewall triggers, denied connections, anomaly detection. When an auditor asks how you know your perimeter controls work, you show them the log of every time those controls fired [4].
Access control. Every login, failed attempt, and privilege change lands in the log. When the auditor asks whether the engineer who left in March actually lost access, a ticket only proves someone intended to remove it. The authentication log proves the account went dark. That is the CC6 series in SOC 2 [3], and it is the evidence HIPAA’s information system activity review assumes you already have [7].
The list keeps going. Incident response wants a timeline. Change management wants a record of who shipped what and when. Backup verification wants proof the job actually ran. All of it gets easier once the telemetry exists. But the five above are the major wins, and they are usually enough to carry the audit.
That is the pitch. Five attestations out of a single deployment, all drawing on the same evidence. It works because it turns compliance from a documentation project into an engineering project, and engineers are what startups actually have.
Why the tool matters
Remember the environment from the beginning of this article. Two clouds, a dozen tools, services nobody remembers deploying. Every one of those sources emits logs in its own format. The hardest part of standing up observability in a startup is not the dashboards. It is the ingestion, because most platforms want you to normalize all of that before it arrives.
This is why I standardized on OpenObserve. I am a paying customer, I run it in my own environment and in client engagements, and I recommend it to the people who pay me for advice. Read this as a practitioner’s endorsement, not a neutral review.
Four things make it fit this problem specifically.
First, it does not care where your data comes from. It ingests logs with automatic schema detection, it is OpenTelemetry native, and it works with the collectors people already run, including Fluent Bit, Vector, and Prometheus [9][10]. Queries are SQL and PromQL. There is no proprietary query language to learn, which matters when you are handing the keys to a two-person ops team.
Second, multi-organization isolation. Each organization gets its own data, users, streams, and dashboards [9]. I serve several companies at once, and no client wants their logs living next to somebody else’s, so the platform enforces the separation instead of my discipline. The same isolation works inside a single company for separating business units, environments, or customer tenants.
Third, bring your own bucket. OpenObserve writes its data as Parquet files to object storage you own, whether that is S3, GCS, Azure Blob, MinIO, or local disk [9][19].
Retention becomes yours to enforce. The six years HIPAA implies and the twelve months PCI requires are lifecycle policies on your own bucket, not a setting you hope a vendor honors. Data residency stays under your control, which is the deciding factor for clients who cannot let telemetry leave a region or a jurisdiction. Encryption uses your keys. Access to the bucket is logged by your own cloud provider, separately from the platform reading it. When an auditor asks where the evidence lives and who can reach it, the answer is your account and your IAM policy, and you can prove it without involving anyone else.
Bring your own bucket changes the cost math at volume. You pay your provider’s storage rate with no markup, which is what keeps multi-year retention affordable when you are holding everything an auditor might ask for. The files also stay readable without the platform, so if you ever leave, you already have your data.
Fourth, OpenObserve is SOC 2 Type II and ISO 27001 certified [11]. On the cloud offering, that means the platform holding your compliance evidence has already passed the audit you are preparing for. The trust report goes to your auditor on day one. Self-hosted is a different story. The certification covers their cloud service, not your deployment, so patching and hardening stay on your plate. What the certificate still tells you is that the vendor runs a real security program, and most tools in this space cannot say that.
The cheat code
Now for the part that feels like cheating.
OpenObserve ships with AI in the box on its Enterprise plans, and remember, the self-hosted Enterprise tier is free up to 50 GB per day. The assistant converts plain English into SQL and PromQL, summarizes log patterns, and builds dashboards and alerts from a sentence. The AI SRE agent goes further and correlates related alerts into a single incident with a likely root cause [9][17]. And because the platform supports MCP, you can plug in outside agents too. I augment mine with Claude through Cowork, which means my assistant can query my observability data directly while I work [9]. (Learned the hard way: bound your queries. Give Claude a specific stream and a tight time window, or it will scan everything you have ever ingested and demolish your search budget in an afternoon.)
Think about what that does to triage. The old workflow during an outage was grep, guess, and pray. Pull logs from five systems, normalize timestamps in your head, and hope the pattern jumps out before the customer calls back. Now my first move is literally a question. What changed in the last hour? Which service started throwing errors first? Show me every failed login since Tuesday. In my engagements, the diagnostic phase that used to eat the first hour of an incident now takes minutes.
And it is not just outages. The same trick works on the quiet days. Ask what is actually happening in the environment and you get a live picture of the ecosystem, not the diagram somebody drew eighteen months ago. For anyone walking into an unfamiliar stack, whether a new hire or a consultant like me, that is the single biggest time-saver I have found.
One disclaimer. In a regulated environment you need to engineer this carefully. An external AI querying your logs is a new data flow, and logs carry usernames, IP addresses, and sometimes record identifiers. Before you connect anything, scrub sensitive fields in the ingestion pipeline, limit the AI’s access to the streams it needs, and put the AI vendor through the same review as any other vendor, including a BAA in healthcare. A compliance shortcut that creates a compliance finding is not a shortcut.
The economics of starting free
Now the part that makes this practical instead of aspirational.
Observability cost is broken across the industry. Telemetry volume keeps growing faster than budgets, organizations name cost visibility as a top challenge, and studies keep finding that most log data gets collected, paid for, and never queried [12][13][14]. The answer to that problem is twofold. Prioritize what you collect, which is exactly what the CISA guidance tells you to do [2]. And make storage cheap enough that keeping the long tail for audits and investigations stops being a budget decision. Legacy pricing fails on both counts. Per host. Per user. Per metric. Every one of those meters punishes growth.
OpenObserve’s model is different in two ways that matter to a bootstrapped company. Storage sits on cheap object storage in Apache Parquet, in your own bucket if you want it there, with compression around 40x, which is where the claimed 140x storage cost reduction against Elasticsearch comes from [10][15]. And pricing is flat per gigabyte ingested, with unlimited users [16].
But here is the number that changes my engagements: the open source edition is free forever, and the Self-Hosted Enterprise edition is free up to 50 GB per day of ingestion, including SSO, RBAC, and an audit trail [9][16]. Fifty gigabytes a day is not a toy allowance. Most of my clients will not touch it for months or years, depending on what needs to be logged.
So my on-ramp costs the client nothing. We deploy in the first week, then spend two weeks just watching. Everything shows up in the data, including the cron job nobody has thought about since the person who wrote it left. And the deficits we find become the compliance roadmap. We did not need a six-month assessment to find them. The logs told us.

The observability-first sequence
Free is a great way to start. But free with SSO and an audit trail is a great way to start a compliance program.
And here is what I have found in practice, engagement after engagement. Stand up the platform for compliance and utilization monitoring comes with it. The same collectors shipping your audit logs are shipping uptime, CPU, memory, and usage patterns from every system. That data shows you the oversized instances, the idle services, and the storage nobody has touched in a year. In the cloud, you rightsize what the data exposes and the bill drops the same month. At my cloud-hosted clients, OpenObserve has paid for itself on rightsizing alone more often than not, before anyone even scheduled the audit. On-prem the math is slower, since the hardware is already bought and the savings show up at the next refresh instead of the next invoice. But the visibility matters even more there, because nobody is emailing you rightsizing recommendations for the rack in your closet. Either way, the compliance program starts funding itself. Try saying that about your GRC tool.
Final thoughts
I have run this play in my own lab and in client environments across very different industries. The play does not change.
I do not open an engagement with a policy binder. I turn the lights on. Observability first, because it is the one control that proves the others. Then the gaps show themselves, and we close them in order, with evidence accumulating the whole time.
You cannot attest to what you cannot see. Start with logs.
If you are staring down your first SOC 2 or HIPAA audit, deploy OpenObserve’s free tier this week and just watch your environment for fourteen days. I promise you will learn something you did not know. It costs nothing to find out.
Sources
- NIST SP 800–92, Guide to Computer Security Log Management. https://csrc.nist.gov/pubs/sp/800/92/final
- CISA, FBI, NSA, and ASD’s ACSC, Best Practices for Event Logging and Threat Detection (2024). https://www.cisa.gov/resources-tools/resources/best-practices-event-logging-and-threat-detection
- AICPA, 2017 Trust Services Criteria (with revised points of focus, 2022). https://www.aicpa-cima.com/resources/download/2017-trust-services-criteria-with-revised-points-of-focus-2022
- SOC 2 CC7.2, Security Event and Anomaly Detection (ISMS.online). https://www.isms.online/soc-2/controls/system-operations-cc7-2-explained/
- SOC 2 CC7.1, Configuration and Vulnerability Management (Alert Logic). https://docs.alertlogic.com/analyze/reports/compliance/SOC2-CC-7.1-configuration-and-vulnerability-management.htm
- 45 CFR 164.312, Technical safeguards (eCFR). https://www.ecfr.gov/current/title-45/subtitle-A/subchapter-C/part-164/subpart-C/section-164.312
- HIPAA 164.312(b) Audit Controls (Alert Logic). https://docs.alertlogic.com/analyze/reports/compliance/HIPAA-164.312-audit-controls.htm
- PCI DSS Requirement 10, logging and monitoring (PCI DSS Guide). https://pcidssguide.com/pci-dss-requirement-10/
- OpenObserve, product overview and FAQ. https://openobserve.ai/
- OpenObserve on GitHub. https://github.com/openobserve/openobserve
- OpenObserve Trust Center. https://security.openobserve.ai/
- Grafana Labs, Observability Survey 2025. https://grafana.com/observability-survey/2025/
- Logz.io, The 2024 Observability Pulse Report. https://logz.io/observability-pulse-2024/
- APMdigest, Challenges and Trends in Observability Adoption 2024. https://www.apmdigest.com/challenges-and-trends-in-observability-adoption-2024
- Techzine, OpenObserve lowers observability storage costs by 140x. https://www.techzine.eu/blogs/analytics/140020/openobserve-lowers-observability-storage-costs-by-140x/
- OpenObserve Pricing. https://openobserve.ai/pricing/
- OpenObserve AI Assistant. https://openobserve.ai/ai-assistant/
- 45 CFR 164.308, Administrative safeguards, risk analysis requirement (eCFR). https://www.ecfr.gov/current/title-45/subtitle-A/subchapter-C/part-164/subpart-C/section-164.308
- OpenObserve, Storage Management. https://openobserve.ai/docs/administration/maintenance/storage-management/
메타데이터
- post_id
- 0ef06b3413ee
- slug
- observability-is-the-backbone-of-compliance-0ef06b3413ee
- url
- https://medium.com/@brooks-security/observability-is-the-backbone-of-compliance-0ef06b3413ee
- canonical_url
- https://medium.com/@brooks-security/observability-is-the-backbone-of-compliance-0ef06b3413ee
- author_url
- https://medium.com/@brooks-security
- status
- ok
- fetched_at
- 2026-08-18 07:58:06