Load and Visualize FlatGeobuf Files Using Deck.gl
If you’re working with geospatial data, you’ve likely encountered the challenges of efficiently handling large datasets. FlatGeobuf is a…
Load and Visualize FlatGeobuf Files Using Deck.gl
If you’re working with geospatial data, you’ve likely encountered the challenges of efficiently handling large datasets. FlatGeobuf is a modern, compact binary format optimized for geospatial data that combines speed and efficiency with compatibility for many GIS tools. Pairing it with Deck.gl, a powerful WebGL-based visualization library, makes for an excellent combo for rendering and interacting with spatial datasets on the web.
In this guide, we’ll walk through the process of fetching FlatGeobuf files, dynamically rendering them with Deck.gl, and creating an interactive map visualization.
FlatGeoBuf
FlatGeobuf stands out as an efficient geospatial data format due to its compact binary structure and optimized performance for both read and write operations. Compared to traditional formats like Shapefile or GeoJSON, FlatGeobuf demonstrates significantly faster read and write speeds, especially when handling large datasets or applying spatial filters. For instance, it outperforms GeoJSON with read times up to 32 times faster and write times 10 times faster, while also maintaining smaller file sizes. Its integrated spatial indexing further enhances query efficiency, making it ideal for applications requiring real-time or large-scale geospatial processing.
Prerequisites
To follow along, you’ll need the following:
- React: This guide assumes you’re using a React app.
- Deck.gl: Installed as a dependency in your project.
- FlatGeobuf: We’ll use the FlatGeobuf library to deserialize
.gfbfiles. - A basic understanding of JavaScript, React, and geospatial concepts.
Step 1: Install Dependencies
Start by installing the required dependencies for Deck.gl and MapLibre (a modern alternative to Mapbox):
npm create vite@latest geospatial-viewer --template react
npm install @deck.gl/react @deck.gl/layers
cd geospatial-viewer
Next, load the FlatGeobuf library via a CDN. This simplifies integration into your project without additional installation steps.
Step 2: Fetch and Deserialize FlatGeobuf Files
FlatGeobuf files are binary, so they need to be deserialized before use. We’ll fetch these files and transform them into GeoJSON format for rendering.
Here’s a React component that fetches and deserializes .fgb files, with proper error handling and a clean setup for local or external assets.
Code: App Component
// src/App.jsx

import React from "react";
import GeospatialViewer from "./GeospatialViewer.jsx";

function App() {
  return (
    <div className="App">
      <GeospatialViewer />
    </div>
  );
}

export default App;
Code: GeospatialViewer Component
// src/GeospatialViewer.jsx

import React, { useEffect, useState } from "react";
import DeckGL from "@deck.gl/react";
import { GeoJsonLayer } from "@deck.gl/layers";

// Author: https://kapilgrv.in

const GeospatialViewer = () => {
  const [layersData, setLayersData] = useState([]);
  const [popupInfo, setPopupInfo] = useState(null);

  // Load FlatGeobuf script and fetch data
  useEffect(() => {
    const loadFlatGeobuf = () => {
      return new Promise((resolve) => {
        const script = document.createElement("script");
        script.src = "https://unpkg.com/flatgeobuf@3.32.0/dist/flatgeobuf-geojson.min.js";
        script.async = true;
        script.onload = () => {
          resolve(window.flatgeobuf.deserialize); // Resolve with the deserialize function
        };
        document.body.appendChild(script);
      });
    };

    const fetchData = async () => {
      const deserialize = await loadFlatGeobuf();
      const layers = [
        { name: "County", url: "https://raw.githubusercontent.com/flatgeobuf/flatgeobuf/refs/heads/master/test/data/UScounties.fgb", color: [255, 0, 0] }
      ];

      const layerDataPromises = layers.map(async (layer) => {
        const response = await fetch(layer.url);
        const fc = { type: "FeatureCollection", features: [] };
        let i = 0;

        // Deserialize the features and store them
        for await (const feature of deserialize(response.body)) {
          fc.features.push({ ...feature, id: i });
          i += 1;
        }

        return { name: layer.name, data: fc, color: layer.color };
      });

      const fetchedLayersData = await Promise.all(layerDataPromises);
      setLayersData(fetchedLayersData);
    };

    fetchData();
  }, []);

  // DeckGL layers setup
  const layers = layersData.map((layerData) => (
    new GeoJsonLayer({
      id: `${layerData.name}-layer`,
      data: layerData.data,
      pickable: true,
      getFillColor: layerData.color, // Set the dynamic color
      getLineColor: [0, 0, 0],
      lineWidthMinPixels: 2,
      onClick: ({ object, x, y }) => {
        if (object) {
          const props = object.properties;
          console.log(props);
          setPopupInfo({
            content: `${layerData.name}: ${props.NAME || "Unnamed"}`,
            coordinates: [x, y],
          });
        } else {
          setPopupInfo(null);  // Clear popup when no object is hovered
        }
      },
    })
  ));

  // Render DeckGL with custom popup
  return (
    <div style={{ height: "100%", width: "100vw" }}>
      <DeckGL
        initialViewState={{
          longitude: -103.63742776900341,
          latitude: 39.39918734640155,
          zoom: 2,
          pitch: 0,
          bearing: 0,
        }}
        layers={layers}
        controller={true}
      />
      {/* Custom Popup */}
      {popupInfo && (
        <div
          style={{
            position: "absolute",
            left: popupInfo.coordinates[0],
            top: popupInfo.coordinates[1],
            backgroundColor: "white",
            color: "black",
            border: "1px solid black",
            padding: "10px",
            zIndex: 1000,
            pointerEvents: "none",
            transform: "translate(-50%, -100%)",
          }}
        >
          {popupInfo.content}
        </div>
      )}
    </div>
  );
};

export default GeospatialViewer;
Now, finally, run the app with the below command:
npm run devConclusion
This workflow combines the efficiency of FlatGeobuf with the visualization power of Deck.gl to handle geospatial data dynamically and interactively. Whether you’re dealing with millions of features or experimenting with new datasets, this setup ensures your app is ready for modern geospatial challenges.
This is how the UI looks.
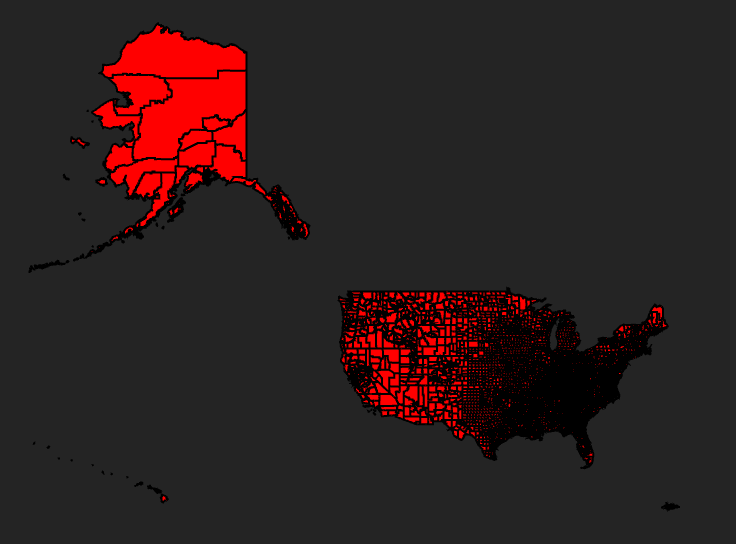
US Counties Plotted using Deck.gl with a fgb file
Try this out in your projects, and let me know your experiences or challenges in the comments!
Happy Mapping! 🎉
Sources for Reference:
[embed]FlatGeobuf A performant binary encoding for geographic data based on flatbuffersflatgeobuf.org
메타데이터
- post_id
- 0fb1292a903e
- slug
- load-and-visualize-flatgeobuf-files-using-deck-gl-0fb1292a903e
- url
- https://medium.com/@kapilgrv/load-and-visualize-flatgeobuf-files-using-deck-gl-0fb1292a903e
- canonical_url
- https://medium.com/@kapilgrv/load-and-visualize-flatgeobuf-files-using-deck-gl-0fb1292a903e
- author_url
- https://medium.com/@kapilgrv
- status
- ok
- fetched_at
- 2026-07-22 02:17:40