Concession Prices and Winning in the NBA: A deservedly unexplored story
Do concession prices correlate with winning in the NBA? Are teams charging fans premium prices because they win…or despite losing?
Concession Prices and Winning in the NBA: A deservedly unexplored story
Do concession prices correlate with winning in the NBA? Are teams charging fans premium prices because they win…or despite losing?
That is exactly what I set to find out in building a dashboard looking at this very unusual relationship. Now with me not (at the time) having the data for the current concession prices for the 25/26 NBA season, I decided to use the previous season (24/25 NBA season), which had already been completed, as the basis of my research.
I set out scouring data and using sources like yahoo sports for which NBA arenas were the costliest for beers and hot dogs. I worked with the 9 of the most expensive teams to buy a hot dog and beer in the league, that is season total spent if one person were to buy exactly one of each item for 41 home games…the top 9 teams in that aspect. After doing that, I set out to create my own excel sheet using the data I gathered. I created an excel file that consisted of features; Beer prices, hot dog prices, season records, home wins and home win percentages. It was also quite the experience using conditional formatting in excel to highlight some visual information, especially in the aspect of the more numerically inclined features like Home win Pct and Season Total (again referring to the total spent if one person were to buy exactly one of each item for 41 home games). I also created some columns using the the excel formula bar, this in particular was applied to the season total and Home record Pct columns.
Wrapping up with creating my Excel sheet, I turned my attention to creating a dashboard on Tableau…and of course, I started with importing the data for use. A bit of an interesting thing I did on Tableau was creating a calculated measure called the fan cost index (per game), which was basically to look at expenditure on the quoted concessions per game. Once that was done, I set out to work on my individual visuals on sheets. The first was a scatterplot quadrant where I plotted their entire season record percentage against beer and hot dog prices across home games. The basis for the quadrant line was on the average of all the quoted prices of the 9 NBA franchises, I deliberated on using median, but I was working with just 3% of the league, so I stuck with the average. Had it been I was working with the entire league data, I would definitely have used the median as the basis of quadrant lines. My second sheet was a visual looking at side-by-side bar charts of the beer and hot dog prices for the various franchises. The third sheet was a horizontal bar chart looking at the winning percentages of the teams. The fourth sheet was abar chart, this time a vertical one, looking at the fan index cost of the various NBA franchises considered for this project. With my sheets ready to go I set out to create my dashboar…wait a minute, the purpose of creating this entire dashboard was to see if concession prices correlated to winning in any way, and I was working with concessions sold at NBA arenas. surely, It would make sense to include the home record, and home record percentage for good measure as well.
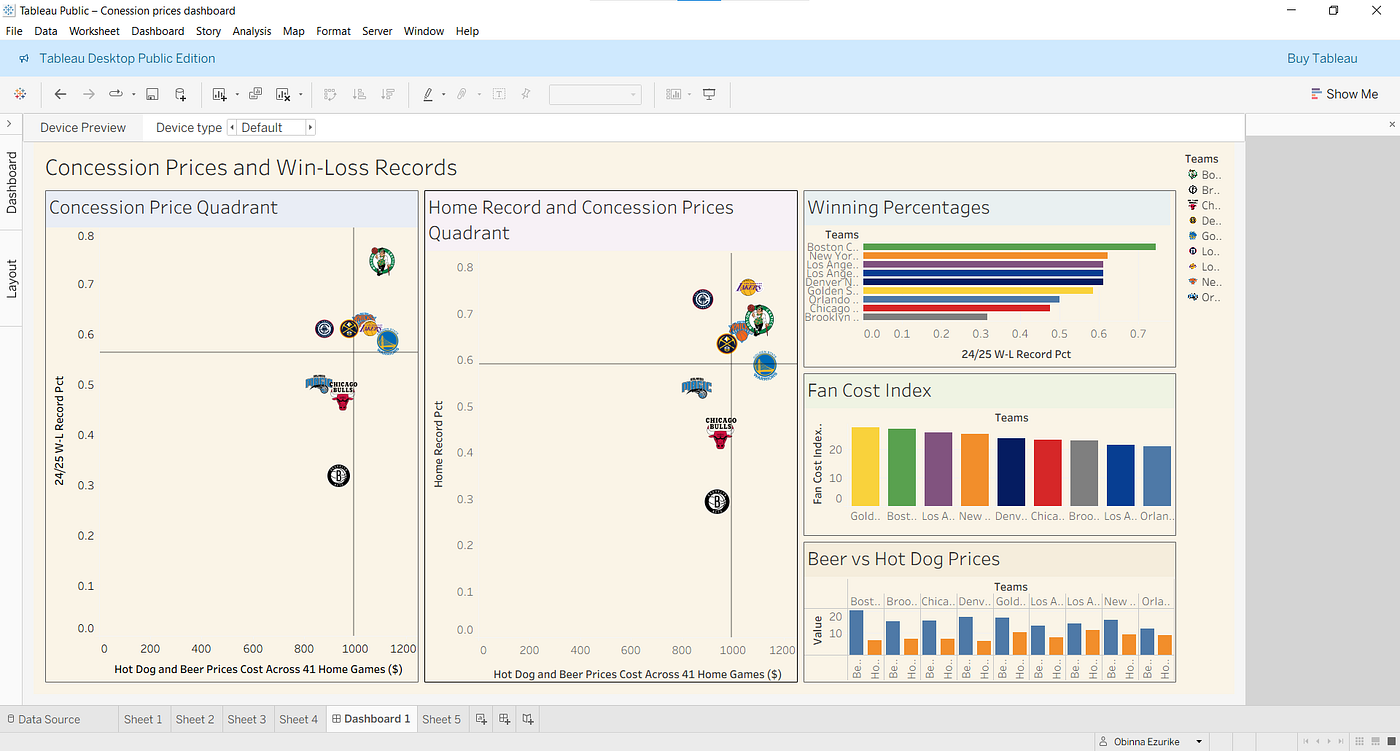

So, I went back to my excel sheet to add columns to address that. Then, I had to refresh my data source to make sure it was reflected (I had a headache with this one!) and then I had to add another worksheet where I looked at the relationship between concession prices in home games and home records on a scatterplot. Now, a bit of interesting thing to note when looking at the scatterplot relationships is how there is a lot less of a change. The teams in the bottom left of the quadrant, the expensive concession price teams with not too much winning remained in almost their exact spots. The bottom right of the quadrant? Empty…save for the Golden state warriors inching on the precipice of the top an bottom of the right hand side. Now the top-half of the quadrants is where things shuffle a bit. especially with the two juggernaut rivals of the Celtics and Lakers who swap as the best performing teams across the entirety of the league and at home respectively. What was I hoping to find? I was hoping to find if there could be a correlation between concession prices and team success, and for all the mini-fanfare I paraded around in my head, there doesn’t seem to be much in that. Just one big nothing burger. After all this work, the answer was clear: expensive beer doesn’t buy wins. But hey, at least the dashboard (please click the awesome link on the word dashboard for a more interactive experience) looks great.
메타데이터
- post_id
- 11e87f335430
- slug
- concession-prices-and-winning-in-the-nba-a-deservedly-unexplored-story-11e87f335430
- url
- https://medium.com/@stanleyezurike87/concession-prices-and-winning-in-the-nba-a-deservedly-unexplored-story-11e87f335430
- canonical_url
- https://medium.com/@stanleyezurike87/concession-prices-and-winning-in-the-nba-a-deservedly-unexplored-story-11e87f335430
- author_url
- https://medium.com/@stanleyezurike87
- status
- ok
- fetched_at
- 2026-08-05 15:39:32