From Tanks to Tokens: How a WWII Statistics Trick Powers Modern Cyber Defense
The German Tank Problem, unseen populations, and why estimating the invisible still matters for cybersecurity, data science, and…
From Tanks to Tokens: How a WWII Statistics Trick Powers Modern Cyber Defense
The German Tank Problem, unseen populations, and why estimating the invisible still matters for cybersecurity, data science, and intelligence.
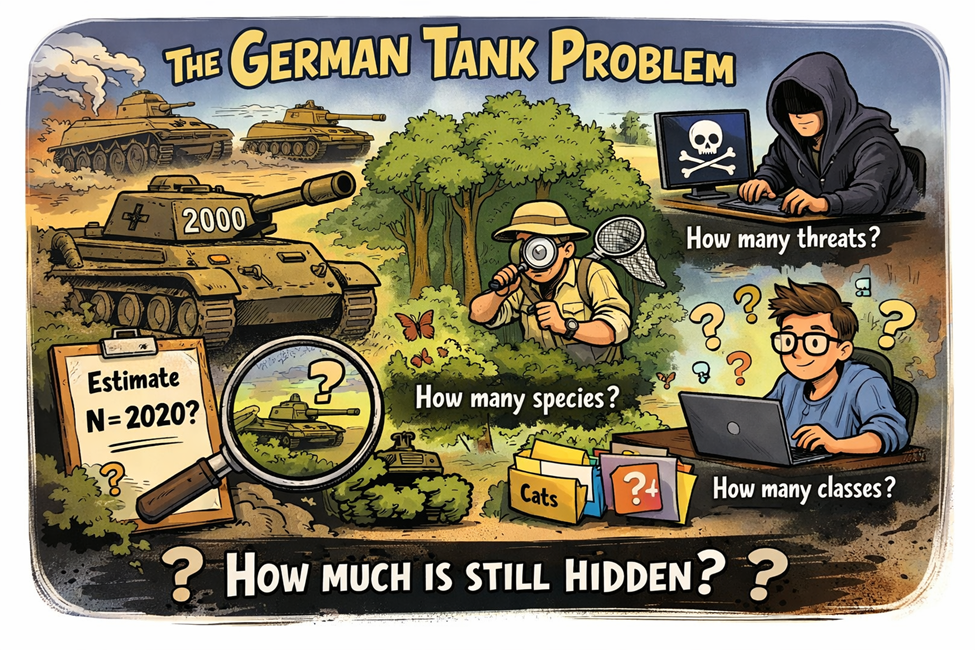
How a WWII Equation Became a Secret Weapon in Cyber Defense
*“If you know the enemy and know yourself, you need not fear the result of a hundred battles. If you know yourself but not the enemy, for every victory gained, you will also suffer a defeat. If you know neither the enemy nor yourself, you will succumb in every battle.”
- — Sun Tzu, The Art of War
The quote has become a cliché through repetition, yet its truth remains the backbone of strategic thinking and intelligence gathering. In 1942, this ancient insight ceased to be philosophy and became a practical problem for British intelligence. The Allies knew their own strength in meticulous detail, yet the true size of the German armored force remained a dangerously uncertain quantity. How many tanks were being produced? Were reinforcements finite, or effectively endless? Direct observation was impossible. What remained were fragments, captured vehicles, battlefield wreckage, and faint trails of serial numbers stamped into steel. From these scattered clues, statisticians attempted something audacious: to reconstruct the scale of an entire war machine using only partial, biased information. The method they developed would later become known as the German Tank Problem, and its logic now quietly underpins modern approaches to cybersecurity, data science, and the detection of unseen threats.
The British Army understood its own strength with precision. They knew how many tanks rested in depots, how many advanced across North Africa, and how many could be mobilized if the war intensified. What they did not know, and what unsettled every strategic calculation, was the enemy’s true scale. How many tanks did Germany actually possess? Was its industrial output accelerating beyond reach, or bounded by hard limits? Were reinforcements effectively infinite, or quietly finite?
The total was unknown. But not everything was dark.
Scattered across battlefields and captured equipment were fragments of information: serial numbers, small steel-stamped traces of an industrial process designed for order, not secrecy. Each fragment was insignificant on its own, vanishingly small compared to the Reich’s total production. Yet taken together, they carried structure. Pattern. Signal.
What appeared impossible became measurable. From a handful of digits, Allied analysts reconstructed the size of an entire war machine, demonstrating that, in the hands of a skilled statistician, fragments can be enough.
To see how these scattered numbers were transformed into actionable intelligence, we now turn to the statistical model behind the inference.
The Statistical Model
Assume Germany produced a total of (N) tanks (unknown). We capture or observe a sample of (k) tanks. Let M be the largest serial number observed.
Modeling assumptions
- Unique serial numbers No two tanks share the same number → sampling without replacement
- Uniform capture probability Every tank is equally likely to be observed
Under these assumptions, almost all information about (N) is contained in the maximum serial number (M). These are the only assumptions we will rely on throughout this post, nothing more, nothing less.
Distribution of the Maximum
Using basic combinatorics,
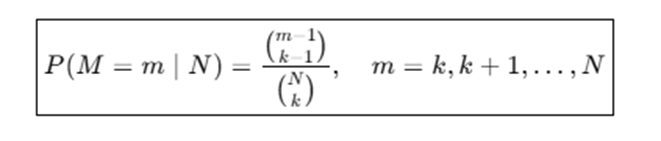
This means that to observe maximum (m):
• One tank must have a serial (m) • The remaining (k-1) must be drawn from ({1,…,m-1})
Our next step is to calculate the expected value of M
Expected Value
Taking expectation,
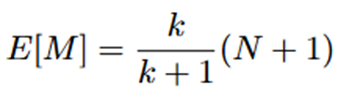
Meaning: On average, the largest observed serial reaches k/(k+1) of the way from 1 to (N+1).
If we solve it to N, we will estimate the number of tanks.
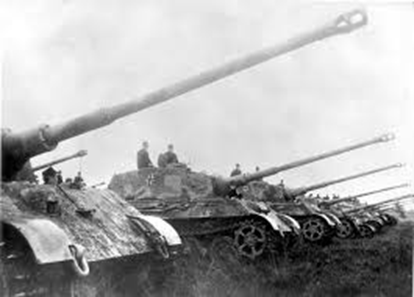
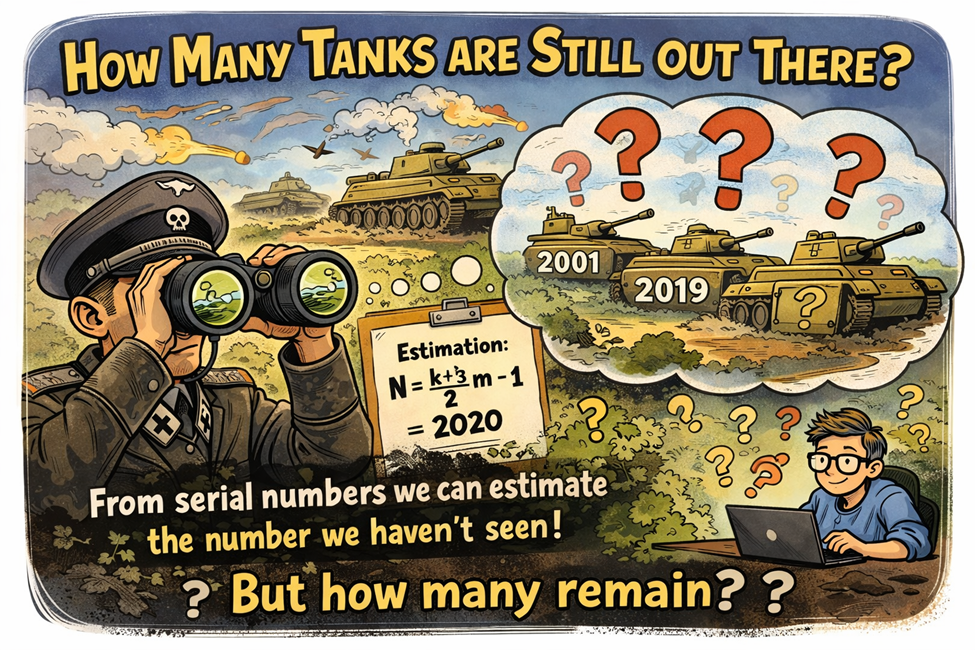
German tanks in WW2
The German Tank Estimator
Solving for (N):
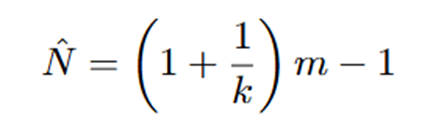
It is important to note that this estimator is unbiased; on average, it neither overestimates nor underestimates the true production size.
Yet in military intelligence, the expected value alone is not enough. Commanders are not only interested in what is likely, but in what is risky. They must understand the uncertainty around the estimate: how far it might deviate, and with what probability
How Reliable Is It?
Since we avoid making any sophisticated assumptions about the underlying distribution, we must rely on classical tools. In particular, we turn to Chebyshev’s inequality, which provides a universal bound on uncertainty, requiring only that the variance exists.
Namely,

This inequality may be blunt, but it is honest: it makes no promises it cannot keep.
To apply this bound, we must first compute the variance of the estimator, which is given by
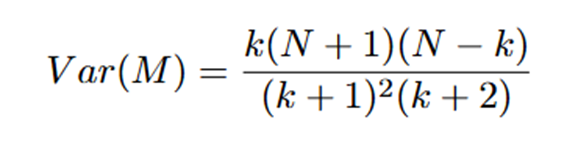
Substituting variance in Chebyshev’s inequality, we have:

In other words, we do not merely obtain an estimator; we also gain a high-probability bound around it. Remarkably, this guarantee requires no assumptions about the data beyond those already stated.
This means we can precisely quantify uncertainty, even in the absence of detailed knowledge about the underlying production process. The estimate tells us where the truth likely lies; the bound tells us how confident we can be in that estimate.
To give a clearer intuition, let’s look at some concrete numbers:
Numerical example
Now consider a concrete intelligence snapshot. Suppose Allied forces capture k = 100 German tanks, and the highest serial number observed among them is m = 2000. Applying the German Tank estimator, analysts infer that total wartime production was just over 2,000 tanks, a figure far smaller and more constrained than feared.
But the true power of the method lies not in the point estimate alone, but in its ability to quantify risk.
With 90% confidence, German production did not exceed 2,082 tanks. With 95% confidence, the upper bound rises modestly to 2,110 tanks. Even under a 99% confidence threshold, total production remains below 2,220 tanks.
In other words, this was not guesswork. From a limited and uncertain sample, Allied intelligence could place firm, probabilistic bounds on the enemy’s industrial capacity — transforming fragments of data into strategic certainty.
From Tanks to Tokens
This entire analysis balances on a fragile assumption: that fate treats every tank equally. That each machine has the same chance of falling into enemy hands. But war does not play fair. Engines fail in the dust, units are quietly scrapped, serial numbers vanish by design, and deception becomes doctrine. Behind the numbers lurk unseen decisions and battlefield chaos, bending the data, warping the sample, and turning elegant mathematics into a struggle against hidden bias.
However, because complex logistics require orderly records, we can generally assume serial numbers remain unique and sequential.
The “Species Problem”
This challenge, estimating a total population from a biased sample, is known in statistics as the Species Problem. It connects three seemingly different fields:
- Ecology: Estimating how many species live in a forest when many stay hidden.
- Cybersecurity: Predicting the number of undetected malware variants or botnets.
- Data Science: Inferring the total number of classes or tokens in a dataset based on limited training data.
Recovering the true serial numbering scheme is, of course, far from trivial. Still, practitioners in the field maintain that good approximations are often achievable. The details of how this is done belong to a different expertise than mine, so I will resist the temptation to speculate.
Flipping the Logic
While the classic Coupon Collector’s Problem asks how long it takes to find every item in a known set, we are doing the reverse: using a small, observed subset to reveal the scale of the unknown.
Whether counting tanks, insects, or active users, the mathematical heart is the same: What does what we see tell us about what remains hidden?
Closing remarks
In this post, I chose to omit the detailed probability calculations to maintain a smooth narrative flow. However, in an introductory probability and statistics course, working through these computations would be highly valuable. They offer an excellent real-world example of how abstract concepts from the syllabus translate into practical applications.
I want to thank my dear friend Chen Z for his support, friendship, and for pointing out this interesting question.
메타데이터
- post_id
- 11ed79639eb7
- slug
- from-tanks-to-tokens-how-a-wwii-statistics-trick-powers-modern-cyber-defense-11ed79639eb7
- url
- https://medium.com/@uriitai/from-tanks-to-tokens-how-a-wwii-statistics-trick-powers-modern-cyber-defense-11ed79639eb7
- canonical_url
- https://medium.com/@uriitai/from-tanks-to-tokens-how-a-wwii-statistics-trick-powers-modern-cyber-defense-11ed79639eb7
- author_url
- https://medium.com/@uriitai
- status
- ok
- fetched_at
- 2026-07-13 06:23:13