Where is my Datadog APM Trace?
It started with a simple observation: some requests I was sending through Postman never showed up in Datadog traces.
Where is my Datadog APM Trace?
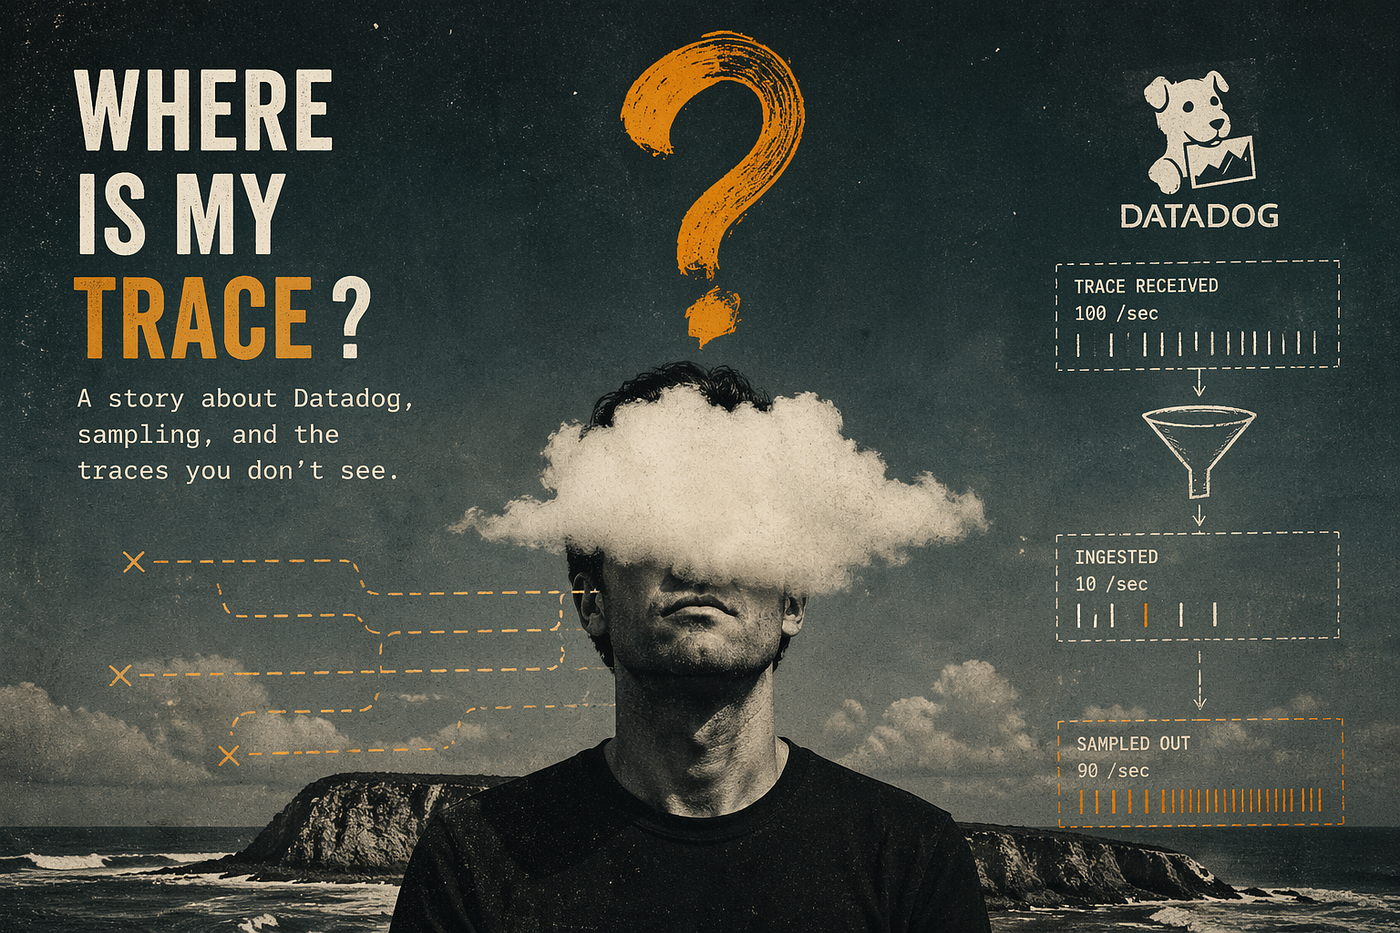
It started with a simple observation: some requests I was sending through Postman never showed up in Datadog traces.
At first, I assumed something was broken in the instrumentation. Maybe the service wasn’t properly configured, or the traces weren’t reaching the agent.
But the deeper I looked, the clearer it became: nothing was broken. Everything was working exactly as designed.
The problem was sampling.
The Invisible Filter Between Your Requests and Datadog
What I had overlooked is that Datadog does not store every trace it receives.
Instead, it samples aggressively:
- Services can send ~100 traces/sec to the Agent
- The Agent typically keeps ~10 traces/sec
In a Kubernetes environment, this gets amplified in a subtle but dangerous way. You don’t have one workload — you have hundreds of pods competing for a very limited trace budget.
In my case, the math was brutal:
- 19 nodes × ~10 traces/sec ≈ 190 traces/sec retained
- ~927 pods generating traffic
So in practice:
Only about 20% of requests were actually making it into Datadog
And it wasn’t random either.
The Silent Bias of Adaptive Sampling
Datadog doesn’t just sample uniformly. It applies adaptive sampling, which favors less frequent operations and penalizes noisy ones.
That means:
/healthendpoints get down-prioritized because they are extremely frequent- GraphQL and search endpoints often get heavily thinned out
- The more an endpoint is called, the less likely you are to see it
This creates an uncomfortable illusion:
The endpoints you think you are observing are often the least visible ones in practice.
The First Wrong Idea: Just Remove /health
A natural reaction is: “Let’s just exclude /health entirely from tracing.”
It works — on paper.
But in reality, it creates a blind spot.
Health endpoints are boring until they aren’t. When they fail, they often signal the first sign of real production issues. Removing them entirely means losing visibility exactly when you need it most.
So instead of removing noise, I needed a way to preserve failure signals without flooding the system.
A Better Approach: Keep the Noise, Elevate the Failures
The solution I ended up with was more surgical: keep /health traces, but force priority when something goes wrong.
Instead of treating all requests equally, I started explicitly upgrading failed ones.
Here’s the filter I used:
import atadog.trace.api.interceptor.MutableSpan;
import datadog.trace.api.GlobalTracer;
import javax.servlet.*;
import javax.servlet.http.HttpServletResponse;
import java.io.IOException;
public class DatadogHealthFilter implements Filter {
    @Override
    public void doFilter(ServletRequest request, ServletResponse response, FilterChain chain)
            throws IOException, ServletException {
        chain.doFilter(request, response);
        if (response instanceof HttpServletResponse res) {
            int status = res.getStatus();
            if (status >= 500) {
                MutableSpan span = (MutableSpan) GlobalTracer.get().activeSpan();
                if (span != null) {
                    span.setSamplingPriority(1); // force keep
                }
            }
        }
    }
}
@Bean
public FilterRegistrationBean<DatadogHealthFilter> healthFilter() {
FilterRegistrationBean<DatadogHealthFilter> reg = new FilterRegistrationBean<>();
reg.setFilter(new DatadogHealthFilter());
reg.addUrlPatterns("/actuator/health");
return reg;
}What This Actually Changed
This small adjustment shifted the model:
- Normal health checks → still cheap, still sampled
- Failed health checks → always retained
- No explosion in trace volume
- No loss of critical failure visibility
In other words, I stopped treating observability as binary (“trace or don’t trace”) and started treating it as prioritized signal engineering.
Final Insight
The real lesson wasn’t about Datadog configuration.
It was this:
In distributed systems, observability is not about collecting everything — it’s about deciding what deserves to survive the sampling filter.
Once you accept that, the goal changes: not “why am I missing traces?”, but “what signals are important enough to never lose?”
메타데이터
- post_id
- 12ef99475cbf
- slug
- where-is-my-datadog-apm-trace-12ef99475cbf
- url
- https://medium.com/@davidecerbo/where-is-my-datadog-apm-trace-12ef99475cbf
- canonical_url
- https://medium.com/@davidecerbo/where-is-my-datadog-apm-trace-12ef99475cbf
- author_url
- https://medium.com/@davidecerbo
- status
- ok
- fetched_at
- 2026-06-09 15:37:30