The Data Maturity Journey Explained: A Practical Guide to the 5 Stages of the Data Maturity…
In Brief
The Data Maturity Journey Explained: A Practical Guide to the 5 Stages of the Data Maturity Framework
In Brief
The data maturity framework helps organizations understand how effectively they use data to drive decisions, improve operations, and enable AI initiatives. Instead of focusing only on tools, it evaluates capabilities across governance, infrastructure, analytics adoption, and data culture.
This guide breaks down the five stages of the data maturity model — from basic reporting to AI-driven innovation — and explains how organizations can assess their current stage, identify gaps, and build a practical roadmap for progress. It also highlights common mistakes that slow maturity and the key dimensions that influence scalable analytics.
As data becomes central to business strategy, improving data maturity allows teams to move faster, trust insights, and embed analytics into everyday workflows, creating a strong foundation for continuous innovation.
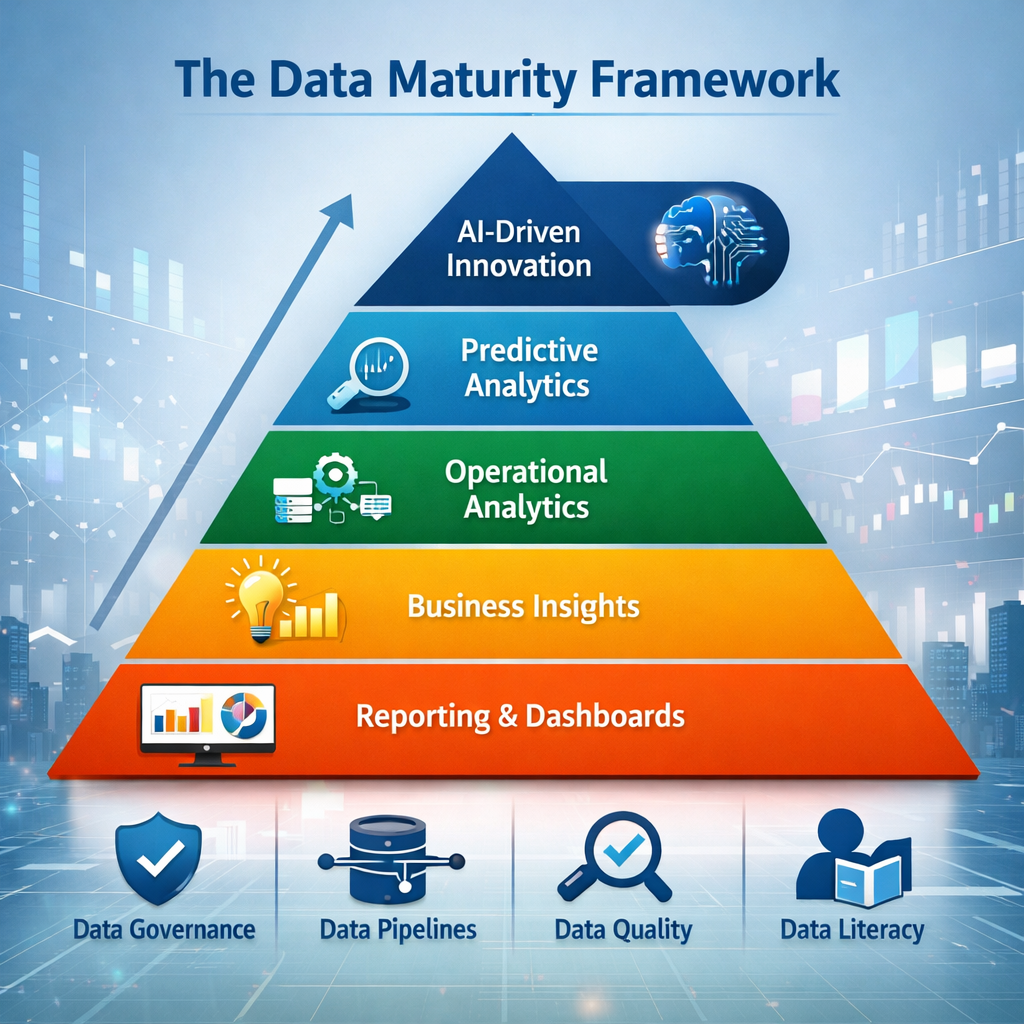
Organizations are generating more data than at any point in history, yet many still struggle to convert that data into measurable business value. The challenge is rarely data availability — it is data maturity. A structured data maturity framework helps companies understand how effectively they collect, manage, govern, and operationalize data across the enterprise.
The shift toward AI-driven decision-making has made data maturity a strategic requirement rather than a technical initiative. Companies that operate at higher maturity levels move faster, experiment more confidently, and embed analytics directly into workflows instead of treating reporting as an afterthought.
A data maturity model provides that structure. It maps the progression from basic reporting to advanced innovation, showing how organizations evolve from asking “what happened” to predicting “what will happen” and ultimately designing entirely new products and business models using data. Frameworks validated across thousands of organizations consistently describe maturity as a staged journey where each level builds foundational capabilities for the next.
In this guide, we break down the five stages of the data maturity framework, explain what each stage looks like in practice, and outline how organizations can move from fragmented reporting to continuous data-driven innovation.
What Is a Data Maturity Framework?
A data maturity framework is a structured model that helps organizations evaluate how effectively they collect, manage, govern, analyze, and operationalize data across business functions. Instead of viewing data as a by-product of operations, the framework positions data as a strategic asset that evolves through defined capability stages.
At its core, the data maturity framework measures an organization’s ability to move from descriptive reporting to predictive and prescriptive decision-making. It evaluates not only technology but also organizational culture, data governance practices, data quality standards, and the degree to which analytics is embedded into everyday workflows.
Modern enterprises increasingly use data maturity assessment models to answer critical questions: Are teams making decisions based on trusted data? Is data accessible across departments? Can analytics scale without heavy manual effort? And most importantly, is the organization ready for AI adoption?
Research shows that organizations with high data maturity are significantly more likely to outperform competitors on revenue growth and operational efficiency because they reduce decision latency and automate insight generation. According to NewVantage Partners’ Data & AI Leadership Executive Survey, only about 26% of organizations report being truly data-driven, highlighting a large maturity gap across industries.
A comprehensive data maturity model typically evaluates four interconnected dimensions:
- people — data literacy, ownership, and cross-functional collaboration
- process — governance, standardization, and data lifecycle management
- technology — data platforms, BI tools, pipelines, and automation
- strategy — alignment between business goals and analytics initiatives
Understanding these dimensions is essential because maturity is not achieved by tools alone. Many organizations invest heavily in BI dashboards or cloud data platforms but remain stuck in early maturity stages due to inconsistent governance or lack of adoption.
It is also important to distinguish between data maturity and analytics maturity. Data maturity focuses on the foundation — data availability, quality, and governance — while analytics maturity focuses on how insights are generated and operationalized. The two progress together, but without strong data maturity, advanced analytics initiatives struggle to scale.
This is why leading enterprises treat the data maturity framework as a roadmap rather than a scorecard. It identifies capability gaps, prioritizes investments, and provides a clear path toward building a data-driven organization.
Why Organizations Must Measure Data Maturity
Measuring data maturity allows organizations to move from intuition-based decision-making to systematic, evidence-driven execution. Without a maturity benchmark, data initiatives often remain fragmented, resulting in duplicated dashboards, inconsistent metrics, and delayed insights.
One of the biggest drivers is decision velocity. Companies operating at higher data maturity levels shorten the time between question and insight, enabling faster experimentation and more responsive strategy shifts. This directly impacts revenue optimization, customer experience, and operational efficiency.
Another critical reason is AI readiness. Generative AI, predictive analytics, and automation rely heavily on clean, governed, and well-integrated data. Organizations that skip maturity development often face stalled AI initiatives because foundational data infrastructure is not reliable.
Gartner estimates that poor data quality costs organizations an average of **$12.9 million per year**, demonstrating how maturity gaps translate into financial impact.
Measuring enterprise data maturity also improves alignment across leadership teams. It provides a shared language between business stakeholders, data teams, and IT, ensuring that investments focus on capability building rather than isolated tooling.
Additional benefits include:
- improved data governance maturity levels and compliance readiness
- scalable self-service analytics adoption
- reduced reporting overhead through automation
- stronger data culture and literacy
- clearer ROI tracking for data initiatives
Organizations that regularly perform data maturity assessments are better positioned to prioritize modernization efforts, whether that means implementing a semantic layer, standardizing metrics, or introducing real-time analytics pipelines.
Ultimately, the purpose of measuring data maturity is not evaluation — it is transformation. It enables companies to design a practical data maturity roadmap that moves them from reactive reporting toward proactive and predictive decision systems.
The 5 Stages of the Data Maturity Framework (Deep Breakdown)
The data maturity framework describes a progressive journey where organizations evolve from basic data collection to fully integrated, AI-driven decision ecosystems. Each stage reflects improvements in data governance, infrastructure, analytics capabilities, and organizational adoption.
Understanding these data maturity model stages helps leaders identify capability gaps, prioritize investments, and design a realistic data maturity roadmap instead of attempting large-scale transformation all at once.
Stage 1 — Reporting / Initial (Data Collection Stage)
At the initial stage, organizations primarily focus on collecting and storing data. Reporting is manual, fragmented, and often dependent on spreadsheets or disconnected business intelligence tools. Teams operate in silos, and metrics are rarely standardized.
Common characteristics:
- Data exists across multiple systems with limited integration
- Reporting is reactive and time-consuming
- Data quality issues are frequent
- Decision-making relies heavily on intuition
Technology usage at this stage is tool-driven rather than strategy-driven. Dashboards answer basic descriptive questions like what happened but cannot explain why.
The biggest challenge is trust. When stakeholders do not trust data, adoption remains low, preventing maturity progression.
What moves organizations forward: establishing data ownership, defining core KPIs, and creating a centralized data foundation.
Stage 2 — Analyzing / Managed (Insight Stage)
At this stage, organizations begin integrating data sources and standardizing reporting processes. Business intelligence becomes more consistent, and teams start using analytics to understand trends and performance drivers.
Key characteristics:
- Centralized dashboards replace manual reporting
- Basic data governance practices emerge
- Metrics definitions become standardized
- Analysts spend less time preparing data and more time interpreting it
Organizations shift from descriptive reporting to diagnostic analytics — answering why something happened rather than just what happened.
However, data access is still controlled by specialized teams, creating bottlenecks. Self-service analytics adoption remains limited, and advanced use cases are difficult to scale.
Next step: building scalable data pipelines, improving data quality monitoring, and enabling broader access.
Stage 3 — Optimizing / Standardized (Operational Stage)
In the standardized stage, data becomes embedded into operational workflows rather than existing only in dashboards. Organizations establish consistent data governance frameworks, automated pipelines, and shared semantic layers.
Key characteristics:
- Automated reporting reduces manual effort
- Data definitions are documented and enforced
- Cross-functional data sharing improves
- Operational teams use analytics for daily decisions
This stage marks a shift toward operational analytics, where insights influence processes such as marketing optimization, supply chain planning, and product experimentation.
Challenges often include scaling infrastructure, managing growing data volume, and improving data literacy across teams.
Progression focus: enable self-service analytics, introduce real-time data capabilities, and align analytics with business strategy.
Stage 4 — Empowered / Data-Driven (Predictive Stage)
Organizations at this level treat data as a strategic asset. Decision-making becomes proactive, supported by predictive analytics, experimentation frameworks, and advanced modeling.
Key characteristics:
- Self-service analytics is widely adopted
- Predictive models support planning and forecasting
- Data governance is mature and automated
- Business teams collaborate closely with data teams
Insights move upstream — influencing strategy rather than validating past decisions. Organizations begin using scenario modeling, customer segmentation, and forecasting to guide resource allocation.
The primary challenge shifts from infrastructure to change management. Scaling adoption, ensuring model reliability, and maintaining governance across distributed teams become critical.
Next evolution: operationalizing machine learning, introducing AI-driven automation, and creating continuous insight loops.
Stage 5 — Innovating / Optimized (AI-Driven Stage)
The highest level of enterprise data maturity is characterized by continuous innovation powered by data and AI. Analytics is deeply embedded into products, workflows, and strategic planning.
Key characteristics:
- Real-time decision systems
- AI and machine learning integrated into operations
- Data products and internal platforms emerge
- Automated insight generation reduces manual analysis
Organizations no longer ask whether to use data — they design business models around it. Data becomes a competitive differentiator, enabling personalization, dynamic optimization, and rapid experimentation at scale.
Governance evolves into policy-driven automation, ensuring compliance and trust without slowing innovation.
The focus at this stage is sustainability: maintaining data quality, monitoring models, and continuously evolving architecture to support new use cases.
These five data maturity framework stages illustrate that maturity is not about reaching a final state. It is about building repeatable capabilities that allow organizations to adapt as technology, data volume, and business priorities evolve.
Key Dimensions That Influence Data Maturity
Progressing through the data maturity framework is not determined by a single factor such as tooling or analytics talent. True enterprise data maturity emerges from the alignment of multiple capability dimensions that work together to support reliable, scalable, and actionable data use.
Organizations that advance faster typically focus on strengthening these dimensions simultaneously rather than optimizing one area in isolation.
Data Governance
Data governance maturity defines how consistently data is defined, managed, secured, and monitored across the organization. Without governance, metrics become inconsistent, trust declines, and analytics adoption slows.
High-maturity organizations establish:
- standardized metric definitions and semantic layers
- clear data ownership and stewardship
- automated data quality monitoring
- access control and compliance workflows
Governance shifts from manual review to policy-driven automation as maturity increases, enabling scale without sacrificing trust.
Data Quality and Reliability
Data quality directly impacts decision confidence. Organizations in early stages often struggle with missing values, duplication, and inconsistent schemas, which leads to repeated validation work by analysts.
Improving data quality maturity involves:
- pipeline validation checks
- anomaly detection
- lineage tracking
- observability practices
Reliable data reduces reporting friction and enables advanced analytics such as forecasting and machine learning to operate effectively.
Technology and Infrastructure
Technology acts as the enabler of data maturity rather than the driver. Modern data maturity models emphasize building flexible, modular architecture that supports integration, automation, and scalability.
Typical infrastructure evolution includes:
- centralized data warehouses or lakehouses
- automated ELT pipelines
- real-time streaming capabilities
- semantic modeling layers for consistent analytics
The goal is not tool adoption but reducing time between data generation and insight delivery.
Data Culture and Literacy
One of the most underestimated maturity dimensions is organizational behavior. Even with strong infrastructure, maturity stalls if business teams cannot interpret or trust data.
A strong data culture includes:
- widespread data literacy training
- leadership using data in decision forums
- shared KPIs across departments
- experimentation mindset
As literacy improves, analytics shifts from specialist activity to everyday workflow.
Automation and AI Enablement
Higher maturity stages introduce automation across the analytics lifecycle — from ingestion and transformation to insight generation. AI readiness depends heavily on this dimension.
Capabilities include:
- automated reporting and alerting
- predictive modeling integration
- decision automation workflows
- embedded analytics in products
Automation reduces manual analysis overhead and allows teams to focus on strategy rather than data preparation.
These dimensions explain why organizations can appear technologically advanced yet remain low in data maturity. The framework requires balanced progress across governance, infrastructure, people, and processes.
Strengthening these areas creates the foundation needed for scalable analytics, predictive decision-making, and AI adoption.
How to Assess Your Organization’s Data Maturity
A structured data maturity assessment helps organizations understand their current capabilities, identify gaps, and define a realistic data maturity roadmap. Rather than relying on perception, mature organizations evaluate data across governance, infrastructure, analytics adoption, and cultural readiness using measurable indicators.
The goal of assessment is not classification but prioritization — determining which capabilities unlock the most value in the next stage of the data maturity framework.
Below is a practical checklist used by data leaders to evaluate enterprise data maturity.
Data Strategy and Leadership Alignment
Start by assessing whether data initiatives are tied to business objectives or operating as isolated technical projects.
Key questions:
- Are executive decisions supported by standardized metrics?
- Is there a documented data strategy aligned with growth priorities?
- Are data owners defined for critical domains?
- Are data investments evaluated based on business impact?
Organizations stuck in early stages often lack clear ownership and long-term planning.
Data Infrastructure and Integration
This dimension evaluates how efficiently data flows across systems and whether pipelines can scale.
Assessment indicators:
- Existence of centralized storage such as a warehouse or lakehouse
- Automated ingestion pipelines instead of manual extracts
- Integration across core business systems
- Ability to support near real-time analytics
Infrastructure maturity determines how quickly new analytics use cases can be deployed.
Data Governance and Quality Controls
Governance maturity ensures that insights are consistent and trusted across teams.
Evaluate:
- Standardized KPI definitions
- Data catalog or documentation availability
- Monitoring for pipeline failures and anomalies
- Access control and compliance processes
Organizations with weak governance often experience duplicated dashboards and conflicting reports.
Analytics Adoption and Self-Service
This area measures how widely data is used beyond specialized teams.
Signals of higher maturity:
- Business users independently exploring dashboards
- Consistent metric usage across departments
- Operational teams using analytics for daily workflows
- Reduced reliance on ad-hoc analyst requests
Low adoption typically indicates usability or trust gaps rather than technology limitations.
Automation, Advanced Analytics, and AI Readiness
The final dimension assesses readiness for predictive analytics and AI-driven decision systems.
Indicators include:
- Automated reporting and alerts
- Forecasting models in production
- Experimentation frameworks
- Embedded analytics within products or workflows
Organizations approaching advanced stages treat analytics as part of execution, not reporting.
Interpreting Your Assessment
After evaluating each dimension, organizations can map capabilities to the appropriate data maturity model stage. Most enterprises operate across multiple stages simultaneously — for example, strong infrastructure but limited data literacy.
The objective is to identify the constraint that prevents progression. For some, it is governance; for others, adoption or pipeline scalability.
A practical data maturity assessment highlights these constraints and enables incremental improvements rather than large disruptive transformations.
Common Mistakes That Slow Down Data Maturity
Many organizations invest heavily in analytics tools, cloud platforms, and data hiring yet struggle to progress through the data maturity framework. The issue is rarely lack of effort — it is misaligned priorities and structural gaps that prevent capabilities from scaling.
Recognizing these common mistakes helps organizations avoid stalled transformation and build a sustainable data maturity roadmap.
Treating Tools as the Strategy
One of the most frequent mistakes is assuming that implementing a modern data stack automatically improves data maturity. Organizations deploy warehouses, BI platforms, and orchestration tools but fail to standardize metrics, define ownership, or drive adoption.
Without governance and process alignment, tooling increases complexity rather than capability. Mature organizations treat technology as an enabler of clearly defined data workflows.
Lack of Clear Data Ownership
When ownership is undefined, data quality issues persist, documentation remains incomplete, and teams duplicate effort. Metrics become inconsistent because no single source of truth exists.
High-maturity organizations assign domain owners, establish stewardship models, and define accountability for data lifecycle management.
Ownership transforms data from a shared responsibility into a managed asset.
Siloed Analytics Teams
Another maturity blocker is isolating analytics within specialized teams. When business functions rely entirely on analysts for insights, decision speed slows and experimentation becomes difficult.
Organizations progress faster when they shift toward a hub-and-spoke model — centralized standards combined with decentralized access. This enables self-service analytics while maintaining governance.
Ignoring Data Literacy
Infrastructure improvements often outpace user capability. Dashboards exist, but stakeholders cannot interpret metrics, question anomalies, or translate insights into action.
Low data literacy reduces trust and limits adoption, keeping organizations stuck in reporting-focused stages.
Investing in literacy programs, shared definitions, and training accelerates maturity more than adding additional dashboards.
Overlooking Data Quality and Observability
Many organizations attempt predictive analytics before stabilizing foundational data quality. This results in unreliable models, manual validation, and loss of stakeholder confidence.
Mature data strategies prioritize observability, lineage tracking, and automated validation to ensure that downstream analytics operate on trusted data.
Trying to Transform Everything at Once
Large transformation initiatives often fail because they attempt to redesign architecture, governance, and culture simultaneously. Data maturity is incremental — progress occurs through repeatable capability improvements.
Successful organizations focus on removing the primary constraint at each stage, such as standardizing metrics before enabling self-service or stabilizing pipelines before introducing AI.
Avoiding these pitfalls allows organizations to move steadily through data maturity model stages while maintaining trust, adoption, and measurable business value.
Building a Data Maturity Roadmap (Action Framework)
A data maturity framework becomes valuable only when it translates into execution. Organizations that progress consistently treat maturity as a roadmap — a sequence of capability improvements tied to business outcomes rather than a one-time transformation initiative.
An effective data maturity roadmap prioritizes foundational stability first, then scales analytics adoption, and finally enables predictive and AI-driven decision systems.
Short-Term Priorities — Establish the Foundation
At early stages, the focus should be reducing fragmentation and building trust in data. The objective is to create a consistent baseline that supports reliable reporting.
Key actions include:
- defining core business metrics and standardizing KPI definitions
- centralizing critical datasets into a shared platform
- automating basic data pipelines to reduce manual reporting
- assigning data ownership for major domains
- documenting data sources and lineage
These improvements directly increase reporting accuracy and reduce analyst overhead, enabling teams to shift toward insight generation.
Mid-Term Priorities — Scale Adoption and Operationalize Analytics
Once foundational stability is achieved, the roadmap shifts toward embedding analytics into workflows. Organizations begin moving from reporting to operational decision support.
Typical initiatives:
- enabling self-service analytics across business teams
- implementing semantic layers for consistent metrics
- introducing data quality monitoring and observability
- integrating analytics into operational tools and processes
- improving data literacy through structured training
This stage focuses on reducing decision latency — ensuring insights are accessible when decisions are made, not after.
Long-Term Priorities — Enable Predictive and AI-Driven Capabilities
Advanced stages emphasize automation, experimentation, and continuous optimization. Data becomes a platform for innovation rather than a reporting function.
Strategic initiatives include:
- deploying predictive models into production workflows
- establishing experimentation frameworks for product and marketing
- implementing real-time analytics pipelines
- creating reusable data products and internal platforms
- automating insight generation and decision workflows
At this level, organizations design processes around data rather than layering analytics on top of existing processes.
Aligning the Roadmap With Business Outcomes
A common mistake is building a technical roadmap disconnected from business priorities. High-maturity organizations link each capability improvement to measurable outcomes such as faster decision cycles, improved customer retention, or operational efficiency.
This alignment ensures that data initiatives receive sustained executive support and clear ROI tracking.
Continuous Iteration Instead of Fixed End State
Data maturity is not linear or final. New data sources, AI capabilities, and regulatory requirements continuously reshape priorities. Effective roadmaps include regular reassessment cycles to identify the next constraint and adjust investments accordingly.
Organizations that treat data maturity as an ongoing capability development process are better positioned to adapt to technological shifts and competitive pressure.
Real Business Impact of High Data Maturity
As organizations progress through the data maturity framework, the impact extends far beyond improved dashboards. High data maturity fundamentally changes how companies operate, compete, and innovate. Decisions become faster, experimentation becomes safer, and strategy becomes evidence-driven rather than assumption-led.
The real value of enterprise data maturity lies in its ability to convert data capabilities into measurable business outcomes.
Faster Decision Cycles
Organizations with mature data capabilities significantly reduce the time between identifying a problem and acting on it. Automated pipelines, standardized metrics, and accessible analytics eliminate the delays caused by manual reporting and fragmented data sources.
Instead of waiting for periodic reports, teams operate with continuous visibility. This enables quicker course correction in areas such as marketing performance, supply chain efficiency, and product adoption.
Decision velocity becomes a competitive advantage, particularly in fast-moving markets.
Improved Operational Efficiency
High data maturity reduces redundant work across analytics and operational teams. Automated reporting, reusable data models, and shared definitions prevent repeated analysis of the same questions.
Operational workflows become data-informed, allowing organizations to optimize resource allocation, reduce waste, and identify inefficiencies earlier. This shift from reactive analysis to proactive monitoring improves consistency across departments.
Efficiency gains often appear first in reporting overhead reduction and later in process optimization.
Stronger Customer Intelligence
Mature organizations unify customer data across touchpoints, enabling more accurate segmentation, personalization, and lifecycle analysis. Insights move from descriptive summaries to behavioral understanding.
This allows teams to design targeted experiences, predict churn risk, and evaluate customer journeys holistically rather than through isolated metrics.
Customer intelligence becomes continuous rather than campaign-based.
Scalable Analytics and Experimentation
As governance, infrastructure, and literacy improve, analytics shifts from project-based to platform-based. Teams can test ideas faster because data preparation is no longer the primary bottleneck.
Experimentation frameworks support controlled testing across product, pricing, and marketing strategies. This reduces risk while increasing innovation speed.
Organizations with higher data maturity run more experiments and learn faster from each iteration.
AI and Automation Readiness
Advanced data maturity creates the foundation required for predictive analytics, machine learning, and AI-driven workflows. Clean, integrated, and well-governed data enables models to operate reliably in production environments.
Automation extends across reporting, anomaly detection, forecasting, and decision support, allowing teams to focus on strategy and creativity rather than manual analysis.
AI adoption becomes sustainable because the underlying data ecosystem supports continuous improvement.
Competitive Differentiation
Ultimately, high data maturity changes how organizations compete. Data evolves from a support function into a core capability that shapes products, pricing strategies, and market expansion decisions.
Companies that reach advanced maturity stages design feedback loops where insights continuously inform execution, creating momentum that is difficult for competitors to replicate.
This is why data maturity is increasingly viewed as an organizational capability rather than a technical milestone.
Conclusion
The data maturity framework provides a practical lens for understanding how organizations evolve from fragmented reporting environments to fully integrated, insight-driven ecosystems. Each stage represents a shift not only in technology but in mindset — from collecting data to operationalizing intelligence across everyday decisions.
Most organizations do not struggle with data availability; they struggle with consistency, trust, and adoption. The five stages of the data maturity model highlight that progress depends on strengthening governance, improving infrastructure, enabling self-service analytics, and building a strong data culture alongside technological investments.
Advancing through these stages allows organizations to shorten decision cycles, embed analytics into workflows, and unlock predictive and AI-driven capabilities. Rather than treating analytics as a downstream activity, mature organizations design processes where insights continuously guide execution.
A successful data maturity journey is incremental. It focuses on removing the primary constraint at each stage — standardizing metrics before scaling access, stabilizing pipelines before deploying advanced models, and improving literacy before expanding automation. This approach ensures that new capabilities are adopted, trusted, and sustained.
As data volume, AI capabilities, and competitive pressure continue to grow, organizations that invest in structured data maturity development will be better positioned to innovate consistently. The goal is not reaching a final stage but building repeatable capabilities that allow teams to adapt, experiment, and evolve with confidence.
Moving from reporting to innovation is ultimately about transforming how decisions are made. The data maturity framework serves as the roadmap that makes this transformation measurable, actionable, and achievable.
메타데이터
- post_id
- 135657c8da92
- slug
- the-data-maturity-journey-explained-a-practical-guide-to-the-5-stages-of-the-data-maturity-135657c8da92
- url
- https://medium.com/@moxleyph/the-data-maturity-journey-explained-a-practical-guide-to-the-5-stages-of-the-data-maturity-135657c8da92
- canonical_url
- https://medium.com/@moxleyph/the-data-maturity-journey-explained-a-practical-guide-to-the-5-stages-of-the-data-maturity-135657c8da92
- author_url
- https://medium.com/@moxleyph
- status
- ok
- fetched_at
- 2026-07-29 15:25:31





