Now is the Time to Watch Gold and Silver (Part 1): The History of the Gold-to-Silver Ratio
Hello, readers. As geopolitical tensions in the Middle East continue to ripple across asset markets, a deeper question emerges: where does…
Now is the Time to Watch Gold and Silver (Part 1): The History of the Gold-to-Silver Ratio
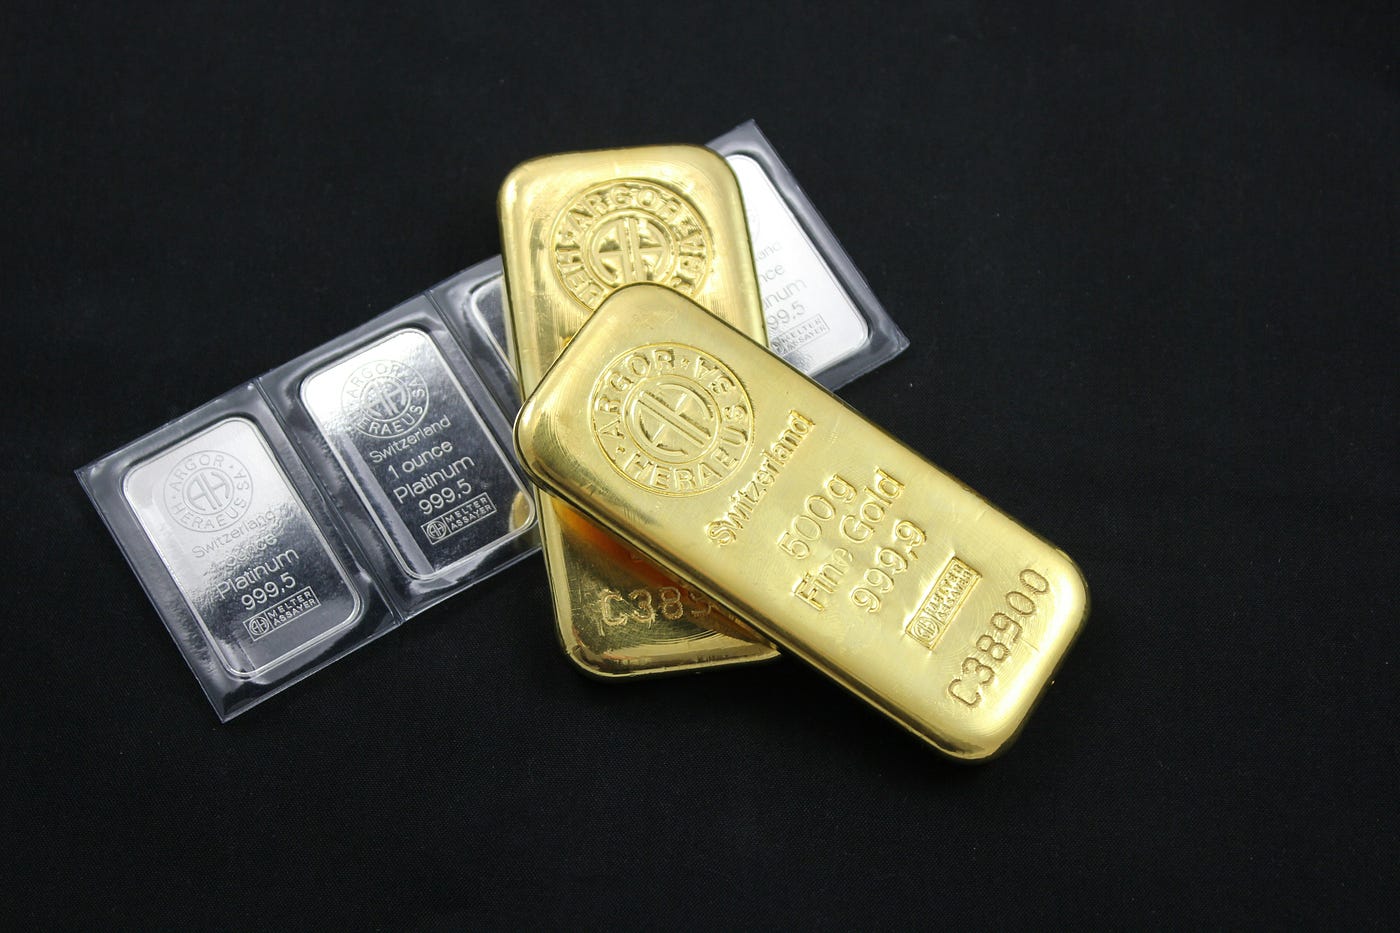
picture: Zlaťáky.cz of Unsplash
Hello, readers. As geopolitical tensions in the Middle East continue to ripple across asset markets, a deeper question emerges: where does lasting value actually live?
This new series is a two-part deep dive. Part 1 traces the historical trajectory of the “Gold-to-Silver Ratio” — the relative value between humanity’s two oldest forms of money — across both Eastern and Western civilizations. In Part 2, we will use this rich historical context to unlock hidden clues about their unique characteristics as modern assets, bridging the gap to actionable investment strategies via ETFs.
💡 What is the Gold-to-Silver Ratio? This metric represents the number of ounces of silver required to purchase a single ounce of gold. A rising ratio indicates that silver is depreciating or gold is aggressively surging in value.
From an 80% drain of a nation’s gold reserves within months to global market freezes triggered by sudden silver spikes — the history of these assets reads like a record of human ambition, panic, and adaptation. Let’s dive in.
1. The Ancient Era (3200 BCE — 1st Century BCE)
Geographic Scarcity and Primitive Mining | Ratio Range: 2.5:1 → 13:1
Before global trade networks were integrated, regional disparities in natural deposits and extraction technologies caused wild fluctuations in the ratio.
Ancient Egypt (c. 3200 BCE) | 2.5:1 This marks the historical peak of silver’s purchasing power. Because gold was abundant locally while silver had to be imported entirely, the legal decree of Pharaoh Menes fixed the ratio at a staggering 2.5:1. Silver was treated nearly as precious as gold.
Mesopotamia (c. 1800 BCE) | 6:1–8:1 During the era of the Code of Hammurabi, an influx of silver through trade gradually normalized its value.
Ancient Greece (5th–4th Century BCE) | 10:1–13:1 The ratio widened to 13:1 due to mass extraction at Athens’ Laurion silver mines. However, it temporarily tightened back to 10:1 when Alexander the Great conquered Persia and flooded the Mediterranean economy with gold from the Persian royal treasuries.
2. The Roman Empire and the Medieval Era (1st Century — 15th Century)
Institutional Standardization vs. Diverging East-West Cultural Values | West 12:1 vs. East 5:1
The West began stabilizing the ratio by imperial decree, while the East (China and Korea) elevated silver as the core currency for high-value transactions, valuing it far more than their Western counterparts.
The Roman Empire (1st–5th Century CE) | 11.5:1–12.5:1 Following Julius Caesar’s peg of 11.5:1 (driven by a massive influx of war-booty gold), Emperor Augustus officially institutionalized the statutory value between the gold Aureus and silver Denarius at 12.5:1.
Medieval Europe and Byzantium (5th–15th Century) | 12:1–14:1 Even after the collapse of Rome, this range was maintained with remarkable stability, treated almost as a natural economic law.
Tang-Song China & Goryeo Korea (7th–14th Century) | 5:1–6:1 The East charted a fundamentally different course. Lacking major domestic silver mines, East Asian economies faced structural silver shortages. Combined with Goryeo’s reliance on Eunbyeong (silver vases used as currency), the East valued silver more than twice as highly as the West did.
3. The Age of Discovery and Bimetallism (16th Century — 18th Century)
Global Trade Integration and the Chinese ‘Silver Black Hole’ | West 15:1 vs. East 4:1 → Convergence at 15:1
This era saw an unprecedented flood of silver from the Spanish Empire’s mines in South America and Japan’s Iwami Ginzan mine. The massive East-West valuation gap sparked the largest global arbitrage trade in human history.
The Golden Age of Global Arbitrage (16th–Early 17th Century)
RegionRatioThe West (Europe)12:1–15:1The East (Ming China, Joseon Korea, Japan)4:1–8:1
When the Ming Dynasty implemented the Single Whip Law (mandating all taxes be paid in silver), China’s silver demand skyrocketed. Western merchants discovered they could multiply their wealth by simply bringing European silver to China and trading it for gold, silk, and porcelain. This valuation gap acted as a vacuum, sucking nearly 50% of the world’s silver into China.
Late 18th Century Market Convergence | 15:1–15.5:1 Centuries of relentless silver inflows eventually saturated the Chinese market, diluting its scarcity. By the Qing Dynasty, the Eastern ratio converged with the West at roughly 15:1. In 1792, Alexander Hamilton, the first U.S. Treasury Secretary, officially established the young nation’s bimetallic standard at 15:1 via the Coinage Act.
4. The Late 19th Century: Opening of the East (1850s — 1890s)
Adoption of the Gold Standard and the Demonetization of Silver | 15:1 → 30:1+ Devaluation
This period saw the most violent decoupling of the ratio in history. Led by Western industrial powers, the world abandoned bimetallism for the monometallic Gold Standard. Silver was demoted from a monetary pillar to a mere industrial commodity, triggering financial chaos for Eastern nations caught off guard.
The 1859 Currency Crisis in Japan | Global 15:1 vs. Japan 5:1 When the Tokugawa Shogunate opened its ports under the Harris Treaty, it blindly maintained its isolated domestic ratio of 5:1. Foreign merchants quickly realized they could trade Mexican silver dollars for domestic Japanese silver, swap it for gold Koban coins at the 5:1 rate, and export the gold back to international markets to triple their money. This arbitrage loop drained 80% of Japan’s gold reserves within months, forcing a drastic currency devaluation.
💡 The Crime of 1873 The newly unified German Empire adopted the gold standard, and the United States passed the Coinage Act of 1873, halting the minting of silver dollars. As nations dumped their silver reserves onto the open market, the centuries-old 15:1 floor collapsed. By the turn of the century, the ratio breached 30:1, cementing a structural bear market for silver.

Source: Author’s compilation and visualization of historical gold-to-silver ratio data (AI-assisted graphic).
5. The World Wars and Great Depression (1914–1940s)
War-Time Panic and the Flight to Gold | 40:1 → 98:1
Trapped between two catastrophic world wars and the Great Depression, global confidence in paper currencies and industrial metals dissolved. Capital sought the ultimate refuge: gold.
The Interwar Period and WWII | Peak 98:1 Nations aggressively hoarded gold. In 1934, U.S. President Franklin D. Roosevelt signed the Gold Reserve Act, artificially lifting the price of gold to $35 per ounce. Driven by geopolitical dread, the ratio peaked at an unprecedented 98:1 in 1939, on the eve of WWII. By this point, Eastern economies were fully absorbed into the global Western financial architecture and suffered identical shocks.
6. The Modern Era and the Present Day (1971–2026)
The Fiat Era and the Macroeconomic Stress Gauge | 15:1 to 125:1
Following the 1971 Nixon Shock, which severed the final link between the U.S. dollar and gold, the ratio became a pure, free-floating barometer of market panic and macroeconomic health.
💡 1980: The Hunt Brothers Corner the Market | 15:1 The billionaire Hunt brothers attempted to corner the global silver market through massive leveraged accumulation. Silver prices went parabolic, temporarily dragging the gold-to-silver ratio back down to the pre-modern norm of 15:1 before the bubble burst on “Silver Thursday.”
2020: The COVID-19 Liquidity Crunch | 125:1 As pandemic lockdowns froze the global economy, a historic systemic liquidation took hold. Capital rushed exclusively into gold for survival. Meanwhile, silver — with 50% of its demand derived from industrial applications — collapsed alongside shuttered factories, pushing the ratio to an all-time historical high of 125:1.
2025–2026 Present Day: Supply Chain Realignment | 60:1–80:1 Trading Range Amidst structural tariff wars and persistent geopolitical friction, gold demand has remained exceptionally robust. Simultaneously, however, the green energy transition and the AI hardware boom have fundamentally altered silver’s floor. With silver being an irreplaceable component in solar photovoltaic panels, electric vehicle (EV) electronics, and AI data center power infrastructure, industrial demand is breaking records year after year. This industrial backing has provided a strong floor for silver, normalizing the ratio within a modern baseline of 60:1 to 80:1.
Coming Up in Part 2
Our journey through thousands of years of monetary history shows that the historical anchor of 15:1 is long gone — today’s ratio is a dynamic macro indicator, and in Part 2, we will decode why silver diverges from gold during crises, how AI and solar demand are rewriting silver’s long-term valuation, and whether today’s ~70:1 ratio offers a compelling risk-reward opportunity through modern ETF vehicles.
메타데이터
- post_id
- 152aae53a7e8
- slug
- now-is-the-time-to-watch-gold-and-silver-part-1-the-history-of-the-gold-to-silver-ratio-152aae53a7e8
- url
- https://medium.com/@donghoon0239/now-is-the-time-to-watch-gold-and-silver-part-1-the-history-of-the-gold-to-silver-ratio-152aae53a7e8
- canonical_url
- https://medium.com/@donghoon0239/now-is-the-time-to-watch-gold-and-silver-part-1-the-history-of-the-gold-to-silver-ratio-152aae53a7e8
- author_url
- https://medium.com/@donghoon0239
- status
- ok
- fetched_at
- 2026-07-09 20:10:33



