How to Trade Key Price Levels: A Complete Guide to Support and Resistance in Technical Analysis
Introduction
How to Trade Key Price Levels: A Complete Guide to Support and Resistance in Technical Analysis
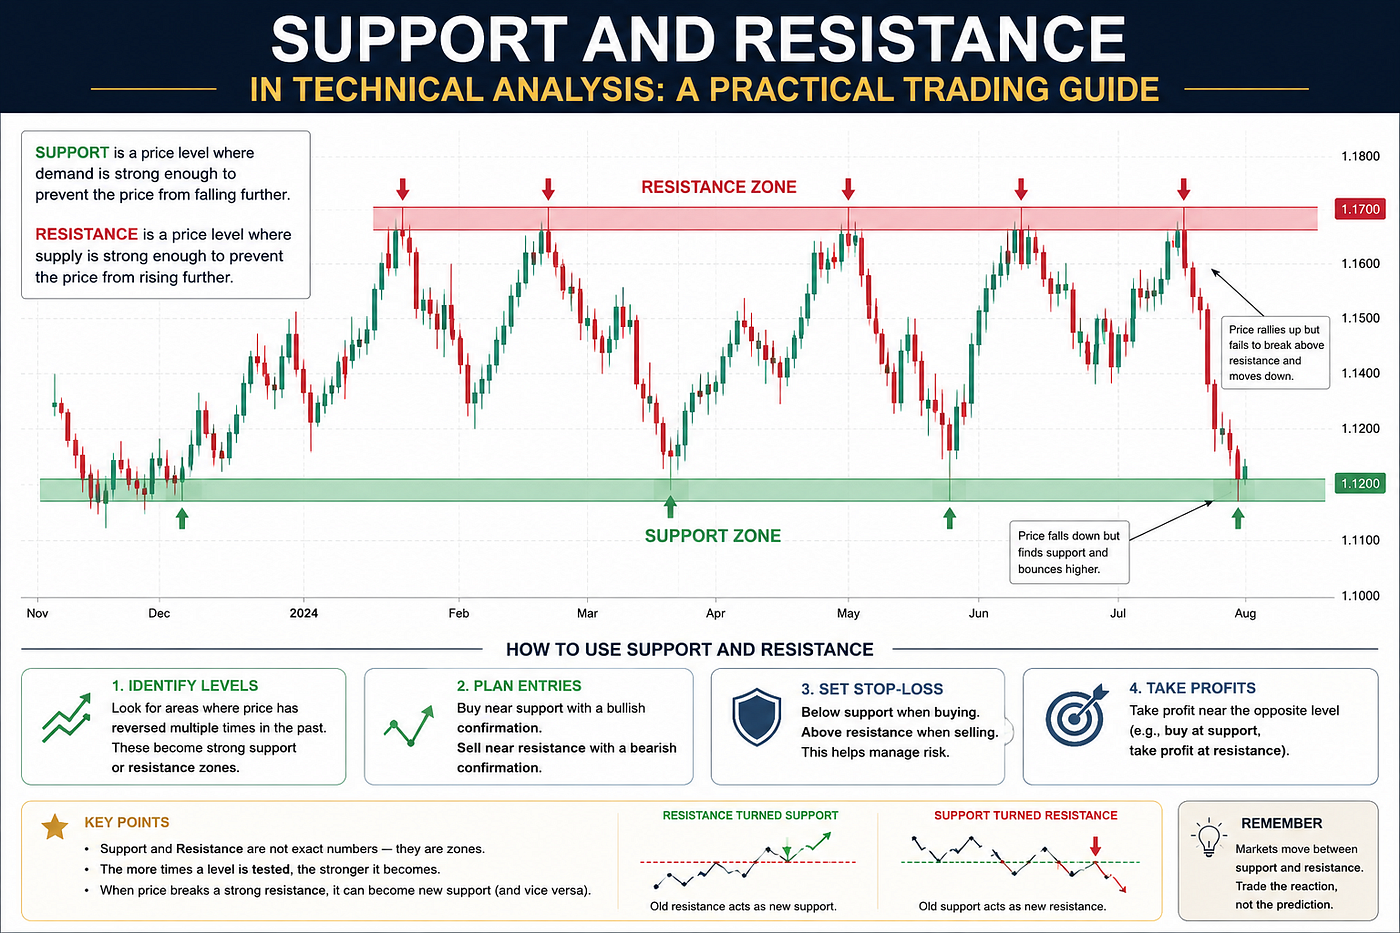
Support & Resistance
Introduction
Support and resistance in technical analysis are among the first concepts every trader should learn. They help traders understand where price may pause, reverse, break out, or continue its trend. Whether you trade stocks, indices, commodities, futures, or ETFs, these price levels can improve your timing and risk management.
Many beginners enter trades only because a stock is rising or falling. That approach creates emotional decisions. A better trader first checks the chart. Where is support? Where is resistance? Is price near a breakout point? Is the move backed by volume? Where should the stop-loss go? These questions turn trading into a plan.
This article explains support and resistance in technical analysis in a simple, practical way. It covers chart levels, breakouts, breakdowns, role reversal, volume confirmation, risk-reward planning, and common mistakes. You can also study the full guide here:
What Is Support and Resistance in Technical Analysis?
Support and resistance in technical analysis refer to important price zones on a chart. Support is a zone where buyers may step in and stop price from falling further. Resistance is a zone where sellers may appear and stop price from rising further.
Support often forms near previous lows. Resistance often forms near previous highs. These levels matter because traders remember them. If a stock bounced from a price zone earlier, buyers may again watch that area. If a stock failed near a level before, sellers may again become active there.
Support and resistance are not exact prices. They are zones. A stock may move slightly below support and then recover. It may also move slightly above resistance and then fall back. Therefore, traders should avoid treating these levels like fixed walls.
Why Support and Resistance Matter
Support and resistance in technical analysis matter because they give traders structure. A trader can use these levels to plan entry, stop-loss, and target. Without them, trading becomes guesswork.
For example, if a stock trades near a strong support zone, a trader may look for a buying setup. If price confirms strength, the trader can enter with a stop-loss below support. The target may be the next resistance level. This creates a clear risk-reward plan.
Resistance also helps traders avoid poor entries. If a stock has already moved sharply and now trades near resistance, buying may carry higher risk. A trader may wait for a breakout or a pullback instead of chasing price.
According to Investopedia, support and resistance are key technical analysis concepts that help traders identify possible price barriers where buying or selling pressure may appear. For additional learning, traders can refer to Investopedia’s guide on support and resistance:
The Market Psychology Behind Key Levels
Support and resistance work because markets are driven by human behavior. Traders remember previous highs and lows. Investors react to profits and losses. Institutions often place large orders near important zones.
Suppose a stock rises to $100 three times and fails each time. Traders start to see $100 as resistance. Some holders book profits there. Short-term traders may sell. New buyers may wait for a confirmed breakout. This creates selling pressure near that level.
Now suppose the same stock falls to $80 several times and bounces. Traders start to view $80 as support. Buyers may enter there. Short sellers may cover positions. Long-term investors may see value. This creates demand near support.
This psychology makes support and resistance in technical analysis powerful. These levels represent memory, emotion, and order flow.
How to Identify Support Levels
To identify support, look for areas where price stopped falling and moved higher. These areas often appear as previous swing lows. The more times price reacts near a zone, the more important that zone becomes.
A strong support level usually has clear price reactions. If a stock bounced from a zone several times, traders may watch it closely. However, repeated tests can also weaken support. Each test may absorb some buying demand. If buyers fail to defend the level, price may break down.
Traders can draw support using candle bodies and wicks. If many candle bodies close near a level, that zone becomes important. If long lower wicks appear near the same area, the support zone may be wider.
Volume can also confirm support. If price falls into support and then bounces with strong volume, buyers may be active. If price reaches support with weak demand, caution is needed.
How to Identify Resistance Levels
To identify resistance, look for areas where price stopped rising and turned lower. These areas often appear as previous swing highs. Resistance shows where sellers may defend price.
A strong resistance zone may form near previous highs, failed breakout points, psychological numbers, or major moving averages. If price failed near the same level many times, traders may expect selling pressure there again.
Resistance does not always mean price will fall. It means traders should wait for confirmation. Price may reject the level, consolidate below it, or break above it with strength. A breakout above resistance can signal a new bullish phase if volume supports the move.
A trader should avoid buying blindly near resistance. Instead, wait for a clean breakout, a strong close above the level, or a retest where old resistance becomes new support.
Horizontal Support and Resistance
Horizontal support and resistance are the easiest levels for beginners to understand. They form when price reacts near the same area multiple times.
For example, if a stock bounced from $50 in March, June, and September, that zone becomes horizontal support. If the stock later returns to $50, traders may watch for another bounce. If price breaks below $50 with strong volume, the chart structure changes.
Horizontal resistance works the same way. If a stock failed near $75 several times, that zone becomes resistance. A breakout above $75 may attract buyers, especially if price closes above the level with strong volume.
Horizontal levels work well because many traders can see them. The more obvious the level, the more traders may react to it.
Trendline Support and Resistance
Trendlines are another way to study support and resistance in technical analysis. A rising trendline connects higher lows in an uptrend. It shows where buyers are entering at higher levels. A falling trendline connects lower highs in a downtrend. It shows where sellers are defending price.
Trendline support can help traders buy pullbacks in an uptrend. If price returns to the rising trendline and forms a bullish candle, traders may consider a long setup. The stop-loss can go below the trendline or recent swing low.
Trendline resistance can help traders avoid buying too early in a downtrend. If price rallies into a falling trendline and gets rejected, sellers may still control the market.
Trendlines are useful, but they are subjective. Traders should not force them. A valid trendline should connect clear swing points and match the broader market structure.
Moving Averages as Dynamic Support and Resistance
Moving averages can act as dynamic support and resistance. Unlike horizontal levels, moving averages change with price. In an uptrend, price may repeatedly bounce from the 20-day, 50-day, or 200-day moving average. In a downtrend, price may repeatedly fail near these averages.
Short-term traders often watch the 20-day moving average. Swing traders may prefer the 50-day moving average. Long-term investors often track the 200-day moving average.
When price stays above a rising moving average, buyers may control the trend. When price stays below a falling moving average, sellers may dominate. However, moving averages work poorly in sideways markets because price may cross them many times.
That is why traders should combine moving averages with horizontal support, resistance, volume, and price action.
Breakouts Above Resistance
A breakout happens when price moves above resistance. Traders watch breakouts because they may signal the start of a new upward move. However, not every breakout succeeds.
A strong breakout should show a clear close above resistance. It should also have strong volume. Volume shows participation. If price breaks resistance but volume remains weak, the move may fail.
Beginners often chase breakouts after price has already moved too far. This creates poor risk-reward. A smarter approach is to wait for a retest. If price breaks above resistance and later returns to test that level as support, traders may get a better entry.
For example, if a stock breaks above $100 and later holds $100 as support, traders may consider a long trade. The stop-loss can go below the retest low. The target may be the next resistance zone.
Breakdowns Below Support
A breakdown happens when price falls below support. It shows that sellers have gained strength. A strong breakdown often comes with high volume, a close below support, and weak recovery attempts.
After a breakdown, old support may become new resistance. This is called role reversal. Traders often watch for a retest of the broken support level. If price fails there, sellers may remain in control.
Beginners should avoid buying only because a stock looks cheap after a breakdown. A broken support level can signal deeper weakness. It is better to wait for stability, a reversal pattern, or a new support zone.
Breakdowns can be sharp because many traders place stop-loss orders below support. Once those orders trigger, selling pressure can increase quickly.
Role Reversal: Old Resistance Becomes New Support
Role reversal is one of the most useful ideas in support and resistance in technical analysis. When price breaks above resistance, that old resistance may become new support. When price breaks below support, that old support may become new resistance.
This happens because traders change their behavior. If a stock struggled below $100 and finally breaks above it, many traders who missed the breakout may want to buy near $100 on a pullback. This creates demand. Old resistance becomes new support.
The opposite happens after a breakdown. If a stock breaks below $80, traders who bought earlier may sell when price returns near $80. This creates supply. Old support becomes new resistance.
Role reversal helps traders plan cleaner entries because it gives them a logical zone to watch after a breakout or breakdown.
False Breakouts and Fake Breakdowns
False breakouts happen when price moves above resistance but fails to stay there. Fake breakdowns happen when price moves below support but quickly recovers. These traps are common, especially near obvious levels.
False moves occur because markets often test liquidity. Many traders place stop-loss and entry orders near support and resistance. Price may briefly move beyond these levels before reversing.
To avoid false signals, traders should wait for confirmation. A candle close beyond the level is stronger than a brief intraday move. Volume confirmation also helps. A breakout with low volume is less reliable than a breakout with strong participation.
Patience is important. Traders do not need to catch every move. Waiting for confirmation often protects capital.
Using Volume With Support and Resistance
Volume makes support and resistance analysis more reliable. Price levels show where the market may react. Volume shows how strongly traders are participating.
If price breaks above resistance with high volume, buyers may be serious. If price breaks above resistance with weak volume, the breakout may fail. If price falls into support and bounces with high volume, demand may be strong.
Volume also helps identify exhaustion. If price rallies into resistance with a big volume spike but fails to close higher, sellers may be taking control. If price falls into support with heavy selling and then forms a strong bullish reversal, sellers may be exhausted.
Support and resistance in technical analysis work best when price action and volume agree.
Risk-Reward Planning With Support and Resistance
Support and resistance levels help traders manage risk. Every trade should include an entry, stop-loss, and target. These levels should come from the chart, not from emotion.
If a trader buys near support, the stop-loss can go below support. The target can be the next resistance level. If a trader buys after a breakout, the stop-loss can go below the breakout zone. The target can be the next major supply zone.
This creates a risk-reward structure. If the possible loss is $2 per share and the possible gain is $6 per share, the trade offers a 1:3 risk-reward ratio. Traders should avoid trades where the potential reward is too small compared to the risk.
To plan trades more clearly, you can use the Stock Risk Reward Calculator. It helps traders compare entry price, stop-loss, target, and potential reward before taking a position.
Support and Resistance for Intraday Trading
Intraday traders use support and resistance to plan fast entries and exits. They often mark the previous day’s high, previous day’s low, opening range, VWAP, and major intraday swing points.
If price holds above VWAP and bounces from support, buyers may control the session. If price stays below VWAP and rejects resistance, sellers may control the session.
Intraday support and resistance levels can break quickly. Therefore, traders need strict stop-losses. They should also avoid overtrading. A trader does not need to trade every level. The best setups usually appear when trend, volume, and price action align.
Support and Resistance for Swing Trading
Swing traders use support and resistance on daily and weekly charts. They look for entries near support in an uptrend or breakouts above resistance. Since swing trades last several days or weeks, chart levels should be wider than intraday levels.
A swing trader may buy a stock after it pulls back to a strong support zone. The stop-loss may go below the support area. The target may be the next resistance level.
Swing traders should also study the broader market. A bullish stock has better odds when the index and sector are strong. A weak market can cause good stock setups to fail.
Support and Resistance for Long-Term Investors
Long-term investors can also use support and resistance in technical analysis. They may not trade every small move, but they can use charts to improve timing.
An investor may like a company fundamentally but avoid buying if the stock is near major resistance. Instead, they may wait for a pullback to support or a confirmed breakout. This approach helps reduce emotional buying.
Long-term support levels can also warn investors. If a stock breaks a multi-year support zone, the investor may review the position. Technical analysis does not replace fundamental analysis, but it can improve entry and exit discipline.
How the Financial Astrology Terminal Helps Traders Study Key Levels
The Financial Astrology Terminal helps traders and investors combine market data, charts, watchlists, global stocks, indices, commodities, and financial astrology-based timing insights in one platform. This is useful because support and resistance trading depends on both price levels and market context.
A trader can use charts to mark support and resistance, watchlists to track setups, and global market data to understand broader sentiment. Timing insights can help traders stay alert during possible volatility windows. This does not replace technical analysis. It adds another layer of preparation.
For example, if a stock approaches resistance during a high-risk market window, a trader may wait for stronger confirmation. If an index holds support while market breadth improves, a trader may gain more confidence in the setup.
Common Mistakes Traders Make
The first mistake is drawing too many levels. A chart full of lines creates confusion. Traders should focus only on major zones where price reacted clearly.
The second mistake is treating support and resistance as exact prices. These are zones, not fixed points.
The third mistake is trading without confirmation. Price touching support does not always mean it will bounce. Price touching resistance does not always mean it will fall.
The fourth mistake is ignoring risk-reward. A trade near resistance may have limited upside. A trade far from support may require a wide stop-loss.
The fifth mistake is forgetting broader market context. A support level may fail if the overall market is weak. A resistance level may break if sector strength is powerful.
Simple Trading Workflow
Start by identifying the trend. Then mark support and resistance zones. Next, check volume. After that, watch price behavior near the level.
If price bounces from support with strength, plan a long trade only if the risk-reward makes sense. If price breaks above resistance with volume, wait for confirmation or a retest. If price breaks below support, avoid emotional buying and watch for a possible retest.
Before entering, define the stop-loss and target. If the possible reward is not attractive, skip the trade. Good trading is not about taking every opportunity. It is about taking the right ones.
Conclusion
Support and resistance in technical analysis give traders a clear way to understand price movement. Support shows where buyers may defend price. Resistance shows where sellers may appear. These levels help traders plan entries, exits, stop-losses, targets, breakouts, breakdowns, and reversals.
The best traders treat support and resistance as flexible zones. They use volume, candlestick behavior, trend direction, and broader market context for confirmation. They also manage risk before focusing on profit.
Whether you trade intraday, swing trade, or invest for the long term, support and resistance can improve your timing and discipline. They help you avoid random trades and build a more professional decision-making process.
To continue learning and apply these ideas with charts, market data, watchlists, global assets, and timing insights, visit Support and Resistance in Technical Analysis: A Practical Trading Guide and explore how the Financial Astrology Terminal can support smarter trading decisions.
메타데이터
- post_id
- 180a0ac0d4bf
- slug
- how-to-trade-key-price-levels-a-complete-guide-to-support-and-resistance-in-technical-analysis-180a0ac0d4bf
- url
- https://medium.com/@astro2dunia/how-to-trade-key-price-levels-a-complete-guide-to-support-and-resistance-in-technical-analysis-180a0ac0d4bf
- canonical_url
- https://medium.com/@astro2dunia/how-to-trade-key-price-levels-a-complete-guide-to-support-and-resistance-in-technical-analysis-180a0ac0d4bf
- author_url
- https://medium.com/@astro2dunia
- status
- ok
- fetched_at
- 2026-06-09 14:34:10