GEOINT Change Detection Case Study — Solonytsivka, Ukraine (May–June 2022) Walkthrough
This project is an open-source case study demonstrating how Geospatial Intelligence (GEOINT) and Open Source Intelligence (OSINT) can be…
Mapping Movement: A GEOINT Change Detection Analysis over Solonytsivka, Ukraine (May–June 2022)
This project is an open-source case study demonstrating how Geospatial Intelligence (GEOINT) and Open Source Intelligence (OSINT) can be used together to identify and analyze suspected materials storage or movement using publicly available data and satellite imagery with a focus on the year 2022.
See the full project on GitHub.
Region Selection and Time Period
We will focus on a segment of Kharkiv, which, back in 2022, was an area near the Ukraine-Russia border that had been documented as having railroad and logistics activity:
- Photographic evidence of convoys near Kyiv, corresponding to areas like Kharkiv and bordering regions, have been used by media and analysts to illustrate staging and supply chain movement. phys.org
- Scholarly and OSINT investigations frequently utilize similar border and infrastructure zones to detect strategic buildup and logistics flow. WIRED
The specific area within that region that we will look at in this investigation is the Solonytsivka–Podvirky corridor.
Imagery Collection
Now that we have a target region in mind, let’s collect some images of this region during a time frame in which military activities were taking place.
We will search for and download two images in order to obtain a “before” and “after” picture and will then compare the two.
Some tips on choosing images:
- Same season: Minimize terrain appearance differences. For example, both pictures should have minimal to no snow for better comparison and visibility between the two.
- Cloud-free: Clear optical visibility.
- Zoomed in: Focus on suspected rural zones, not downtown.
- Short interval: Try 2–3 week gaps to view subtle movement.
Terms to Know
SAR: Synthetic Aperture Radar
SAR is a type of radar used to create high-resolution images of the Earth’s surface. Unlike regular satellite imagery (which uses visible light), SAR uses microwaves to “see” through clouds, smoke, and even at night.
Why we like it:
- Works in any weather: Cloud cover and snow do not block SAR.
- Shows surface changes: Great for detecting convoys, ground disturbances, new roads, or construction.
- Penetrates camouflage: Can spot structures hidden under trees or canvas.
SAR is used in:
- Military surveillance
- Disaster response
- Border security
- Illicit activity detection (like arms smuggling)
AOI: Area of Interest
AOI refers to the specific geographic location you are analyzing or monitoring. It’s essentially the “box” or region you care about.
Steps
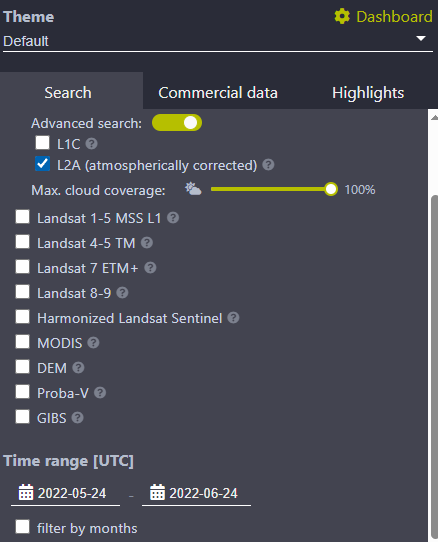
Go to: https://apps.sentinel-hub.com/eo-browser/
- Search for coordinates: 49.9871, 36.0795. This is the Solonytsivka–Podvirky corridor.
- Select the Sentinel-2 L2A layer
- Select the following dates for our search to start off and click Search:
- May 24, 2022
- June 24, 2022
This time range allows for things like similar weather between both dates.
*These dates may not be the exact dates that we end up choosing in the results, since we want to choose dates with the least amount of cloud coverage, snow, and other noise, but they provide a good range to start with.

True Color image on May 6, 2022

False Color Urban image on May 6, 2022
- Select Visualize on your desired May 2022 image from the results and choose the visualizations below. Only one visualization can be chosen at a time, so pick one, download the image, and then do the same for the other one.
- “True Color” (real life colors that your eyes would see, like in Google Earth)
- “False Color Urban” (Infrared + urban detection, like buildings, vehicles, heat-absorbing surfaces that show up better in purple)
-
Zoom in and download high-res PNG files for each color scheme.
-
Do the same for a June 2022 image.
Save images as:
- solonytsivka_may2022_truecolor.png
- solonytsivka_may2022_falsecolorurban.png
- solonytsivka_jun2022_truecolor.png
- solonytsivka_jun2022_falsecolorurban.png
Compare the Images
Now that we have some images, we need to compare the differences between them.
We will use Python in a Jupyter notebook to automatically create heatmaps that display the differences between the May and June maps.
We will also create an overlay over the maps that display annotations for the changes between them.
We will compare both of the true color images and the false color urban images together, as each one offers complementary intelligence value, such as:
True Color: Realistic visual interpretation (human eye). For example, “This road shows new vehicle tracks or military movement.” False Color Urban: highlights infrastructure, buildings, paved surfaces. For example, “There is new pavement or construction in a suspected depot.”
By overlaying changes on both, the investigation becomes multi-perspective. True Color helps to explain findings to non-experts and visualize what’s happening naturally, while false color urban helps to validate urban/military structure changes more clearly.
The Jupyter notebook found **here** will create the following:
- Automated heatmap generation for both true color and false color urban maps

True Color Heat Map displaying May-June changes
- Transparent overlays with bounding boxes for both types of maps

An overlay containing boxes around map changes
- Auto‑generated markdown intelligence reports for both map types
Additional Comparisons
Now that we have some comparisons and analyses completed, we can use Sentinel‑1 SAR analysis to complement our optical imagery.
We will use the **Capernicus EO browser** to download Sentinel-1 images.
- Select Sentinel‑1 > VV (Vertical transmit, Vertical receive) (GRD)
- Use the “Cloudless” preset
- Set AOI to Solonytsivka area: 49.9871, 36.0795
- Select two dates: one around May 2022 and one around June 2022
- Use the download icon → Analytical download → GeoTIFF
Save the files as:
- solonytsivka_may2022_sar.png
- solonytsivka_jun2022_sar.png

SAR heatmap displaying changes

SAR overlay displaying changes
What are we seeing here?
- The heatmap image (SAR Difference Heatmap) is nearly completely black, except for a few red/yellow highlights and annotated boxes.
- You can’t see the city, any roads, or landmarks, just blackness and a few glowing spots.
What does this mean?
- SAR data is not visual like optical imagery. It’s based on microwave backscatter, which is very noisy and abstract unless interpreted with proper context.
- The SAR Jupyter script only shows the difference map and not the city or terrain.
- The difference map highlights what changed, but hides everything that didn’t change.
- The SAR overlay image also uses the SAR image from June as the background, which, being grayscale and noisy, may not help you recognize features but is useful if you’re familiar with reading radar data.
Now, if we blend this new overlay with the false color urban map, we get this:

Using the false color urban map provides for better contrast between man-made structures and terrain when doing SAR overlays.
The true color map with the annotated overlay:

Reporting our Findings
Now that we have a few pertinent changes within the map, we create a report.
Reports typically contain the following components:
- Geospatial Data: The foundation of the report, including imagery, elevation data, and other location-based information.
- Imagery Intelligence: The analysis of the imagery itself to extract meaningful information, such as identifying objects, changes over time, or activities.
- Geospatial Information: The interpretation and synthesis of the imagery intelligence with other data to provide a comprehensive picture.
- Analysis and Interpretation: Explaining the significance of the findings in the context of the mission or objective.
- Recommendations: Actionable insights based on the analysis, which can be used to inform decisions.
메타데이터
- post_id
- 1876bb44d933
- slug
- geoint-change-detection-case-study-solonytsivka-ukraine-may-june-2022-walkthrough-1876bb44d933
- url
- https://osintteam.blog/geoint-change-detection-case-study-solonytsivka-ukraine-may-june-2022-walkthrough-1876bb44d933
- canonical_url
- https://osintteam.blog/geoint-change-detection-case-study-solonytsivka-ukraine-may-june-2022-walkthrough-1876bb44d933
- author_url
- https://medium.com/@avfaulkner
- status
- ok
- fetched_at
- 2026-06-24 11:06:28