Why StarRocks Is Better Than Druid for Network Flow and Network Security Telemetry Analytics
If you run a network — a carrier backbone, a CDN edge, a cloud VPC estate, or a security service that sits in the path of somebody else’s…
Why StarRocks Is Better Than Druid for Network Flow and Network Security Telemetry Analytics
If you run a network — a carrier backbone, a CDN edge, a cloud VPC estate, or a security service that sits in the path of somebody else’s traffic — you almost certainly have a flow analytics platform. And there is a very good chance Apache Druid is underneath it.
This is not an accident, and it is not a mistake. Network flows are one of the six use cases Apache Druid documents on its own site, and the description is precise about why it fits:
“Druid helps with network flow analysis by being able to ingest large amounts of flow records, and by being able to group or rank across dozens of attributes at query time at interactive speeds. These attributes often include core attributes like IP and port, as well as attributes added through enhancement such as geolocation, service, application, facility, and ASN.”
The Powered By page backs that up with an unusually dense concentration of network and security operators. Cisco “uses Druid to power a real-time analytics platform for network flow data.” Verizon’s entry reads: “Verizon’s network analytics platform leverages Druid as a real-time analytics engine to enable interactive analytics and performance metrics, support use cases like traffic capacity management using Netflow and network statistics… We chose Druid because it enables us to achieve our mission with sub-second latency on large datasets.” Jolata ingests “over 35 billion events per day” for real-time network performance management. redBorder is “an open source, scale out, cybersecurity analytics platform based on Druid.” Hexaglobe uses it for “network and CDN analytics.” Zscaler, SK Telecom, Swisscom, British Telecom, and Charter Communications are all listed. Imply’s case study for NTT describes real-time observability across one of the world’s largest IP backbones at “100,000+ events per second ingested with subsecond query latency.”
So this is a fair fight on Druid’s home turf, against a system that genuinely works. The argument here is narrower than “Druid is bad”: the flow-and-security-telemetry workload has drifted, over the last five years, away from the shape Druid was designed for — and the drift is structural, not a matter of tuning.
What actually makes this workload different
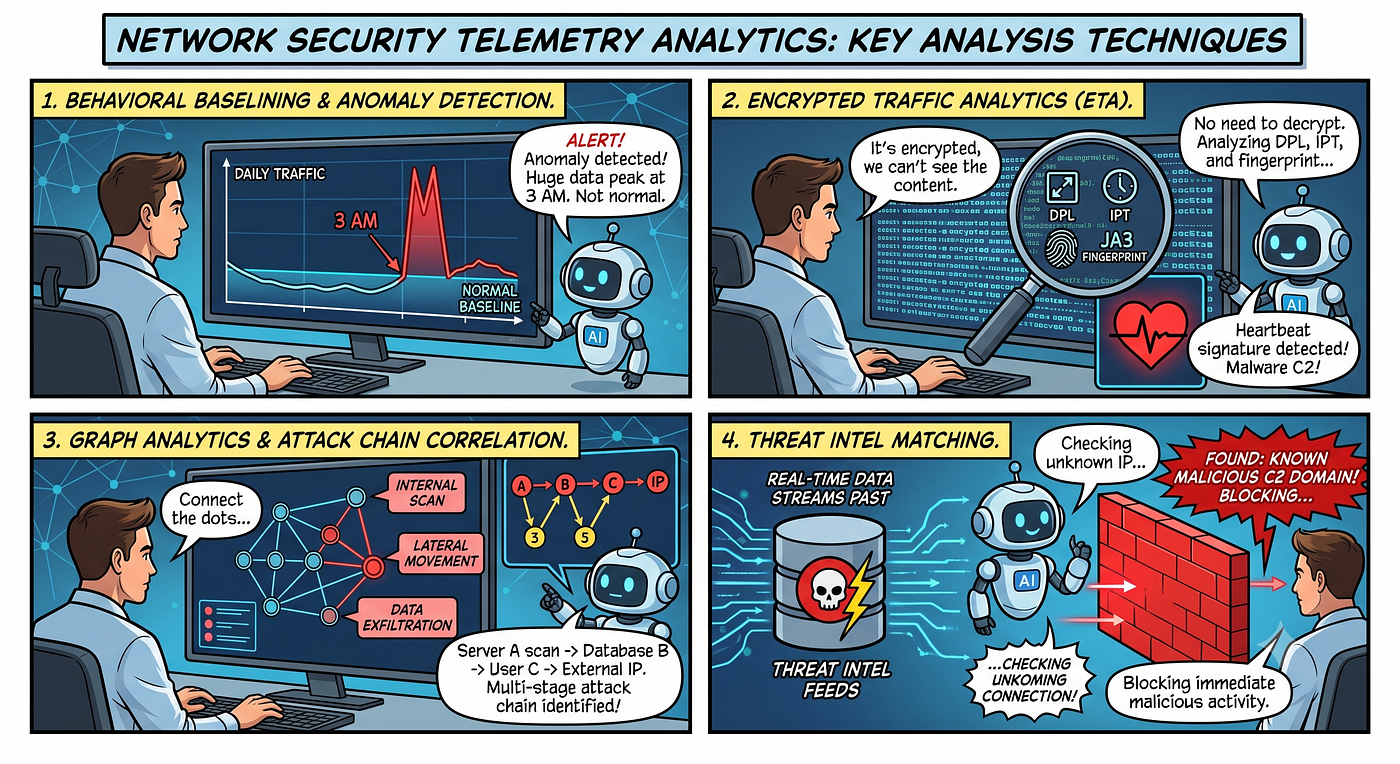
Flow and security telemetry looks like a time-series firehose from the outside. Underneath, it has six properties that generic event analytics does not.
1. The enrichment is the analysis. A raw NetFlow v9 or IPFIX record is five tuples, a byte count, a packet count, and two timestamps. On its own it tells you almost nothing. It becomes useful only after it is joined to: an ASN and prefix table (whose network is this?), GeoIP (where?), an asset/CMDB inventory (which of my hosts, owned by which team, running which service?), a firewall or ZTNA policy table (which rule allowed this?), a tenant/customer mapping (who do I bill and who is allowed to see it?), a BGP or topology table (which path did it take?), and a threat-intelligence indicator list (is this destination known-bad as of today?). Druid’s own use-case text acknowledges this — it calls them “attributes added through enhancement.”
2. Cardinality is the signal, not the noise. In most analytics, high-cardinality columns are a cost problem you engineer around. Here, src_ip × dst_ip × dst_port × asn × device_id is the question. "How many distinct sources hit this destination in the last five minutes" and "which source IPs appeared today that never appeared in the previous 30 days" are not exotic queries; they are the DDoS detector and the first-sighting hunt.
3. The important questions are retrospective. Detection is real-time; investigation is not. When an indicator drops, the analyst asks “did anything in my estate talk to this address at any point in the last year?” Imply’s own July 2026 post on VPC flow logs states the resulting bind with admirable bluntness: organizations “shorten retention from years to months, or months to weeks,” “filter out lower-priority traffic,” or “archive raw logs into object storage where they become difficult or impossible to search” — and then adds, “None of those decisions improve security. They’re simply attempts to manage storage costs.”
4. Records mutate after they land. Flow exporters batch and re-export; sampling rates get corrected; an alert’s triage state moves from new → investigating → false_positive hours later; asset ownership and threat-intel verdicts change retroactively for data already written. Zscaler's Druid retrospective lists "Dealing with delayed logs" as an explicit requirement, and notes they wrote "a custom ingester that reads from Kafka… since we need to flatten nested JSON and also detect duplicate logs."
5. The schemas are heterogeneous and unstable. A single security data platform carries flow records, DNS query logs, TLS/JA3 handshakes, HTTP proxy logs, firewall session events, EDR telemetry, and ZTNA authentication events. They share a timestamp and a tenant and little else, and new fields appear whenever a sensor is upgraded.
6. Two audiences share one dataset. The internal NOC/SOC wants unbounded ad-hoc exploration; external customers want a fast, bounded, always-available dashboard. On one cluster, these two workloads fight.
Where Druid’s design pushes back
Joins, and the denormalization tier they force you to build
Druid’s Joins documentation states up front that “whenever possible, for best performance it is good to avoid joins at query time.” The concrete constraints on the interactive path: native queries implement joins with a broadcast hash-join, so every datasource other than the leftmost “base” datasource must fit in memory, and the join condition must be an equality. (Druid SQL accepts an arbitrary condition, but only certain equalities execute efficiently as a native join.) The recommended alternative is lookups — key-to-value maps with exactly two columns, k and v, both strings, preloaded in memory on all servers; the documentation states outright that "preloaded dimension tables that are wider than lookups… are not supported."
For a GeoIP country code, lookups are fine. For an asset inventory with 400,000 hosts and twelve attributes each, or a threat-intel feed with millions of indicators and confidence scores and first-seen dates, they are not. So you build the enrichment upstream: a Flink or Spark job that joins the flow stream against every dimension before it reaches Druid, and writes a fully denormalized record.
That tier is where the cost lives, and it has three failure modes specific to this domain:
- Retroactive dimension changes require reprocessing. When an IP is reassigned between customers, or a threat-intel verdict flips from
unknowntomalicious, every already-written record carrying the old value is wrong. Fixing it means re-ingesting the affected time range. - Analysts cannot ask new correlation questions. Any join you did not anticipate at pipeline-design time is unavailable at query time. In a threat hunt, the entire point is that you did not anticipate the question.
- The pipeline becomes a second source of truth that drifts. One Druid operator — a customer-facing analytics provider serving several hundred external clients — described writing the same events to both S3 and Druid and then having to explain the difference to customers: “we invoice our customers by the S3 data. But for analytics they use Druid data. And they ask us why the data is different. In analytics we see $1,000 and in billing, in invoice, we see $1,200.”
Rollup versus raw detail
Druid’s economics at flow volume rest on rollup: aggregate at ingest, store the cube. But flow analytics needs both. The 1-minute rollup by (src_asn, dst_asn, dst_port) powers the capacity dashboard. The investigation needs the individual record — ephemeral source port, exact TCP flags, exact byte count — because that is the evidence. Keeping both means two ingestion specs and two datasources over the same stream, with all the consistency risk that implies. Druid 31.0.0 (Oct 2024) introduced Projections, which do preserve source dimensions and are a real step toward this — but the documentation still carries the admonition "Projections are experimental. We don't recommend them for production use."
Immutability
Druid does not have UPDATE or ALTER TABLE statements, and the documentation is explicit that Druid does not support single-record updates by primary key. Corrections are made with REPLACE <table> OVERWRITE, which rewrites at segment granularity. For a triage-state column on an alerts table, or for backfilling a corrected sampling rate, this means rewriting hours of data to change a handful of rows. The customer-facing analytics provider quoted above put it plainly: "It's hard to support Druid because sometimes there are problems with data and we need to rewrite it. We cannot just easily rewrite data… it's still hard even for senior engineers."
Retention economics
This is the argument Imply itself now makes. Their VPC flow log post identifies exactly why this dataset is hard: it combines “extremely high volume,” “high investigative value,” and “relatively infrequent day-to-day access.” That profile is a bad fit for an architecture where query capacity and storage capacity are bought together — which is what a Historical tier is. And Imply’s answer is not “put it in Druid.” It is Imply Lumi, a separate object-storage-native product. That is a candid read of the architecture, and worth sitting with: the vendor behind Druid does not propose Druid as the place to keep three years of flow logs.
One cluster, two audiences
Druid’s multitenancy documentation notes that “Each datasource requires its own JVMs for realtime indexing” — though that appears under a discussion of the advantages of shared datasources, so the honest reading is that Druid pushes you toward pooling tenants into shared datasources, not that per-tenant isolation is impossible. What operators report is what pooling costs. The provider quoted above: “we have only one Druid cluster… it’s stuck overall, especially in prime time.” Their customer-facing SLA was one second; under contention they saw “five minutes for very easy data, just some high-level aggregations, because we develop a big queue in Druid.” And on the obvious fix: “I think it could get fixed if we scaled Druid, but we already have a lot of hardware and it’s too expensive.”
Operational surface
Druid’s architecture documentation lists eight services — Coordinator, Overlord, Broker, Router, Historical, Middle Manager, Peon, and Indexer (the last currently designated experimental) — plus ZooKeeper, a metadata store, and deep storage. Zscaler’s retrospective is a good picture of what running this well looks like: one base Docker image with a container per component, ECS on top of EC2 autoscaling groups, ALBs in front of Brokers and Tranquility, RDS PostgreSQL for metadata, S3 with FIPS endpoints and modified JRE security policies, Terraform plus Ansible for bootstrap. That is a competent team doing a good job. It is also a lot of platform to own before you have answered a single question about your network.
A telecom network-assurance vendor that embeds an analytics database inside an appliance sold to carriers described a different edge of the same problem. Their deployments range from 100 records per minute to millions of lines per second, and “even for small customers, there’s a significant amount of RAM necessary to not-crash. Hard to justify big infra for small customers.” At the other end: “when we’re monitoring 1 million items… finding the worst in the network creates a big bottleneck.” On operations: “Compaction is slow. It crashes. Hard to understand. Time consuming.”
What Druid has shipped, in fairness
Druid has not stood still. Join hints for the MSQ task engine arrived in 32.0 (Feb 2025). Version 34.0.0 landed over 270 features and fixes from 48 contributors, including experimental Historical cloning. Version 35.0.0 brought over 229 changes from 29 contributors, promoted MSQ from an extension to core, added Java 21 support, and shipped a druid-exact-count-bitmap contributor extension for exact cardinality over a Long column using Roaring bitmaps — which meaningfully narrows the "Druid is approximate-only" critique. Version 36.0.0 (Feb 9, 2026) added over 189 items from 34 contributors, including cost-based autoscaling for streaming ingestion and a V10 segment format (off by default). Schema auto-discovery has improved the semi-structured story considerably.
The join constraints above also deserve scoping: they describe the native, interactive query path. MSQ’s sort-merge join algorithm, core since 35.0.0, has “no limit on the overall size of either input.” It still requires equality conditions, so it does not enable range joins like CIDR containment, and MSQ is a task-based engine rather than the sub-second interactive one — but any comparison that ignores it is out of date.
How StarRocks approaches the same six problems
Joins at query time, planned by a cost-based optimizer
This is the load-bearing difference. StarRocks is a fully vectorized MPP SQL engine with a cost-based optimizer that collects row counts, column cardinality, and min/max statistics and reorders joins automatically. Distributed shuffle, broadcast, colocate, and bucket joins are all available; the right side does not have to fit in one process’s memory.
Which means the enrichment moves out of the pipeline and into the query:
SELECT
    a.owner_team,
    ti.threat_family,
    g.country_code,
    COUNT(*)                                AS flows,
    SUM(f.bytes_out)                        AS bytes_exfiltrated,
    COUNT(DISTINCT f.dst_ip)                AS distinct_destinations
FROM flow_records f
JOIN asset_inventory  a  ON f.src_ip = a.ip_address
JOIN threat_intel     ti ON f.dst_ip = ti.indicator
                        AND f.event_time BETWEEN ti.first_seen AND ti.valid_until
LEFT JOIN geo_prefix   g  ON inet_aton(f.dst_ip)
                             BETWEEN g.range_start AND g.range_end
WHERE f.event_time >= NOW() - INTERVAL 24 HOUR
  AND ti.confidence >= 80
GROUP BY 1, 2, 3
ORDER BY bytes_exfiltrated DESC
LIMIT 50;
Two notes on that example, because it is easy to get wrong. First, the dimension tables must be de-duplicated on the join key — if a dst_ip matches two threat-intel rows or falls inside two overlapping CIDR ranges, the fan-out inflates COUNT(*) and SUM(bytes_out). Second, inet_aton() converts a dotted-quad to a BIGINT so that prefix containment becomes a range predicate; StarRocks does support non-equality conditions in outer joins, but a join with no equality key at all plans as a nested loop, and the documentation is right to warn that non-equi-joins run slower. In practice you carry a coarse equality key alongside the range — a /16 bucket, for instance — so the planner has something to hash on.
What matters is the shape: nothing here was anticipated at ingest time. The threat-intel table was updated twelve minutes ago and the results reflect it, with no reprocessing of the flow stream.
The most direct confirmation we have of what this is worth came from a tier-1 North American mobile operator running a Druid-replacement program over radio-access-network telemetry at roughly 140 billion records per day. Their own framing of the change: “We were denormalizing using Flink to Kafka or S3, and ingesting that into Druid. We’d like to make that more self-service, and not denormalize — allowing users to build their own correlations.” Their verdict after building it: “This was much simpler than implementing it in Druid. Dramatically simpler.”
Detail and rollup from one table
StarRocks keeps the raw records and derives the rollups with asynchronous materialized views, which the optimizer rewrites queries onto transparently:
CREATE MATERIALIZED VIEW mv_flow_1m
PARTITION BY date_trunc('day', minute_ts)
REFRESH SCHEDULE EVERY (INTERVAL 1 MINUTE)
AS
SELECT
    time_slice(event_time, INTERVAL 1 MINUTE) AS minute_ts,
    tenant_id, src_asn, dst_asn, dst_port, protocol,
    SUM(bytes)          AS bytes,
    SUM(packets)        AS packets,
    COUNT(*)            AS flows,
    BITMAP_UNION(to_bitmap(src_ip_num)) AS src_ip_bm
FROM flow_records
GROUP BY 1, 2, 3, 4, 5, 6;
The capacity dashboard queries flow_records and silently gets the MV. The investigator queries flow_records with a src_port predicate and gets the raw table. One table, one ingestion path, one source of truth. The BITMAP_UNION column is the interesting part for this domain: StarRocks BITMAP gives exact distinct counts, and bitmap_andnot over two unioned periods answers "source IPs seen today that were not seen in the prior 30 days" — the first-sighting query — without scanning raw flows.
Mutable records
Primary Key tables support real UPDATE and DELETE, and partial column updates let you write one column without supplying the rest of the row:
UPDATE security_alerts
SET triage_state = 'false_positive', analyst = 'jsmith', closed_at = NOW()
WHERE alert_id IN (...);
The same mechanism handles late-arriving enrichment and corrected sampling rates. No segment rewrite, no REPLACE OVERWRITE of an hour of data to change forty rows. It also gives you a clean answer to tenant offboarding and data-subject deletion requests: delete by key, not by time range.
Retention that does not force a deletion decision
Three mechanisms compose here.
Expression partitioning creates partitions directly from a function of the time column, at whatever granularity the ingest rate justifies — PARTITION BY date_trunc('hour', event_time) for firewall logs, or PARTITION BY time_slice(event_time, INTERVAL 10 minute) for very high-rate flow streams. No generated column is required; both are first-class partitioning expressions. partition_live_number then enforces a rolling TTL declaratively: "partition_live_number" = "720" keeps 30 days of hourly partitions and drops the rest automatically.
Then the cold tier moves to the lake. StarRocks queries Iceberg, Hudi, Delta Lake, Paimon, and Hive through external catalogs with a local data cache, using the same SQL, the same optimizer, and the same BI connections as the internal tables. Version 4.1 added incremental materialized views over Iceberg append-only tables — version-range delta refresh instead of full-partition recomputation — plus native DELETE on Iceberg tables producing standard V2 position delete files with atomic snapshot commits.
So the shape is: hot flow data in StarRocks native tables with fast partition TTL; warm and cold flow data in Iceberg on object storage; one engine, one SQL dialect, one set of dashboards spanning both. The retention decision Imply’s post describes — years to months, months to weeks — stops being forced.
Search, in the same engine
Threat hunting is half aggregation and half substring search: find the JA3 hash, the suspicious user-agent, the DGA-looking domain, the URI path with the encoded payload. StarRocks has two mechanisms for this in the same tables the dashboards query.
The N-gram Bloom filter index (currently labelled Beta) accelerates LIKE and the ngram_search family:
ALTER TABLE dns_logs
ADD INDEX idx_qname (query_name) USING NGRAMBF
    ("gram_num" = "4", "bloom_filter_fpp" = "0.05");
Full-text inverted indexes (GIN) have been available since v3.3.0 with the MATCH family of predicates; Primary Key tables gained support in v4.0, and v4.1 added a built-in implementation, alongside the default CLucene backend, that works on both shared-nothing and shared-data clusters. Symmetry with the Druid criticisms above demands the same disclosure: this is also labelled Beta, and it still requires setting the FE configuration item enable_experimental_gin. It is real and shipping, but I would not claim Elasticsearch-parity performance for it.
For schema heterogeneity, the native JSON type plus Flat JSON — which columnarizes frequently-accessed JSON subfields automatically, and is on by default as of v4.0 — means a firewall event, a DNS record, and a ZTNA auth event can share a table with a common header and a JSON payload column, without a flattening spec written in advance.
Two audiences, one cluster
Resource groups partition CPU, memory, and concurrency between workloads, so a customer-facing dashboard query does not queue behind an analyst’s 90-day scan. Multi-warehouse compute isolation was open-sourced with v4.0 for stronger separation. Version 4.1’s adaptive range distribution addresses the specific failure mode where a table’s distribution assumption goes stale as traffic patterns shift — traffic moves to new prefixes, one tenant grows tenfold — by splitting tablets along sort-key ranges automatically. In StarRocks’ published benchmark on a 200 GB dataset at 32 concurrent threads it delivered 1.86× the throughput of static hash distribution, with P99 latency dropping from 36.6 seconds to 11.5 seconds; note that it is opt-in via enable_range_distribution, currently shared-data mode only, and tablet merge ships in a later release. And because StarRocks speaks the MySQL wire protocol, Grafana, Superset, Tableau, and every internal tool your team already wrote connect without a driver project.
What this looks like in production
A global network-security appliance vendor ran a proof of concept whose Kafka topic was literally named netflow_ipfix — 88 partitions, Spark Structured Streaming into StarRocks via transaction stream load, feeding a firewall/flow fact table partitioned by date_trunc('hour', itime) with random bucketing at a 2 GB bucket size. Target architecture: 100 tables for 100 event types, replicated across 10 tenant storage pools. On 10 backend nodes at 32 cores and 64 GB each, they validated 2.5 million rows per second sustained on a single table and 1.2–1.5 million rows per second across multiple tables concurrently — the 2.5M target having been raised mid-PoC from an original 1M to match the incumbent Kudu deployment. Data freshness was tuned from ~5 minutes to a 12-second target by moving the ingest table from Primary Key to Duplicate Key. In fairness: the PoC succeeded technically and they nonetheless standardized company-wide on a different engine for unrelated reasons, then restarted a shared-data-mode evaluation months later.
A tier-1 North American mobile operator — the one quoted above on denormalization — is in production with 300–400 TB on StarRocks against a 15 PB target, in shared-data mode, ingesting from Kafka at 13–14 Gb/s at full volume. Separately, a tier-1 US carrier ran an on-premises Druid-replacement PoC for radio-network telemetry across 18 regions on OpenShift, against a requirement of 5 million records per minute; on 18 backend nodes at 16 vCPU each they sustained roughly 200,000 rows/second (~385 MB/s) on average, with ten-second peaks above 700,000 — about 2.4× the requirement.
A telecom network-performance-monitoring vendor migrated from HDFS + HBase to Kafka + StarRocks on ten bare-metal backends. Their production data-plane xDR table is the canonical flow schema — roughly 180 columns spanning outer and inner five-tuples, per-direction packet and byte counters, detected protocol and application, client-side and network-side RTT, retransmission counts, DNS transaction and response-code fields, TLS and QUIC SNI, HTTP host and user-agent — with INDEX bmindex_imsi (imsi) USING BITMAP, PARTITION BY time_slice(end_date, 1, 'hour', 'floor'), and "partition_live_number" = "720" for automatic 30-day expiry.
A national cyber-defense agency is evaluating StarRocks as the query engine over an existing Iceberg lakehouse holding years of security telemetry. Measured on their own query shapes: roughly 3–4× faster than the Trino deployment they have run for six years, with an internal estimate that ~1,000 vCPU of Trino could drop to 250–500. Their stated reasons for looking are worth repeating because they are so domain-specific — indexing long strings, and running pinpoint queries across many columns without making copies of the data. Their n-gram index on heavy text columns “previously failed in the open-source deployment” and now works.
Publicly, the Druid-to-StarRocks pattern is documented outside networking too. Pinterest reported that after migrating an analytics application, they “reduced the p90 latency by 50% with only 32% of the instances required by the previous set up.” Haezoom, a Korean virtual-power-plant operator, and its implementation partner CloudShift published 1.74× higher throughput, 44.3% faster average response time, up to 4× on complex queries, and 30% lower infrastructure cost after moving off Druid. And iQIYI’s Hao Lin, Head of Big Data OLAP Services, described the motivation in terms any flow-analytics team will recognize: “For large-scale time-series data, we used Apache Druid, but it lacked support for detailed queries and joins.” (iQIYI states replacing Druid as a plan, not a completed migration.)
A migration that does not require a leap
The teams that do this successfully do not cut over. They dual-write from the same Kafka topics — Druid’s supervisor on one side, StarRocks Routine Load on the other — and run both for a quarter. They start with the workload Druid handles worst: the enrichment-heavy investigation queries the denormalization pipeline cannot serve, or the long-retention hunt that got cut to 30 days for cost reasons. They keep Druid for the sub-second alerting tier if they need it, shadow the customer-facing dashboards, and cut over only the ones whose results match row for row.
The denormalization pipeline is usually the last thing to go, and that is when the savings become obvious — you stop paying for the Flink cluster, the intermediate Kafka topics, the backfill jobs, and the on-call rotation for all three.
The bottom line
Druid earned its position in network flow analytics honestly. It ingests flow records fast, it groups and ranks across dozens of attributes at interactive speed, and Cisco, Verizon, NTT, Zscaler, and Swisscom did not choose it by accident.
What has changed is the workload. Enrichment against large, frequently-updated dimension tables is now the core of the analysis rather than a preprocessing step. Retention has moved from weeks to years, because that is how long an intrusion goes undetected. Records mutate after they land. Schemas differ per sensor and change without warning. And the same data now serves both an internal hunt team and an external customer dashboard.
Those five changes each push against a specific structural choice in Druid’s design: its preference for pre-joined data, its coupling of storage and query capacity in the Historical tier, its immutable segments, its ingest-time schema commitment, and its single-cluster resource pool. StarRocks answers each with a query-time distributed join planned by a cost-based optimizer, an external-catalog lakehouse tier for cold data, Primary Key tables with partial updates, native JSON with automatic columnarization, and resource groups or separate warehouses for isolation — with N-gram and inverted indexes so the substring hunting happens in the same engine as the aggregation.
If your flow platform is comfortable — the enrichment pipeline is stable, retention is adequate, nobody is asking correlation questions you cannot answer — Druid is a fine place to stay. If you recognize the Flink denormalization tier, the retention conversation you keep losing, and the prime-time query queue, the constraint is architectural, and more Druid nodes will not resolve it.
메타데이터
- post_id
- 18a5c514b6c5
- slug
- why-starrocks-is-better-than-druid-for-network-flow-and-network-security-telemetry-analytics-18a5c514b6c5
- url
- https://medium.com/@indomitability/why-starrocks-is-better-than-druid-for-network-flow-and-network-security-telemetry-analytics-18a5c514b6c5
- canonical_url
- https://medium.com/@indomitability/why-starrocks-is-better-than-druid-for-network-flow-and-network-security-telemetry-analytics-18a5c514b6c5
- author_url
- https://medium.com/@indomitability
- status
- ok
- fetched_at
- 2026-08-11 11:41:10