How to Build Performance Marketing Dashboard Using GA4? 2026 Guide
In today’s digital-first world, businesses generate massive amounts of marketing data every day. Whether it comes from Google Ads, social…
How to Build Performance Marketing Dashboard Using GA4? 2026 Guide
In today’s digital-first world, businesses generate massive amounts of marketing data every day. Whether it comes from Google Ads, social media campaigns, email marketing, organic search, or referral traffic, marketers have access to more information than ever before. However, having access to data does not automatically lead to better decisions.
One of the biggest challenges marketers face is turning scattered data into actionable insights. Different platforms provide different metrics, reports, and attribution models, making it difficult to understand what is actually driving business growth. This is where a Performance Marketing Dashboard becomes essential.
A well-designed Performance Marketing Dashboard helps marketers track campaign performance, monitor conversions, measure return on investment (ROI), and identify opportunities for optimization. Instead of switching between multiple platforms, decision-makers can view all critical performance metrics in one place.
With the introduction of Google Analytics 4 (GA4), marketers now have access to a more advanced analytics platform that focuses on event-based tracking, cross-device measurement, and customer journey analysis. GA4 makes it possible to build powerful dashboards that provide deeper insights into marketing performance.
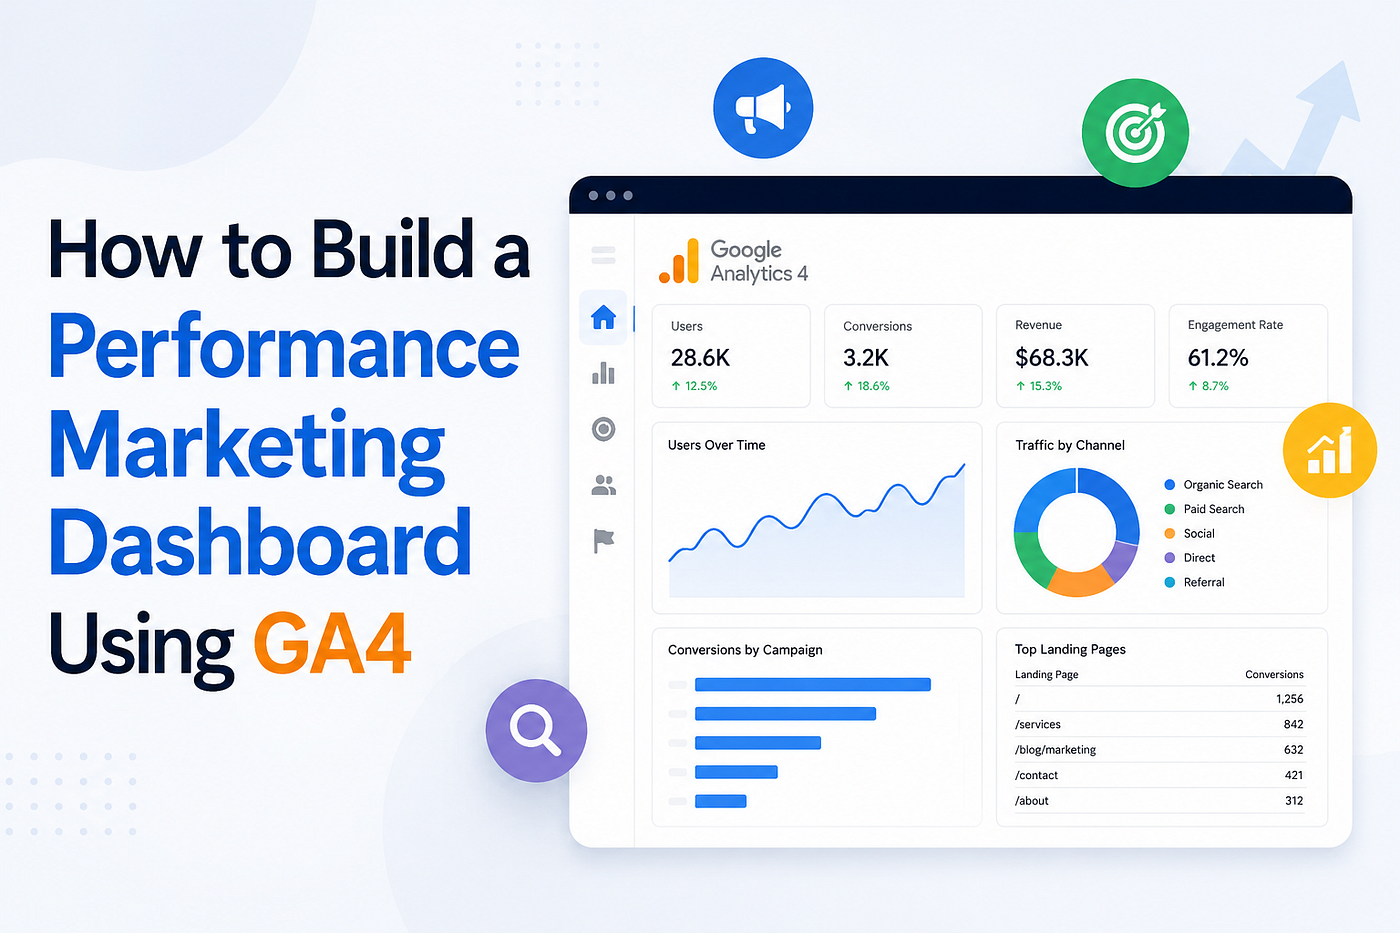
Whether you are a beginner marketer, business owner, or someone pursuing a **Performance Marketing Course**, understanding how to build a Performance Marketing Dashboard using GA4 is becoming an essential skill in today’s marketing landscape.
Why Every Performance Marketer Needs a GA4 Dashboard
Modern marketing campaigns operate across multiple channels. Customers may discover a brand through a Google search, engage through social media, and eventually convert after receiving an email.
Without a centralized dashboard, understanding this customer journey becomes difficult.
A GA4 dashboard helps marketers:
- Monitor campaign performance in real time
- Measure conversion effectiveness
- Track user engagement
- Identify high-performing traffic sources
- Improve budget allocation
- Make data-driven decisions
Instead of relying on assumptions, marketers can use actual performance data to optimize campaigns.
The Problem with Raw Marketing Data
Raw marketing data can be overwhelming.
A business running campaigns across Google Ads, Meta Ads, LinkedIn, YouTube, and organic search may collect thousands of data points every day. Looking at spreadsheets filled with numbers often creates confusion rather than clarity.
Common problems include:
- Data silos across platforms
- Inconsistent reporting
- Attribution challenges
- Lack of actionable insights
- Time-consuming manual reporting
Without proper organization, valuable opportunities may be missed.
How a Performance Marketing Dashboard Simplifies Decision-Making
A dashboard converts complex data into meaningful insights.
Instead of analyzing dozens of reports individually, marketers can quickly answer important questions:
- Which campaign generates the most conversions?
- Which traffic source drives the highest-quality visitors?
- Which landing pages convert best?
- Where is marketing budget being wasted?
- Which audience segments perform best?
GA4 dashboards help businesses make faster and smarter marketing decisions while reducing reporting complexity.
What Is a Performance Marketing Dashboard?
A Performance Marketing Dashboard is a centralized reporting system that visualizes marketing performance metrics in a single interface.
It allows marketers to monitor key performance indicators (KPIs), analyze campaign effectiveness, and evaluate business outcomes.
Rather than manually collecting reports from multiple channels, a dashboard automatically displays important metrics in an organized format.
Understanding Performance Marketing Reporting
Performance marketing focuses on measurable results.
Unlike traditional advertising, where success can be difficult to quantify, performance marketing tracks specific actions such as:
- Website visits
- Leads
- Purchases
- Sign-ups
- Downloads
- Form submissions
Reporting is critical because every marketing activity must contribute to business goals.
A dashboard helps marketers continuously evaluate performance and improve outcomes.
How GA4 Helps Measure Marketing Performance
Google Analytics 4 represents a major shift from Universal Analytics.
Instead of focusing primarily on sessions and pageviews, GA4 uses an event-based data model.
This means every interaction can be measured as an event, including:
- Page views
- Scrolls
- Video views
- Button clicks
- Purchases
- Form submissions
This approach provides a more complete understanding of user behavior.
GA4 also offers:
- Cross-platform tracking
- Predictive analytics
- Enhanced attribution
- Customer journey analysis
- Advanced audience segmentation
These capabilities make GA4 one of the most powerful tools for performance marketers.
Benefits of Centralized Reporting
Centralized reporting provides several advantages:
Improved Visibility
Teams can access all important metrics from a single dashboard.
Faster Decision-Making
Marketers spend less time collecting data and more time analyzing it.
Better Collaboration
Stakeholders across departments can work from the same data source.
Increased Accuracy
Automated reporting reduces human errors.
Enhanced Optimization
Real-time insights allow marketers to improve campaigns quickly.
For professionals enrolled in a **Performance Marketing Course Online**, learning how centralized reporting works is often one of the most practical skills taught because businesses increasingly depend on data-driven marketing strategies.
Planning Your Dashboard Before Building It
Many marketers jump directly into dashboard creation without proper planning.
This often results in dashboards filled with unnecessary metrics that provide little business value.
Before opening GA4, it is important to define objectives and reporting requirements.
Define Business Goals and Marketing Objectives
Every dashboard should support business goals.
Start by asking:
- What is the primary business objective?
- What outcomes define success?
- Which marketing channels contribute most to growth?
Examples include:
Lead Generation Goals
- Form submissions
- Consultation bookings
- Demo requests
Ecommerce Goals
- Revenue
- Transactions
- Average order value
Brand Awareness Goals
- Traffic growth
- Engagement metrics
- Video views
The dashboard should prioritize metrics directly connected to these objectives.
Identify Key Stakeholders and Reporting Needs
Different stakeholders require different information.
Marketing Managers
Need campaign-level insights and channel performance data.
Executives
Prefer high-level business outcomes and ROI metrics.
Advertising Teams
Focus on campaign optimization and conversion performance.
Content Teams
Need engagement and content performance metrics.
Understanding stakeholder requirements helps create dashboards that deliver relevant insights.
Selecting the Right KPIs for Performance Marketing
Choosing the right KPIs is one of the most important steps.
Good KPIs should be:
- Relevant
- Actionable
- Measurable
- Aligned with business goals
Common performance marketing KPIs include:
- Users
- Sessions
- Conversion rate
- Revenue
- Cost per acquisition (CPA)
- Return on ad spend (ROAS)
- Engagement rate
- Customer lifetime value
Avoid adding metrics simply because they are available.
Every KPI should support decision-making.
Many learners taking an online performance marketing course discover that successful marketers focus on a small set of meaningful KPIs rather than tracking every available metric.
Key Metrics to Track in a GA4 Performance Marketing Dashboard
One of the biggest differences between GA4 and previous analytics platforms is its event-based architecture.
Instead of focusing solely on sessions, GA4 measures user interactions through events.
As a result, selecting the right metrics becomes critical.
Let’s explore the most important metrics every Performance Marketing Dashboard should include.
Users and New Users
Users represent unique individuals visiting your website.
Tracking users helps marketers understand audience growth and acquisition trends.
Why It Matters
User growth often indicates increasing brand visibility and marketing effectiveness.
Important metrics include:
- Total users
- New users
- Returning users
- User growth rate
Comparing new and returning users can reveal whether campaigns are attracting fresh audiences while retaining existing customers.
Sessions and Engagement Metrics
Sessions represent periods of user interaction with your website.
However, engagement metrics provide deeper insights into visitor quality.
Key engagement metrics include:
Engaged Sessions
Sessions lasting longer than 10 seconds, containing multiple page views, or resulting in conversions.
Engagement Rate
The percentage of engaged sessions compared to total sessions.
Average Engagement Time
Measures how long users actively interact with your website.
Views Per Session
Indicates how many pages users consume during a visit.
These metrics help determine whether traffic is genuinely interested in your content.
Event Tracking and Event Count
Events are the foundation of GA4 reporting.
Every meaningful user interaction can be measured through events.
Examples include:
- Button clicks
- Video plays
- Scroll depth
- Downloads
- Form submissions
- Purchases
Why Event Tracking Matters
Event tracking allows marketers to understand how users interact with their website before converting.
This helps identify:
- Conversion barriers
- User behavior patterns
- Content engagement opportunities
Proper event implementation significantly improves dashboard accuracy.
Conversions and Conversion Rate
Conversions are among the most important metrics in performance marketing.
A conversion occurs when a user completes a desired action.
Examples include:
- Lead generation forms
- Purchases
- Newsletter sign-ups
- Appointment bookings
Conversion Rate Formula
Conversion Rate = Conversions ÷ Total Users × 100
A higher conversion rate generally indicates better campaign performance and user experience.
Why Conversion Tracking Is Critical
Conversion tracking helps marketers:
- Measure campaign success
- Optimize landing pages
- Improve targeting strategies
- Increase ROI
For professionals building skills through a Performance Marketing Course, mastering conversion tracking is often one of the most valuable competencies because conversions directly impact business revenue.
Revenue and Purchase Metrics
For ecommerce businesses, revenue metrics are essential.
GA4 provides detailed revenue reporting that helps marketers understand financial performance.
Important revenue metrics include:
Total Revenue
Measures total income generated.
Transactions
Tracks completed purchases.
Average Order Value (AOV)
Shows average spending per transaction.
Revenue Per User
Measures revenue generated by each visitor.
These insights help marketers evaluate campaign profitability.
Traffic Source Performance
Not all traffic sources deliver equal value.
Some channels may generate large amounts of traffic but few conversions.
Others may generate smaller volumes of highly qualified visitors.
Key traffic source dimensions include:
- Organic Search
- Paid Search
- Direct Traffic
- Social Media
- Referral Traffic
- Email Marketing
Monitoring source performance helps marketers allocate budgets more effectively.
Campaign Performance Metrics
Campaign reporting helps evaluate the effectiveness of individual marketing initiatives.
Important campaign metrics include:
- Campaign sessions
- Campaign conversions
- Cost per conversion
- Return on ad spend
- Revenue generated
- Conversion rate by campaign
By comparing campaign performance, marketers can identify which initiatives deserve increased investment.
Landing Page Performance
Landing pages often determine whether visitors convert or leave.
Tracking landing page performance is critical for optimization.
Important landing page metrics include:
Entrances
The number of users who begin their journey on a specific page.
Engagement Rate
Measures user interaction levels.
Conversion Rate
Shows how effectively the page generates desired actions.
Revenue Contribution
Measures how much revenue each page generates.
Landing page insights help marketers improve content, design, and conversion paths.
A well-structured Performance Marketing Dashboard starts with selecting the right metrics. Once the foundation is established, the next step is configuring GA4 correctly and creating custom reports that transform raw data into actionable insights. In the next section, we’ll cover setting up GA4 for accurate performance tracking, creating custom reports, using segments, and building a dashboard structure that supports business growth.
Setting Up GA4 for Accurate Performance Tracking
Building a Performance Marketing Dashboard is only effective when the data behind it is accurate. Even the most visually appealing dashboard becomes useless if tracking is configured incorrectly.
Before creating reports and dashboards, marketers must ensure that GA4 is collecting reliable data from every important user interaction.
Configuring Events and Conversions
GA4 uses an event-based measurement model. Every interaction on a website can be tracked as an event, allowing marketers to gain a detailed understanding of user behavior.
Common Events to Track
Depending on business goals, marketers may track:
- Page views
- Scroll tracking
- Form submissions
- Button clicks
- Video engagement
- Newsletter sign-ups
- Product views
- Add-to-cart actions
- Purchases
Marking Events as Conversions
Not every event is equally important.
GA4 allows marketers to mark selected events as conversions. These become the primary indicators of campaign success.
Examples include:
- Lead form submission
- Demo booking
- Purchase completion
- Trial registration
By accurately defining conversion events, marketers can measure which channels and campaigns contribute directly to business growth.
Why Conversion Configuration Matters
Poor conversion tracking often leads to:
- Incorrect ROI calculations
- Misleading campaign reports
- Budget allocation mistakes
- Inaccurate attribution analysis
A properly configured GA4 account ensures dashboard insights remain trustworthy.
Linking Google Ads with GA4
One of the most important integrations for performance marketers is connecting Google Ads with GA4.
This connection enables marketers to understand how advertising campaigns influence website behavior and conversions.
Benefits of Linking Google Ads
When Google Ads and GA4 work together, marketers can:
- Import conversions into Google Ads
- Measure campaign effectiveness
- Analyze user journeys
- Improve audience targeting
- Optimize bidding strategies
Key Metrics Unlocked Through Integration
- Cost per conversion
- Campaign engagement metrics
- Revenue by campaign
- Conversion paths
- Return on ad spend (ROAS)
This integration creates a more complete picture of paid marketing performance.
Implementing UTM Parameters Correctly
UTM parameters help marketers identify where website traffic originates.
Without proper UTM tracking, campaign data becomes fragmented and difficult to analyze.
Common UTM Parameters
Source
Identifies the traffic source.
Example:
Medium
Identifies the marketing channel.
Examples:
- CPC
- Organic
- Social
Campaign
Specifies the campaign name.
Examples:
- Summer Sale
- Lead Generation Campaign
- Product Launch
Why UTM Consistency Matters
Inconsistent naming creates reporting issues.
For example:
- FB
GA4 may treat these as separate sources, making analysis inaccurate.
A standardized UTM naming convention keeps reporting clean and reliable.
Ensuring Data Accuracy Before Reporting
Before building dashboards, verify that data collection works properly.
Conduct Tracking Audits
Check:
- Event firing
- Conversion tracking
- Campaign attribution
- Ecommerce tracking
Use DebugView
GA4’s DebugView allows marketers to verify event collection in real time.
Compare Platform Data
Compare:
- GA4 conversions
- Google Ads conversions
- CRM leads
- Sales data
Minor differences are normal, but significant discrepancies should be investigated.
Data accuracy is the foundation of every successful dashboard.
Creating Custom Reports in GA4
Once tracking is configured correctly, the next step is creating reports that provide actionable insights.
Custom reports allow marketers to focus on metrics that matter most to their business goals.
Overview Reports vs Detail Reports
GA4 provides different report types for different reporting needs.
Overview Reports
Overview reports provide high-level summaries.
They help answer questions such as:
- How is overall traffic performing?
- Are conversions increasing?
- Which channels are driving growth?
These reports are ideal for executives and senior stakeholders.
Detail Reports
Detail reports provide deeper analysis.
They help marketers understand:
- User behavior
- Campaign performance
- Landing page effectiveness
- Conversion paths
Most performance marketing optimization happens through detail reports.
Building Reports from Templates
GA4 includes report templates that can be customized.
Popular templates include:
Acquisition Reports
Analyze traffic sources and channel performance.
Engagement Reports
Measure user interactions and engagement quality.
Monetization Reports
Track revenue and ecommerce performance.
Retention Reports
Understand repeat visitor behavior.
Templates provide a fast starting point while allowing further customization.
Creating Reports from Scratch
Custom reports allow complete flexibility.
Marketers can choose:
- Metrics
- Dimensions
- Filters
- Visualizations
Example Custom Performance Marketing Report
Dimensions:
- Source
- Medium
- Campaign
Metrics:
- Users
- Sessions
- Conversions
- Revenue
This report quickly identifies high-performing campaigns.
Why Custom Reports Matter
Every business has unique goals.
Custom reports ensure dashboards focus on the metrics that directly impact business outcomes.
Customizing Metrics and Dimensions
The effectiveness of a dashboard depends heavily on selecting the right dimensions and metrics.
Common Dimensions
- Source
- Medium
- Campaign
- Device category
- Country
- Landing page
Common Metrics
- Users
- Sessions
- Engagement rate
- Conversions
- Revenue
- Event count
Combining dimensions and metrics creates meaningful insights.
For example:
Campaign + Revenue
reveals which campaigns generate the most income.
Landing Page + Conversion Rate
shows which pages perform best.
Using Filters to Focus on Relevant Data
Filters help eliminate unnecessary information.
Instead of analyzing all traffic, marketers can focus on specific segments.
Useful Filters
Paid Traffic Only
Evaluate advertising performance separately.
Organic Traffic Only
Analyze SEO effectiveness.
Specific Campaigns
Monitor campaign-level results.
Device Type
Compare desktop and mobile performance.
Filtering helps marketers identify opportunities faster and make more informed decisions.
Using Segments to Improve Marketing Analysis
One of GA4’s most powerful features is segmentation.
Segments allow marketers to analyze specific groups of users rather than viewing all visitors as a single audience.
This leads to more precise insights and better optimization decisions.
What Are GA4 Segments?
A segment is a subset of users, sessions, or events that share specific characteristics.
Rather than asking:
“How did the website perform?”
Segmentation allows marketers to ask:
“How did paid search visitors perform?”
or
“How did returning customers behave?”
These insights are far more valuable.
Audience Segmentation for Better Insights
Different audiences behave differently.
Segmenting users helps uncover patterns that may remain hidden in aggregate reports.
Examples of Audience Segments
- New users
- Returning users
- Mobile users
- Desktop users
- High-value customers
- Cart abandoners
Each audience may require a different marketing strategy.
Segmenting by Traffic Source
Traffic sources rarely perform equally.
Segmenting by source helps marketers compare channel effectiveness.
Common Source Segments
Organic Search
Measures SEO performance.
Paid Search
Evaluates PPC campaigns.
Social Media
Tracks engagement from social channels.
Email Marketing
Measures email campaign effectiveness.
Referral Traffic
Identifies valuable partner websites.
This segmentation improves budget allocation decisions.
Segmenting by Campaign Performance
Campaign-level segmentation helps marketers identify winning campaigns.
Metrics to compare include:
- Conversions
- Revenue
- Engagement rate
- Cost efficiency
- Return on ad spend
By analyzing campaigns individually, marketers can scale successful initiatives while reducing spending on underperforming efforts.
Segmenting New vs Returning Users
This is one of the most valuable analyses in performance marketing.
New Users
Often indicate acquisition success.
Metrics to evaluate:
- Traffic volume
- Engagement
- Conversion rate
Returning Users
Often indicate brand loyalty and customer retention.
Metrics to evaluate:
- Repeat purchases
- Revenue
- Lifetime value
Understanding both groups helps marketers balance acquisition and retention strategies.
Many professionals enrolled in an **Online Performance Marketing Course** learn that audience segmentation often reveals optimization opportunities that broad reporting completely misses.
Building Your Performance Marketing Dashboard
Now that tracking, reporting, and segmentation are configured correctly, it’s time to build the actual dashboard.
The goal is not simply to display data.
The goal is to create a reporting system that supports decision-making.
Creating a Dashboard Structure
A successful dashboard follows a logical structure.
Information should flow from high-level business outcomes to detailed performance metrics.
Recommended Structure
Executive Overview
- Users
- Conversions
- Revenue
- ROI
Acquisition Performance
- Traffic sources
- Channel performance
Campaign Performance
- Paid campaigns
- Conversion tracking
Landing Page Performance
- Engagement
- Conversion rates
Revenue Analysis
- Ecommerce metrics
- Revenue trends
This structure helps stakeholders find information quickly.
Organizing Reports into Collections
GA4 allows reports to be grouped into collections.
Collections help organize reporting based on business needs.
Example Collections
Executive Collection
Focused on business outcomes.
Marketing Collection
Focused on campaign performance.
Ecommerce Collection
Focused on revenue and sales metrics.
Content Collection
Focused on engagement and content effectiveness.
Proper organization improves reporting efficiency.
Designing Stakeholder-Friendly Views
Different stakeholders require different levels of detail.
Executive View
Executives typically want:
- Revenue
- Growth
- ROI
- Conversion trends
Marketing Team View
Marketers often need:
- Campaign performance
- Attribution insights
- Audience behavior
- Channel analysis
Tailoring views improves dashboard usability.
Creating Executive and Marketing Team Dashboards
A single dashboard rarely satisfies every stakeholder.
Creating separate dashboards often improves clarity.
Executive Dashboard
Focus on:
- Revenue
- Conversion growth
- Cost efficiency
- Strategic KPIs
Marketing Dashboard
Focus on:
- Campaign metrics
- Audience segments
- Channel performance
- Landing page results
This separation ensures each audience receives relevant insights.
Publishing and Sharing Dashboard Collections
A dashboard only creates value when stakeholders use it.
Best Practices for Sharing
- Keep reports simple
- Update data regularly
- Standardize metrics
- Provide clear naming conventions
- Limit unnecessary visualizations
Shared dashboards become a single source of truth across the organization.
Businesses increasingly seek professionals who can build these reporting systems. This is one reason why an online performance marketing course often includes extensive training on GA4 reporting, dashboard creation, attribution analysis, and campaign measurement.
Organizations that invest in analytics capabilities gain a significant competitive advantage because they can make faster and more informed marketing decisions.
As discussed by industry trainers and institutions such as **WsCube Tech**, performance marketers who understand data visualization and reporting are becoming highly valuable across startups, agencies, and enterprise organizations.
Essential Dashboard Sections Every Marketer Should Include
A Performance Marketing Dashboard should do more than display numbers. It should help marketers understand what is working, what is underperforming, and where optimization opportunities exist.
The following dashboard sections form the core of a high-performing GA4 reporting framework.
Campaign Performance Dashboard
Campaign reporting is one of the most important sections for any performance marketer.
It helps answer questions such as:
- Which campaigns generate the most conversions?
- Which campaigns produce the highest ROI?
- Which campaigns need optimization?
Measuring Paid Campaign Results
Paid campaigns often consume a significant portion of the marketing budget.
Tracking campaign performance helps marketers evaluate whether investments are delivering results.
Important metrics include:
- Campaign sessions
- Click-through rate (CTR)
- Conversion rate
- Cost per acquisition (CPA)
- Revenue generated
- Return on ad spend (ROAS)
Regular monitoring allows marketers to identify top-performing campaigns and scale them effectively.
Tracking Source, Medium, and Campaign Data
GA4 enables detailed campaign analysis through source, medium, and campaign dimensions.
Examples include:
- Google / CPC
- Facebook / Paid Social
- LinkedIn / Sponsored Content
- Email / Newsletter
Tracking these dimensions helps marketers understand which channels contribute most to business goals.
Traffic Acquisition Dashboard
Traffic acquisition reporting focuses on how users discover and access a website.
This dashboard section is critical for understanding channel effectiveness.
Identifying Top Traffic Sources
Not all channels perform equally.
GA4 allows marketers to compare:
- Organic Search
- Paid Search
- Direct Traffic
- Social Media
- Referral Traffic
- Email Marketing
Analyzing traffic sources helps businesses identify where their most valuable visitors originate.
Evaluating Channel Performance
Beyond traffic volume, marketers should evaluate traffic quality.
Important metrics include:
- Engagement rate
- Average engagement time
- Conversion rate
- Revenue per user
A channel generating fewer visitors but higher conversions may be more valuable than a channel delivering large amounts of low-quality traffic.
Landing Page Performance Dashboard
Landing pages often determine whether visitors convert or leave.
Even the best campaigns can fail if landing pages are poorly optimized.
Monitoring High-Value Pages
High-value pages include:
- Product pages
- Service pages
- Lead generation pages
- Pricing pages
- Webinar registration pages
Monitoring these pages helps marketers identify optimization opportunities.
Improving Engagement and Conversion Rates
Key landing page metrics include:
- Entrances
- Engagement rate
- Scroll depth
- Bounce indicators
- Conversion rate
When performance drops, marketers can investigate content quality, page speed, user experience, and call-to-action placement.
Conversion Dashboard
The conversion dashboard focuses on business outcomes.
This section often receives the most attention because conversions directly impact revenue and growth.
Tracking Micro and Macro Conversions
Conversions can be categorized into two types.
Micro Conversions
Smaller actions that indicate interest.
Examples include:
- Newsletter subscriptions
- PDF downloads
- Video views
- Form starts
Macro Conversions
Primary business objectives.
Examples include:
- Purchases
- Lead submissions
- Consultation bookings
- Paid subscriptions
Tracking both provides a complete understanding of the customer journey.
Funnel-Based Conversion Reporting
GA4 funnel analysis helps marketers understand where users drop off.
A typical lead-generation funnel may look like:
- Landing Page Visit
- Form Start
- Form Completion
- Lead Generated
By identifying drop-off points, marketers can improve conversion rates.
Revenue and Sales Dashboard
For ecommerce businesses, revenue reporting is essential.
This dashboard section connects marketing efforts directly to financial performance.
Monitoring Ecommerce Performance
GA4 provides detailed ecommerce reporting including:
- Total revenue
- Transactions
- Average order value
- Revenue by channel
- Revenue by campaign
These metrics help marketers evaluate profitability.
Tracking Revenue by Campaign and Channel
Understanding revenue attribution allows businesses to invest confidently in successful channels.
Examples:
- Organic search revenue
- Paid search revenue
- Social media revenue
- Email marketing revenue
This analysis supports smarter budget allocation.
Attribution Dashboard
Customer journeys are rarely linear.
Users often interact with multiple touchpoints before converting.
Attribution reporting helps marketers understand these interactions.
Understanding Conversion Paths
A typical customer journey may involve:
- Organic search
- Social media engagement
- Email nurturing
- Paid retargeting campaign
Without attribution reporting, marketers may incorrectly credit only the final interaction.
Comparing Attribution Models
GA4 provides multiple attribution models.
These include:
- Data-driven attribution
- Last-click attribution
- First-click attribution
Comparing models helps marketers understand how different channels contribute throughout the customer journey.
Attribution analysis has become one of the most valuable skills taught in a modern Performance Marketing Course because businesses increasingly demand marketers who can accurately measure channel contribution.
Best Practices for Dashboard Design
A dashboard should make decision-making easier, not more complicated.
Following proven design principles improves usability and reporting effectiveness.
Keep Visualizations Simple
Complex charts often confuse stakeholders.
Use:
- Line charts
- Bar charts
- KPI scorecards
- Trend visualizations
Simple visuals improve comprehension.
Avoid Vanity Metrics
Not every metric deserves dashboard space.
Examples of vanity metrics include:
- Impressions without conversions
- Followers without engagement
- Traffic without revenue impact
Focus on metrics that influence business outcomes.
Focus on Actionable Insights
Every metric should support decision-making.
Ask:
- What action can be taken based on this metric?
- Does this metric help improve performance?
If not, it may not belong in the dashboard.
Create Clear Reporting Hierarchies
Organize information logically.
Recommended order:
- Business outcomes
- Channel performance
- Campaign performance
- Landing page analysis
- Audience insights
This structure improves navigation and understanding.
Use Consistent Naming Conventions
Consistency improves reporting accuracy.
Examples:
- Use standardized UTM naming
- Maintain campaign naming rules
- Standardize event names
Consistency prevents confusion and improves long-term reporting quality.
Common Mistakes to Avoid
Even experienced marketers make reporting mistakes.
Avoiding these issues can significantly improve dashboard effectiveness.
Tracking Too Many Metrics
One of the most common mistakes is including every available metric.
More data does not always mean better insights.
Focus on metrics that align with business goals.
Ignoring Attribution Differences
Different platforms use different attribution models.
Google Ads, Meta Ads, and GA4 may report different conversion numbers.
Understanding attribution differences prevents inaccurate conclusions.
Poor UTM Management
Inconsistent UTM naming creates fragmented reports.
Examples:
- FB
These may appear as separate traffic sources.
Establish clear UTM guidelines before launching campaigns.
Building Dashboards Without Business Goals
Dashboards should support strategic objectives.
Without defined goals, reporting becomes directionless.
Always start with business outcomes before selecting metrics.
Not Validating Data Regularly
Tracking issues can occur unexpectedly.
Regular audits help identify:
- Broken events
- Missing conversions
- Attribution problems
- Ecommerce tracking issues
Accurate data is critical for effective decision-making.
Automating and Scaling Performance Reporting
As businesses grow, manual reporting becomes increasingly inefficient.
Automation helps marketers save time and focus on optimization.
Using Looker Studio with GA4
Looker Studio is one of the most popular reporting tools for GA4 users.
Benefits include:
- Interactive dashboards
- Real-time reporting
- Advanced visualizations
- Custom reporting capabilities
Many organizations use Looker Studio as their primary dashboard platform.
Combining Data from Multiple Marketing Channels
Modern marketing requires visibility across multiple platforms.
Common integrations include:
- Google Ads
- Meta Ads
- LinkedIn Ads
- Search Console
- CRM platforms
- Ecommerce platforms
Combining data creates a more comprehensive view of marketing performance.
Creating Automated Reporting Workflows
Automation eliminates repetitive reporting tasks.
Examples include:
- Scheduled reports
- Automated dashboards
- Real-time KPI monitoring
- Stakeholder reporting systems
This reduces manual effort and improves efficiency.
Reducing Manual Reporting Effort
Marketing teams often spend hours collecting data.
Automation allows teams to:
- Focus on optimization
- Improve campaign strategy
- Increase productivity
- Accelerate decision-making
Professionals pursuing a Performance Marketing Course Online frequently learn dashboard automation because modern organizations increasingly prioritize efficiency and scalable reporting systems.
Similarly, advanced modules in an online performance marketing course often focus on integrating GA4, Looker Studio, CRM systems, and advertising platforms into a unified reporting ecosystem.
Businesses that successfully automate reporting gain a significant competitive advantage because they can react faster to market changes and campaign performance trends.
As highlighted by leading digital marketing training providers such as WsCube Tech, data-driven decision-making is now a core skill for performance marketers looking to advance their careers.
FAQs About Building a Performance Marketing Dashboard Using GA4
1. What is a performance marketing dashboard in GA4?
A performance marketing dashboard is a centralized reporting interface that tracks marketing KPIs, conversions, traffic sources, and revenue using GA4 data.
2. Which metrics should be included in a GA4 dashboard?
Key metrics include users, sessions, engagement rate, conversions, revenue, campaign performance, and traffic source data.
3. How do I create a custom dashboard in GA4?
You can build custom reports, organize them into collections, apply filters, and customize dimensions and metrics based on business goals.
4. Can GA4 track campaign performance across multiple channels?
Yes. GA4 can measure performance across paid search, organic search, social media, email marketing, and referral traffic.
5. What is the difference between reports and dashboards in GA4?
Reports provide detailed analysis, while dashboards present key metrics and insights in a summarized visual format.
6. How do segments improve performance marketing analysis?
Segments allow marketers to analyze specific user groups, traffic sources, campaigns, or customer behaviors separately.
7. Should I use Looker Studio with GA4?
Yes. Looker Studio enhances GA4 reporting by providing customizable dashboards and advanced visualization options.
8. How often should a performance marketing dashboard be updated?
Most businesses update dashboards daily or in real time to ensure timely decision-making.
9. How does attribution affect marketing reporting in GA4?
Attribution determines how conversion credit is assigned across customer touchpoints, helping marketers understand channel contribution.
10. What are the biggest mistakes when building a GA4 dashboard?
Common mistakes include tracking too many metrics, poor UTM management, ignoring attribution differences, and failing to validate data regularly.
Conclusion
A Performance Marketing Dashboard is far more than a reporting tool. It serves as the central hub for understanding marketing performance, measuring business outcomes, and guiding strategic decisions.
Google Analytics 4 has transformed how marketers collect and analyze data. Its event-based model, advanced segmentation capabilities, attribution reporting, and integration options make it one of the most powerful platforms available for performance measurement.
Building an effective dashboard begins with clear business objectives. Once goals are established, marketers can identify relevant KPIs, configure accurate tracking, create custom reports, build meaningful segments, and organize insights into stakeholder-friendly dashboards.
The most successful dashboards focus on clarity rather than complexity. They prioritize actionable insights, eliminate unnecessary metrics, and support faster decision-making.
Whether managing campaigns for a startup, agency, or enterprise organization, the ability to build and maintain a Performance Marketing Dashboard using GA4 has become an essential skill for modern marketers. Those who master analytics, reporting, attribution, and optimization will be better positioned to improve campaign performance, maximize ROI, and contribute directly to business growth.
메타데이터
- post_id
- 1933d1d7e53b
- slug
- how-to-build-performance-marketing-dashboard-using-ga4-1933d1d7e53b
- url
- https://medium.com/@pranjalmehta183/how-to-build-performance-marketing-dashboard-using-ga4-1933d1d7e53b
- canonical_url
- https://medium.com/@pranjalmehta183/how-to-build-performance-marketing-dashboard-using-ga4-1933d1d7e53b
- author_url
- https://medium.com/@pranjalmehta183
- status
- ok
- fetched_at
- 2026-07-21 00:41:21



