Count Cells Less Than Specific Values in Python: A Complete Guide with Simulated Data and Code…
This article provides a complete guide on how to count cells with values less than a specific number using Python, featuring an end-to-end…
Count Cells Less Than Specific Values in Python: A Complete Guide with Simulated Data and Code Examples
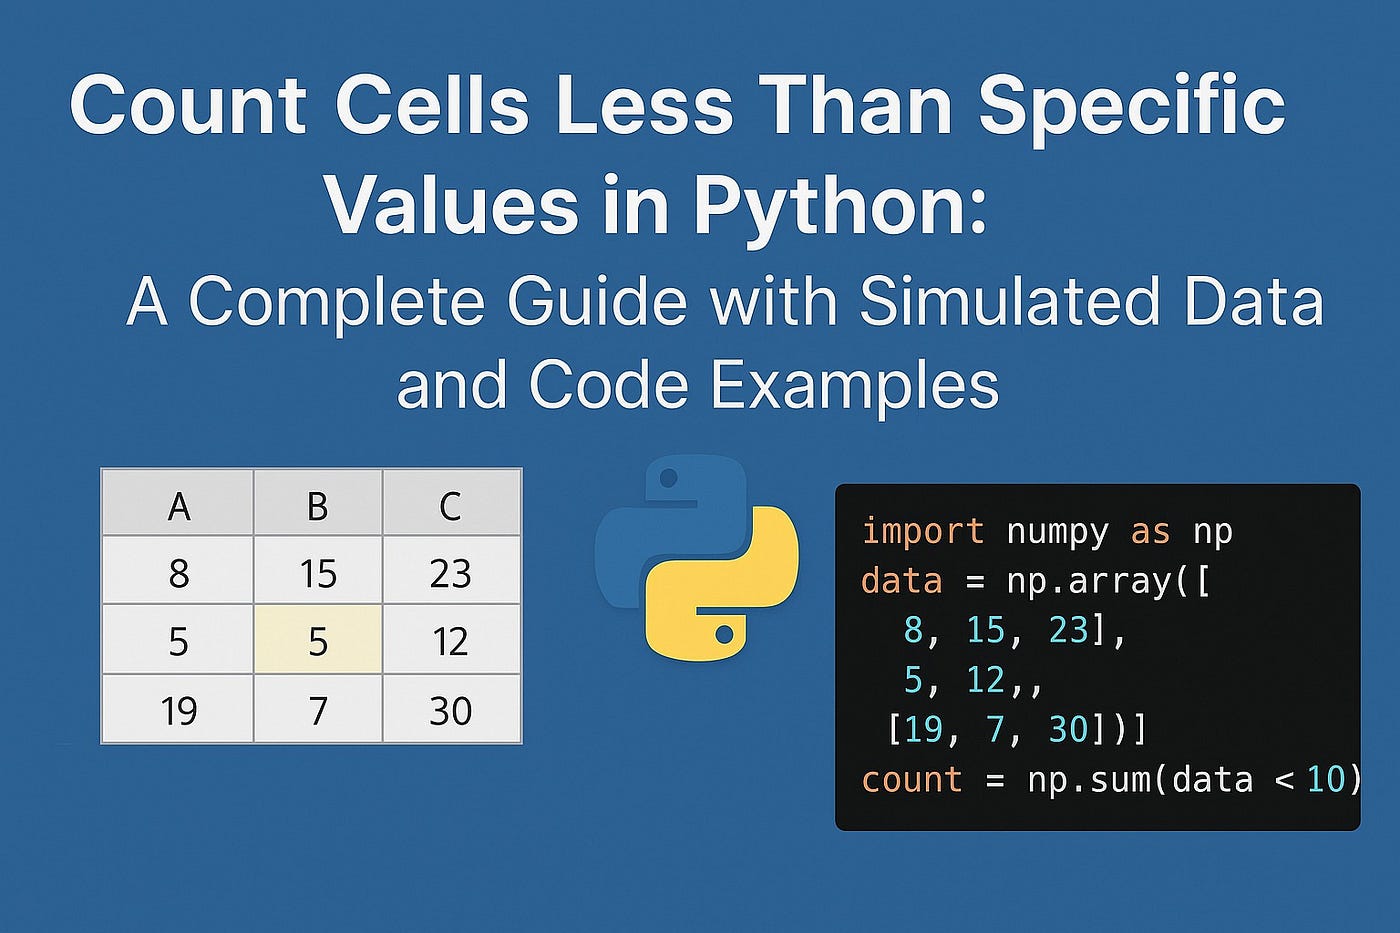
This article provides a complete guide on how to count cells with values less than a specific number using Python, featuring an end-to-end example with data simulation, filtering, dynamic thresholding, and visualization.
Download all articles from: Mini Recipes on Advanced Data Analysis & Machine learning using Python, R, SQL, VBA and Excel
Introduction
In data analysis, counting the number of cells (data points) that meet specific conditions is a common requirement. Whether you’re analyzing sales data, financial transactions, or quality control records, counting values less than a specific threshold can provide useful insights.
Python, with its powerful data analysis libraries like pandas and numpy, makes it easy to perform such operations efficiently. In this guide, we will demonstrate how to count values below a specific threshold, generate a simulated dataset, and visualize the results.
Understanding the Problem
Counting values less than a given threshold is useful in many real-world scenarios:
- Business Analytics: Identifying underperforming sales figures.
- Finance: Tracking transactions below a set limit.
- Quality Control: Detecting defective products below an acceptable measurement.
- Statistics: Counting occurrences below a certain percentile.
Python provides multiple ways to handle this operation efficiently, and we will explore them in this tutorial.
Setting Up the Python Environment
To begin, install the required libraries if you haven’t already:
!pip install pandas numpy matplotlib seabornNow, import the necessary packages:
import numpy as np
import pandas as pd
import matplotlib.pyplot as plt
import seaborn as sns
These libraries will help us with data manipulation, analysis, and visualization.
Generating Simulated Data in Python
We will create a dataset of 1000 random numerical values ranging between 1 and 100 using numpy.
# Set seed for reproducibility
np.random.seed(42)

# Generate random dataset
data = pd.DataFrame({
    'ID': range(1, 1001),
    'Value': np.random.randint(1, 101, size=1000)  # Values between 1 and 100
})
# Display first few rows
data.head()
This dataset contains two columns: ID (serial number) and Value (random numbers between 1 and 100).
Counting Cells Less Than a Specific Value Using Python
Using Boolean Indexing and sum()
The simplest way to count values less than a threshold (e.g., 50) is:
threshold = 50
count_less_than_threshold = (data['Value'] < threshold).sum()
print(f'Number of values less than {threshold}: {count_less_than_threshold}')
Using query() and len() in Pandas
Another method to count values below a threshold is using query():
count_less_than_threshold = len(data.query("Value < 50"))
print(f'Count using query: {count_less_than_threshold}')
Both methods return the same result.
Using Dynamic Thresholds for Counting
Instead of hardcoding the threshold, allow users to define it dynamically:
def count_below_threshold(df, threshold):
    return (df['Value'] < threshold).sum()
# Example usage
threshold_input = int(input("Enter threshold value: "))
count_result = count_below_threshold(data, threshold_input)
print(f'Number of values below {threshold_input}: {count_result}')
This function enables users to input their own threshold values dynamically.
Applying Conditional Filtering in Pandas DataFrames
To extract and display values below a certain threshold:
low_values = data[data['Value'] < 30]
print(low_values)
This allows further analysis on filtered records.
Using Data Visualization to Show Count Results
Creating a Histogram
A histogram helps visualize the distribution of values and highlight those below the threshold.
plt.figure(figsize=(10,5))
threshold = 50
sns.histplot(data['Value'], bins=20, kde=True, color='blue', alpha=0.7)
plt.axvline(threshold, color='red', linestyle='dashed', linewidth=2, label=f'Threshold = {threshold}')
plt.title("Distribution of Values with Threshold")
plt.xlabel("Value")
plt.ylabel("Count")
plt.legend()
plt.show()
Creating a Bar Chart for Counts
counts = pd.DataFrame({
    'Category': [f'Below {threshold}', f'Above {threshold}'],
    'Count': [sum(data['Value'] < threshold), sum(data['Value'] >= threshold)]
})

plt.figure(figsize=(8,5))
sns.barplot(x='Category', y='Count', data=counts, palette='coolwarm')
plt.title("Comparison of Value Counts")
plt.xlabel("Category")
plt.ylabel("Number of Values")
plt.show()
These visualizations provide a clear picture of the data distribution and the number of values below the threshold.
Full End-to-End Python Implementation
# Import necessary libraries
import numpy as np
import pandas as pd
import matplotlib.pyplot as plt
import seaborn as sns

# Generate synthetic dataset
np.random.seed(42)
data = pd.DataFrame({
    'ID': range(1, 1001),
    'Value': np.random.randint(1, 101, size=1000)
})
# Define threshold
threshold = 50
# Count values below threshold
count_below = (data['Value'] < threshold).sum()
print(f'Number of values less than {threshold}: {count_below}')
# Visualizing Data
plt.figure(figsize=(10,5))
sns.histplot(data['Value'], bins=20, kde=True, color='blue', alpha=0.7)
plt.axvline(threshold, color='red', linestyle='dashed', linewidth=2, label=f'Threshold = {threshold}')
plt.title("Distribution of Values with Threshold")
plt.xlabel("Value")
plt.ylabel("Count")
plt.legend()
plt.show()
counts = pd.DataFrame({
    'Category': [f'Below {threshold}', f'Above {threshold}'],
    'Count': [sum(data['Value'] < threshold), sum(data['Value'] >= threshold)]
})
plt.figure(figsize=(8,5))
sns.barplot(x='Category', y='Count', data=counts, palette='coolwarm')
plt.title("Comparison of Value Counts")
plt.xlabel("Category")
plt.ylabel("Number of Values")
plt.show()
Conclusion
In this guide, we demonstrated how to:
- Generate random numerical data in Python.
- Use
sum()andquery()to count values below a threshold. - Filter data efficiently for further analysis.
- Create visualizations with
matplotlibandseaborn.
When to Use This Approach?
- When performing data analysis that requires filtering low values.
- When analyzing financial transactions, sales, or experimental data.
- When creating visual reports and dashboards for better insights.
With these techniques, you can efficiently analyze datasets and extract meaningful insights in Python. 🚀
Full End-to-End Python Implementation
# Import necessary libraries
import numpy as np
import pandas as pd
import matplotlib.pyplot as plt
import seaborn as sns
import warnings
warnings.filterwarnings("ignore")

# Generate synthetic dataset
np.random.seed(42)
data = pd.DataFrame({
    'ID': range(1, 1001),
    'Value': np.random.randint(1, 101, size=1000)
})
# Define threshold
threshold = 50
# Count values below threshold
count_below = (data['Value'] < threshold).sum()
print(f'Number of values less than {threshold}: {count_below}')
# Visualizing Data
plt.figure(figsize=(10,5))
sns.histplot(data['Value'], bins=20, kde=True, color='blue', alpha=0.7)
plt.axvline(threshold, color='red', linestyle='dashed', linewidth=2, label=f'Threshold = {threshold}')
plt.title("Distribution of Values with Threshold")
plt.xlabel("Value")
plt.ylabel("Count")
plt.legend()
plt.show()
counts = pd.DataFrame({
    'Category': [f'Below {threshold}', f'Above {threshold}'],
    'Count': [sum(data['Value'] < threshold), sum(data['Value'] >= threshold)]
})
plt.figure(figsize=(8,5))
sns.barplot(x='Category', y='Count', data=counts, palette='coolwarm')
plt.title("Comparison of Value Counts")
plt.xlabel("Category")
plt.ylabel("Number of Values")
plt.show()
메타데이터
- post_id
- 1956cd8a7ee0
- slug
- count-cells-less-than-specific-values-in-python-a-complete-guide-with-simulated-data-and-code-1956cd8a7ee0
- url
- https://medium.com/analytics-mastery/count-cells-less-than-specific-values-in-python-a-complete-guide-with-simulated-data-and-code-1956cd8a7ee0
- canonical_url
- https://medium.com/analytics-mastery/count-cells-less-than-specific-values-in-python-a-complete-guide-with-simulated-data-and-code-1956cd8a7ee0
- author_url
- https://medium.com/@HalderNilimesh
- status
- ok
- fetched_at
- 2026-08-17 22:54:14