The Skill I’m Betting On: Graph Databases in the Siemens–Altair Era.
I want to explain why I am learning this now. Siemens recently acquired Altair. With it Altair Graph Studio, which is an enterprise…
The Skill I’m Betting On: Graph Databases in the Siemens–Altair Era.
I want to explain why I am learning this now. Siemens recently acquired Altair. With it Altair Graph Studio, which is an enterprise knowledge graph platform. This tells me that graph technology is moving into enterprise tools and it is a skill worth getting ahead of.
But Altair Graph Studio is not broadly available yet so I found the best thing, which is GraphDB. GraphDB is a tool that is built on the exact same open standards, including RDF and SPARQL.
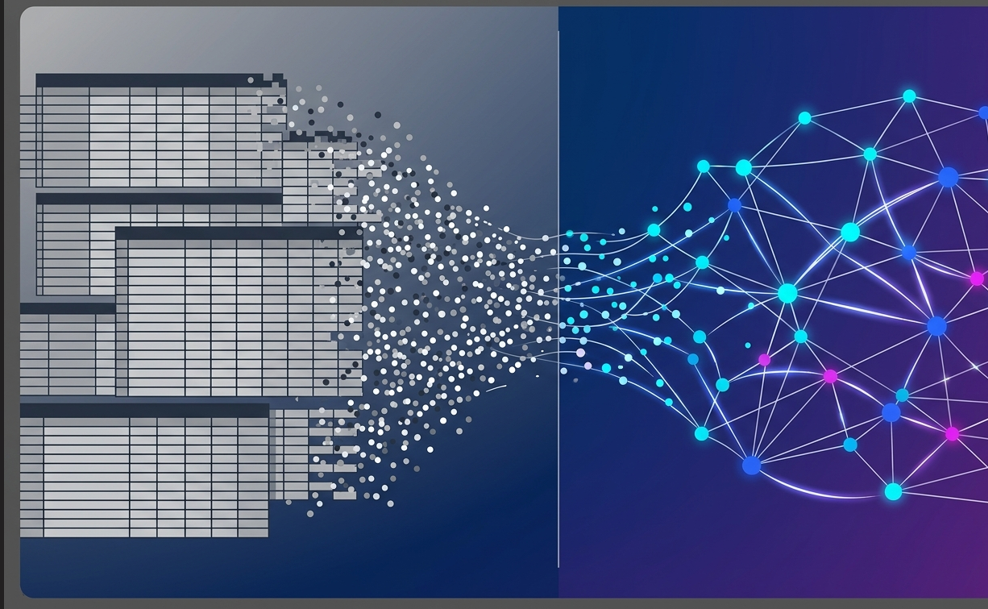
Illustration of a knowledge graph
Everything I learn in GraphDB transfers directly to Altair Graph Studio. Here is everything I have learned about graph technology far explained in the way I wish someone had explained it to me about graph technology.
If you are a free member, read this article** here.**
If you’ve been doing SQL all your life, here’s a question that might hit a little close to home: how would you write a query to find “people who work at a company located in the same city they live in”?
You’ve got this. But you can already feel the JOINs stacking up. Now say the question goes one hop deeper — “…and whose manager also lives in that city”. And another bounce. Every hop is another JOIN, another pain.
This is just the sort of question for which graph databases were invented. In this post, I’ll explain what they are, how they store data and how to query them. Using GraphDB, a popular free option. This applies to other RDF-based tools such as Altair Graph Studio as well, as they all share the same open standards.
No prior knowledge required. Let’s go.
The core idea: store facts, not rows
A relational database thinks in tables. A graph database thinks the way your brain does — in connections:
Ravi works at Infosys. Infosys is located in Pune. Pune is in Maharashtra.
Each of those facts has exactly three parts:
subject  →  predicate  →  object
Ravi     →  works at   →  Infosys
This three-part fact is called a triple and it is the entire storage model. No tables. No columns. No schemas to migrate. A graph database is basically millions of triples connected to each other — that’s why these databases are also called triplestores.
Notice something neat: the object of one triple can be the subject of another. That’s how facts chain into a graph:
Ravi → worksAt → Infosys → locatedIn → Pune → inState → MaharashtraYour data stops being rows you have to stitch together and becomes a network you can walk.
A five-minute vocabulary
You only need a handful of terms to read any tutorial on this topic:
A node is an entity in the graph: Ravi, Infosys, Pune
An edge (also known as a predicate or property) is the relationship between two nodes: works at
An RDF (Resource Description Framework) is the W3C standard for “stating things in triple form;” it’s a way of making your data portable between different graph databases.
An IRI (Internationalized Resource Identifier, pronounced “eye-are-eye”) is a Web-friendly way to identify things, and looks like a URL, but is an identifier, not a pointer: things like http://example.com/Ravi
SPARQL (pronounced “spark” query language) is used for querying graph databases, a bit like SQL
Repository is basically what we call a database in GraphDB
That’s it. You can now speak graph.
Writing your first data
RDF data is usually written in a human-friendly text format called Turtle (.ttl files). Here's a complete, working dataset:
@prefix : <http://example.com/> .

:Ravi    :worksAt   :Infosys ;
         :livesIn   :Pune ;
         :age       28 .
:Priya   :worksAt   :TCS ;
         :livesIn   :Mumbai ;
         :age       32 .
:Amit    :worksAt   :Infosys ;
         :livesIn   :Pune ;
         :age       25 .
:Infosys :locatedIn :Pune .
:TCS     :locatedIn :Mumbai .
Reading Turtle takes about thirty seconds to learn. The @prefix line is a shortcut so you can write :Ravi instead of the full IRI. The semicolon means "same subject, next fact" — so Ravi's block is three triples. The dot ends a block.
To try it yourself: download GraphDB Free, open its web interface (the Workbench) at localhost:7200, create a repository, and upload this file through the Import screen. Done — you have a knowledge graph.
(Turtle isn’t the only format, by the way. The same triples can be written as RDF/XML, JSON-LD, or N-Triples — like the same song saved as MP3 or WAV. The format is just clothing; the triples are the song.)
Querying: where graphs start to shine
SPARQL works by pattern matching. You write a triple with some parts replaced by variables (anything starting with ?), and the database fills in the blanks.
Who works at Infosys?
PREFIX : <http://example.com/>

SELECT ?person WHERE {
  ?person :worksAt :Infosys .
}
Result: Ravi and Amit. That’s the whole query. Now the fun part — remember the question from the intro? Here it is in SPARQL:
PREFIX : <http://example.com/>

SELECT ?person ?city WHERE {
  ?person  :worksAt   ?company .
  ?company :locatedIn ?city .
  ?person  :livesIn   ?city .
}
Read it out loud: find a person who works at some company, that company is located in some city, and the person lives in that same city. The shared variables (?company, ?city) connect the patterns — you're literally describing a walk through the graph. No JOINs, no foreign keys, no bridge tables. Adding another hop is just adding another line.
Filtering feels familiar:
SELECT ?person ?age WHERE {
  ?person :age ?age .
  FILTER(?age < 30)
}
And inserting data is a query too:
INSERT DATA {
  :Sneha :worksAt :Infosys ;
         :livesIn :Pune .
}
The plot twist: no schema required
Here’s where SQL developers start to get a little confused. In a relational database, the schema is defined first, and that’s where the tables and inserts come from.
RDF takes a different approach, it’s schema-less. The dataset we created above doesn’t have a schema, and that’s okay.
But we can define one if we want to, and in graph-speak, this is called an ontology. An ontology defines classes (similar to types) and relationships. Special instances of these classes (like Ravi) are called individuals.
If you’re familiar with object oriented programming, think classes and objects.
What’s special about an ontology is that it’s just more triples, stored in the same place as your data:
:Ravi     a :Person .

:Employee rdfs:subClassOf :Person .    # every Employee is a Person
:worksAt  rdfs:domain :Person ;        # only Persons work places
          rdfs:range  :Company .       # and they work at Companies               # "a" means "is of type"
The superpower: the database that thinks
That subClassOf line unlocks the feature that made me sit up the first time I saw it: inference.
Tell GraphDB only this: :Sneha a :Employee. Then query for all Persons. Sneha appears in the results — even though you never said Sneha is a Person. The database applied the rule "every Employee is a Person" and derived the fact on its own.
It works retroactively, too. Load a million triples today, add an ontology rule next month, and the database re-derives conclusions across all your existing data. Try doing that with a SQL migration.
This is why these systems are called knowledge graphs rather than just databases: they don’t only store what you told them — they know what your facts imply.
“But my data is in XML/CSV/JSON…”
One minor caveat: graph databases only ingest triples. So your regular vanilla employees.xml or CSV dumps need to be converted, via some mapping process, into RDF.
That can be done with a visual tool like Ontotext Refine or a ten line Python script using rdflib. That mapping process is actually the part where you apply design thinking to your graph, analogous to designing a relational schema
When should you reach for this?
Graph databases are not a relational databases replacement. They are an alternative to model a different set of problems. You want to use a graph database when you need to ask questions about relationships: recommendations (“who is connected to whom”), fraudulent transactions detection (“did this transaction originate from a ring of related accounts”), organization charts, or to consolidate information from various sources where the relationships matter. If your data is mostly tabular and your queries mostly consist of simple joins, then SQL is a better choice.
Try it yourself
The whole process takes fifteen minutes: install GraphDB Free or, even easier, use the free GraphDB Sandbox (a cloud instance managed by Ontotext) and load the provided Turtle file from this very post. Execute a few queries; change one little thing and try to guess the result beforehand — and you will realize in which way this database is truly revolutionary.
The moment you decide to ask a question you have never asked before and the database answers you nonetheless is going to be a moment of revelation.
👉 Be sure to clap and follow me👏
Happy graphing.
메타데이터
- post_id
- 1a2a1de65552
- slug
- the-skill-im-betting-on-graph-databases-in-the-siemens-altair-era-1a2a1de65552
- url
- https://medium.com/@shubhampatil02/the-skill-im-betting-on-graph-databases-in-the-siemens-altair-era-1a2a1de65552
- canonical_url
- https://medium.com/@shubhampatil02/the-skill-im-betting-on-graph-databases-in-the-siemens-altair-era-1a2a1de65552
- author_url
- https://medium.com/@shubhampatil02
- status
- ok
- fetched_at
- 2026-08-02 19:17:18



