Let’s talk to data. Quite literally!!!
Title: NL4DV: A Groundbreaking Toolkit Bridging Natural Language Processing and Data Visualization
Let’s talk to data. Quite literally!!!
Title: NL4DV: A Groundbreaking Toolkit Bridging Natural Language Processing and Data Visualization
In the contemporary digital era, the seamless integration of natural language interfaces (NLIs) with data visualization systems stands as a pivotal advancement, promising to redefine the way we interact with data. The paper titled “NL4DV: A Toolkit for Generating Analytic Specifications for Data Visualization from Natural Language Queries” by Arpit Narechania, Arjun Srinivasan, and John Stasko, published in the “IEEE Transactions on Visualization and Computer Graphics” in February 2021, introduces a revolutionary toolkit that aims to facilitate this integration, making the development of visualization NLIs more accessible and efficient, especially for developers without a background in natural language processing (NLP).
What is NLI?
NLI, or Natural Language Inference, is a subfield of natural language processing (NLP) that focuses on determining whether a given hypothesis is true, false, or undetermined based on a given premise. In other words, it is the task of inferring the relationship between a pair of sentences or texts. The possible relationships are generally categorized as:
- Entailment: The hypothesis is logically implied or entailed by the premise. If the premise is true, the hypothesis must also be true.
- Contradiction: The hypothesis contradicts the premise. If the premise is true, the hypothesis must be false.
- Neutral: The truth value of the hypothesis is independent of the premise. It neither contradicts nor is entailed by the premise.
NL4DV
The NL4DV toolkit emerges as a beacon of simplicity in this complex landscape, offering a high-level API (Application Programming Interface) that translates natural language queries into visualization specifications. This toolkit not only aids in the creation of new visualization NLIs but also assists in incorporating natural language functionalities into existing systems, thereby expanding their capabilities and user-friendliness.
The inception of NL4DV is rooted in the recognition of the intricate process involved in developing visualization NLIs. The toolkit serves as a bridge, connecting the realms of natural language processing and data visualization, and facilitating a smoother transition from natural language queries to actionable visualization insights. By processing natural language queries about a dataset, it infers the underlying data attributes and analytic tasks, subsequently suggesting relevant Vega-Lite visualizations that can be utilized to represent the data effectively.
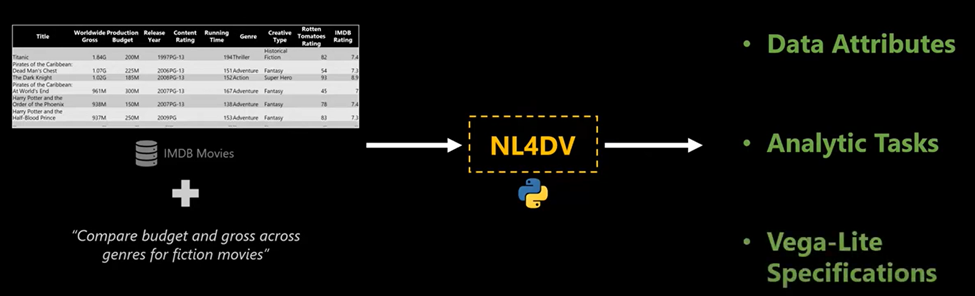
Transition of data
Vega-Lite
Vega-Lite is a high-level visualization grammar that provides a concise JSON syntax for rapidly creating a wide range of statistical graphics. Vega-Lite simplifies the process of visualization by automatically handling the more complex aspects of visualization design, such as data transformation and scale adjustment. Developers and data scientists can use Vega-Lite to quickly create visualizations without sacrificing the ability to create complex and interactive graphics. It integrates well with other web technologies and can be embedded into web pages. Its high-level abstraction allows for the rapid creation of common chart types, while also offering the flexibility to customize and extend charts with a variety of mark types, encodings, and interactive components.
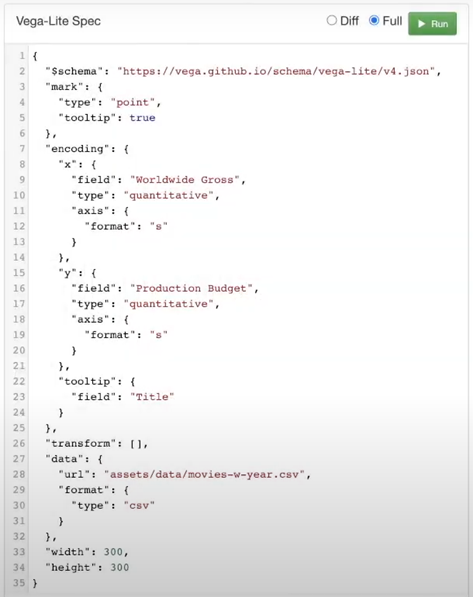
JSON syntax created for the query
NL4DV: How does it work?
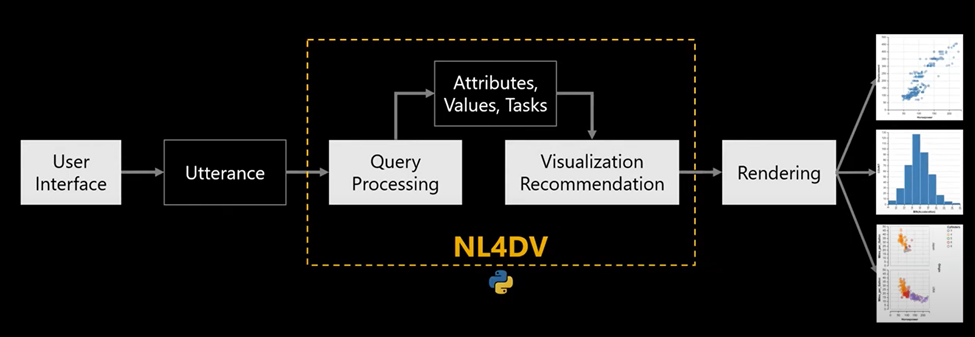
NL4DV distinguishes itself by serving as a high-level API in the pipeline of implementing NLIs for data visualization. It processes natural language queries to infer relevant information, such as data attributes and analytic tasks and generates a list of Vega-Lite specifications related to the input query. This information can be harnessed by developers to create new visualization NLIs or integrate natural language querying capabilities into existing systems, thereby enhancing their functionality and user experience.
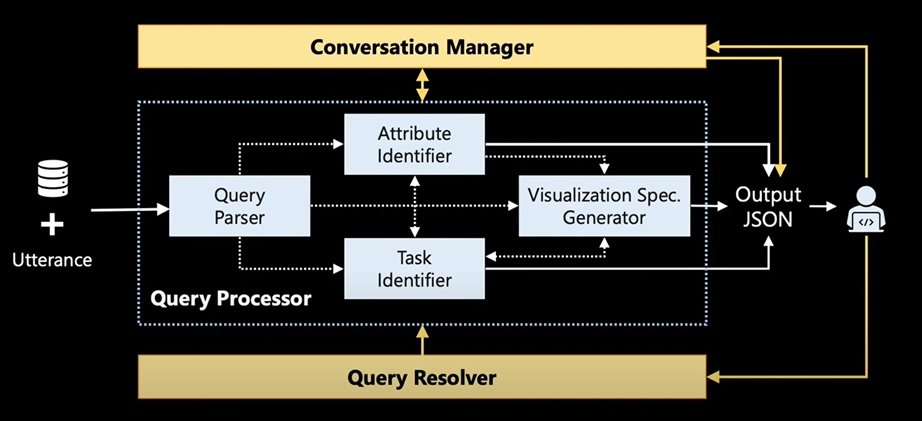
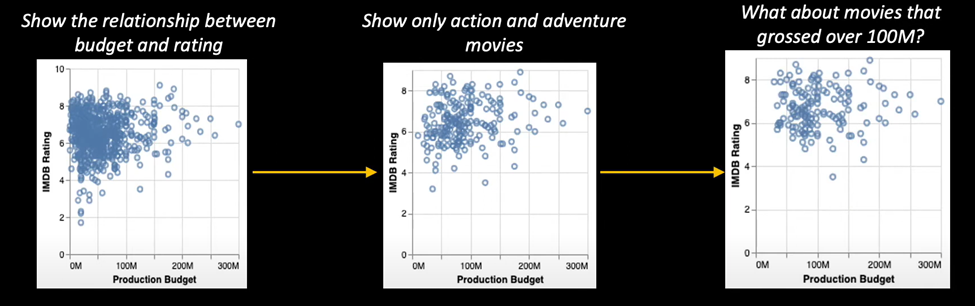
The above diagram explains how the process works. Given tabular data and a natural language query it can automatically identify what are the attributes and figure out the task it needs to do while also generating a list of Vega lite specifications relevant to the query. These make up the query processor. If a user wants to accomplish a complex task, then the length of the query has to be longer. To reduce this problem and facilitate a conversation-like mechanism in NL4DV, a conversation manager is introduced that allows users to ask for follow-ups on already generated queries. It can also be used to determine if a query is a follow-up or not. A query resolver is also added for the user to clarify any ambiguity in a query. The following diagram shows how one complex query is therefore broken down into three simpler queries.
The toolkit leverages existing NLP toolkits like NLTK, Stanford CoreNLP, and spaCy, encapsulating the underlying NLP implementation details and allowing developers to focus more on the user interface and interactions. This encapsulation ensures that developers can concentrate on enhancing the user experience, without getting bogged down by the intricacies of NLP implementations.
The Significance of JSON Output
A noteworthy feature of the NL4DV toolkit is its generation of a JSON object as the output, containing analytic specifications derived from the natural language queries. The choice of JSON, a lightweight and human-readable data format, facilitates easy parsing and integration with JavaScript-based data visualization libraries, including Vega-Lite. This choice embodies the toolkit’s commitment to simplifying the development process, offering a structured and standardized format that can be easily manipulated and utilized by developers to create interactive and dynamic data visualizations.
Plot of Correlate budget vs. Gross

Here is an example of how it works. A query is raised which gets converted into a NL4DV query, which then maps to the related field. In the above diagram, the query is to correlate budget and gross, the NL4DV processes this and breaks it down into bits it can process such as what are the variables and what is the task at hand. Here, it understands that it has to make a correlation plot between the Worldwide Gross and Production budget. Notice how even when the variable names are not exactly stated NL4DV has the capacity to extrapolate the meaning and provide us with the accurate graph needed.
Let’s talk to the data- Integration with mmplot, TouchPlot, and NL4DV
In the evolving field of data visualization, the integration of mmplot, TouchPlot, and NL4DV stands as a beacon of technological synergy, pushing the boundaries of data interaction and visualization.
mmplot acts as a multi-modal platform, enhancing data analysis by harmonizing the strengths of TouchPlot and NL4DV, thereby fostering a multi-faceted data engagement experience.
TouchPlot specializes in touch-based interactions, offering a tactile and direct approach to data visualization. Its collaboration with mmplot marks a stride towards user-friendly platforms where touch interactions complement natural language queries.
NL4DV, a pivotal component in this integration, translates natural language queries into visualization specifications, serving as the backbone of this cohesive system. It ensures a smooth transition from natural language queries to interactive visualizations, paving the way for a dynamic data analysis journey.
Together, these tools herald a new age in data visualization, where interaction transcends traditional methods to include natural language and touch-based engagements. This innovative collaboration promises a future where data visualization is not merely a tool but a vibrant platform for immersive data exploration and analysis.

Conclusion
In conclusion, the NL4DV toolkit stands as a groundbreaking development in the field of data visualization, promising to revolutionize the way we interact with data. By facilitating the integration of natural language functionalities into visualization systems, it opens new avenues for user interaction and data exploration. The toolkit serves as a beacon of innovation, offering a glimpse into the future of data visualization, where natural language queries can be seamlessly translated into insightful visual representations, fostering a more intuitive and user-friendly data interaction experience.
The open-source nature of the NL4DV toolkit, available at its [GitHub page] (https://nl4dv.github.io/nl4dv/), further amplifies its potential impact, inviting collaboration and contributions from the global developer community. As we stand on the cusp of a new era in data visualization, the NL4DV toolkit emerges as a vital tool, promising to guide us into a future where data visualization is more accessible, intuitive, and interactive.
Citations and credits — Rishab Mitra, Arpit Narechania, Arjun Srinivasan, and John Stasko. For the paper and their work amazing work that they have done in this field.
메타데이터
- post_id
- 1bc5d1df4e1c
- slug
- lets-talk-to-data-quite-literally-1bc5d1df4e1c
- url
- https://medium.com/@sameerhussain_2462/lets-talk-to-data-quite-literally-1bc5d1df4e1c
- canonical_url
- https://medium.com/@sameerhussain_2462/lets-talk-to-data-quite-literally-1bc5d1df4e1c
- author_url
- https://medium.com/@sameerhussain_2462
- status
- ok
- fetched_at
- 2026-06-12 18:14:10




