Mastering the Three Pillars of Observability in K8s: Metrics, Logs, and Traces with the Grafana…
Monitoring and observability tools are very important in any IT system. Monitoring tells you when something is wrong. Observability tells…
Mastering the Three Pillars of Observability in K8s: Metrics, Logs, and Traces with the Grafana Stack
Monitoring and observability tools are very important in any IT system. Monitoring tells you when something is wrong. Observability tells you why. It’s the difference between knowing your application is on fire and understanding which exact line of code handed the match to the kindling.
As systems grow in complexity, monitoring alone stops being enough. You need observability. The Three Pillars of Observability: Observability is typically built around three types of telemetry data, each answering a different kind of question:
- Metrics — numerical measurements over time. “How much CPU is this service consuming? How many requests per second is it handling? What’s the error rate?”
- Logs — timestamped records of discrete events. “What exactly happened at 14:32:07? Which user triggered this error? What was the full stack trace?”
- Traces — end-to-end records of a request’s journey across services. “Which service in the chain caused this slowdown? Where did this request spend most of its time?”

(Source: https://grafana.com/docs/tempo/latest/introduction/telemetry/)
No single pillar gives you the full picture. The real power comes when you can correlate all three: findings from a metric spike, to the logs that fired at the same time, to the trace that shows exactly which service was the culprit.
This post is a continuation of my previous article that explains how to build observability: integration for OTel and Loki. In this post, I’ll go into even more advanced topics to integrate Grafana Mimir and Tempo into the stacks built on five battle-tested open-source tools:
- Prometheus — collects and stores metrics from your services. Think of it as a time-series database that regularly polls your applications and asks, “how are you doing right now?”
- OpenTelemetry (OTel) — a standardized framework for instrumenting your code and shipping telemetry data (metrics, logs, and traces) to any backend. It’s the universal adapter layer — instrument once, send anywhere.
- Grafana Mimir — a scalable long-term storage backend for metrics. When Prometheus’s local storage isn’t enough — because you need months of retention or you’re running at large scale — Mimir takes over, storing data cheaply in object storage like S3.
- Grafana Loki — a log aggregation system built for efficiency. Rather than indexing every word in every log line (which gets expensive fast), Loki indexes only the metadata labels attached to your log streams, keeping costs low while keeping queries fast.
- Grafana Tempo — a distributed tracing backend that stores and retrieves traces without maintaining a heavy index. It sits on top of cheap object storage, accepts trace data from OTel, and lets you look up any trace instantly by its ID.
- Grafana — the visualization and alerting frontend that ties everything together. It connects to all the backends above, letting you build dashboards, write queries, correlate signals across pillars, and manage alerts — all in one place.
Before beginning to explain the implementation method, I will explain about the tech stack flow that we will build

Tech Stack flow for Observability Lab
How above Tech Observability Stack FlowWork (From App to Dashboard)?
Think of this diagram as a data pipeline — telemetry data (metrics, logs, and traces) is born in your applications, travels through several processing stages, gets stored safely, and finally becomes something you can see and act on in Grafana. Let's walk through it layer by layer.
Layer 1 — The Applications (Top) This is where everything starts. You have App 1 and App 2 — these are your actual running services, whether they’re APIs, web servers, background workers, or anything else. Each app is instrumented to emit telemetry data using two methods:
- OTLP (OpenTelemetry Protocol) — the standard format for sending traces, metrics, and logs from your app code.
- HostMetrics — system-level data automatically collected from the underlying host, like CPU usage, memory, disk I/O, and network traffic.
Layer 2 — The OTel Collector (Ingestion Gateway) All that raw telemetry flows into the OpenTelemetry Collector, which acts as the central hub of the entire pipeline. It has two jobs:
- OTLP Receiver — listens and accepts incoming telemetry data from your apps.
- Processors — cleans, transforms, filters, and enriches the data before forwarding it. For example, it might add environment labels, drop noisy data, or batch events for efficiency.
After processing, the Collector splits the data into three separate lanes based on type:
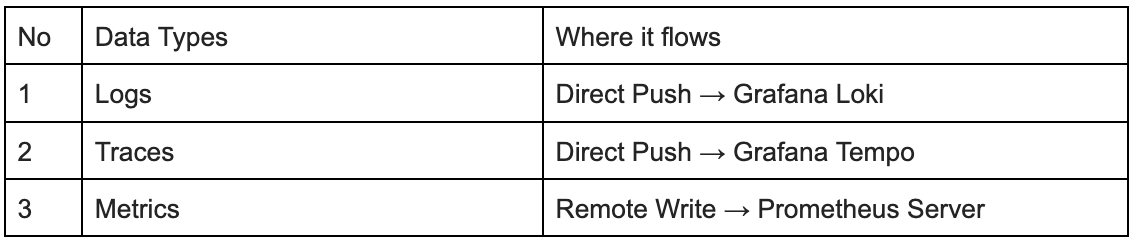
Table Data Types and flows
Layer 3 — Prometheus (Aggregation & Buffering) Metrics don’t go straight to long-term storage — they first pass through Prometheus, which serves as a short-term buffer and local aggregation layer. Prometheus does two things here:
- Local Scraping — it can also pull metrics directly from services that expose a /metrics endpoint (the traditional Prometheus way).
- Alerting — it evaluates alert rules in real time. If your error rate crosses a threshold, Prometheus fires the alert before the data is archived.
Once Prometheus has done its job, it forwards (Remote Writes) the metrics to Grafana Mimir for long-term storage.
Layer 4 — Long-Term Storage (S3-Backed) This is where all three telemetry types land for durable, scalable, long-term storage. All three backends store data in object storage (like AWS S3 or similar), which is cheap and reliable:
- Grafana Loki — stores your logs, indexed by labels (not full text) for cost efficiency.
- Grafana Tempo — stores your traces, retrievable by Trace ID without a heavy index.
- Grafana Mimir — stores your metrics, with full PromQL compatibility and multi-month retention.
Layer 5 — Grafana (Visualization) Finally, Grafana sits at the bottom as the single pane of glass for everything. It queries all three backends simultaneously:
- Loki for logs → using LogQL
- Tempo for traces → using TraceQL
- Mimir for metrics → using PromQL
- Prometheus directly for real-time metrics and alert state
This is where you build dashboards, investigate incidents, and correlate signals. The real power here is being able to jump between all three pillars in one place — spot a metric spike, click through to the related logs, then pull up the trace that shows exactly which service caused the problem.
The Full Flow in One Sentence
Apps emit telemetry → OTel Collector receives, processes, and routes it → Prometheus buffers and alerts on metrics → Loki, Tempo, and Mimir store logs, traces, and metrics long-term → Grafana queries all of them and shows you everything in one place.
The Implementation
Prerequisites — What You Need Before We Begin
Before we start deploying anything, let’s make sure your environment is properly set up. This section covers everything you need to have installed, configured, and understood before following along with the hands-on labs:
- Kubernetes cluster
- Kubectl and helm installed on the bastion or server that has access to kubernetes cluster
- S3 bucket (used to store data logs, metrics, etc)
To download the file provided in this article, you may git clone from this repository Grafana-stack. This lab is intended to be used for a non-production environment, since we will disable several configurations due to limited resources in this environment
Step-1: install otel Start by applying this otel-server.YAML file to a Kubernetes cluster. We will use this command:
helm repo add open-telemetry https://open-telemetry.github.io/opentelemetry-helm-charts
helm repo update

#create namespace for monitoring stacks
Kubectl create ns monitoring

#apply yaml file
helm install otel-collector open-telemetry/opentelemetry-collector \
-f otel-server-nonprod.yaml \
--namespace monitoring
Otel Collector is running
We will provision Otel in daemonset mode (each Kubernetes worker will have one Otel pod). There are several important configurations from the Otel YAML file as follows:
# OpenTelemetry Collector Configuration
config:
 receivers:
   # OTLP receiver for traces, metrics, and logs
   otlp:
     protocols:
       grpc:
         endpoint: 0.0.0.0:4317
       http:
         endpoint: 0.0.0.0:4318

   # Prometheus receiver to scrape metrics
   prometheus:
     config:
       scrape_configs:
         - job_name: 'otel-collector'
           scrape_interval: 30s
           static_configs:
             - targets: ['localhost:8888']

         # Kubernetes service discovery
         - job_name: 'kubernetes-pods'
           scrape_interval: 30s
           kubernetes_sd_configs:
             - role: pod
           relabel_configs:
             - source_labels: [__meta_kubernetes_pod_annotation_prometheus_io_scrape]
               action: keep
               regex: true
             - source_labels: [__meta_kubernetes_pod_annotation_prometheus_io_path]
               action: replace
               target_label: __metrics_path__
               regex: (.+)
             - source_labels: [__address__, __meta_kubernetes_pod_annotation_prometheus_io_port]
               action: replace
               regex: ([^:]+)(?::\d+)?;(\d+)
               replacement: $1:$2
               target_label: __address__

   # Filelog receiver to tail all pod logs from the node
   filelog:
     include:
       - /var/log/pods/*/*/*.log
     exclude:
       # Exclude collector logs to avoid loop
       - /var/log/pods/monitoring_otel-collector-*/*/*.log
     start_at: end
     include_file_path: true
     include_file_name: false
     operators:
       # Extract metadata from the path
       - type: regex_parser
         regex: '^/var/log/pods/(?P<namespace>[^_]+)_(?P<pod_name>[^_]+)_(?P<uid>[a-z0-9-]+)/(?P<container_name>[^_]+)/.+$'
         parse_from: attributes["log.file.path"]
       # Move extracted labels to resource attributes for Loki and k8sattributes processor
       - type: move
         from: attributes.namespace
         to: resource["k8s.namespace.name"]
       - type: move
         from: attributes.pod_name
         to: resource["k8s.pod.name"]
       - type: move
         from: attributes.uid
         to: resource["k8s.pod.uid"]
       - type: move
         from: attributes.container_name
         to: resource["k8s.container.name"]
       # Parse container logs (JSON for containerd/k3s)
       - type: container
         id: container-parser
       # Additional parser for service-guess CLF logs to extract labels at ingestion time
       - type: regex_parser
         id: clf-parser
         # skip Date Time prefixes if present, then capture CLF fields
         regex: '^(?:(?P<date>\d{4}-\d{2}-\d{2}) (?P<time>\d{2}:\d{2}:\d{2})\t)?(?P<ip>[^ ]+) - - \[(?P<ts>[^\]]+)\] "(?P<method>\w+) (?P<path>[^ ]+) (?P<proto>[^"]+)" (?P<status>\d+) (?P<size>[^ ]+) (?P<latency>\d+) "(?P<msg>[^"]+)" \[TraceID: (?P<tid>[^\]]+)\]$'
         parse_from: body
         # Apply to all services in the apps namespace following the standardized CLF format
         if: 'resource["k8s.namespace.name"] == "apps"'

   # Host metrics receiver
   hostmetrics:
     collection_interval: 30s
     scrapers:
       cpu:
       disk:
       filesystem:
       load:
       memory:
       network:
       paging:

 processors:
   # Batch processor for better performance
   batch:
     timeout: 10s
     send_batch_size: 1024

   # Memory limiter to prevent OOM
   memory_limiter:
     check_interval: 5s
     limit_mib: 400
     spike_limit_mib: 100

   # Resource detection for Kubernetes
   resourcedetection:
     detectors: [env, system]
     timeout: 5s

   # Enrich logs/metrics with Kubernetes metadata
   k8sattributes:
     auth_type: "serviceAccount"
     passthrough: false
     filter:
       node_from_env_var: KUBE_NODE_NAME
     extract:
       metadata:
         - k8s.pod.name
         - k8s.pod.uid
         - k8s.namespace.name
         - k8s.node.name
         - k8s.container.name
       labels:
         - tag_name: app
           key: app
     pod_association:
       - sources:
           - from: resource_attribute
             name: k8s.pod.name
           - from: resource_attribute
             name: k8s.namespace.name
       - sources:
           - from: resource_attribute
             name: k8s.pod.ip
       - sources:
           - from: resource_attribute
             name: k8s.pod.uid
       - sources:
           - from: connection

   # Resource processor to create user-friendly labels for Loki
   resource:
     attributes:
       - key: namespace
         from_attribute: k8s.namespace.name
         action: insert
       - key: pod
         from_attribute: k8s.pod.name
         action: insert
       - key: container
         from_attribute: k8s.container.name
         action: insert
       # Promote extracted CLF fields to indexed labels
       - key: status
         from_attribute: status
         action: insert
       - key: method
         from_attribute: method
         action: insert
       - key: path
         from_attribute: path
         action: insert

   # Attributes processor for adding metadata
   attributes:
     actions:
       - key: environment
         value: non-production
         action: insert
 exporters:
   # Prometheus exporter for metrics
   prometheus:
     endpoint: "0.0.0.0:8889"
     namespace: otel
     const_labels:
       environment: nonprod

   # Prometheus Remote Write (if using Prometheus server)
   prometheusremotewrite:
     endpoint: http://prometheus-server.monitoring.svc.cluster.local/api/v1/write
     tls:
       insecure: true
     # Use the specific queue for this exporter
     remote_write_queue:
       enabled: true
       queue_size: 10000  # Increase this for cross-region
       num_consumers: 5
     retry_on_failure:
       enabled: true
       initial_interval: 5s
       max_elapsed_time: 300s

   # Debug exporter for monitoring data flow (replaces deprecated logging exporter)
   debug:
     verbosity: normal
     sampling_initial: 5
     sampling_thereafter: 200

   # Loki exporter for logs
   otlphttp/loki:
     endpoint: http://loki-gateway.monitoring.svc.cluster.local/otlp
     tls:
       insecure: true
     # Optimization for cross-region or network latency
     sending_queue:
       enabled: true
       queue_size: 5000
     retry_on_failure:
       enabled: true
       initial_interval: 5s
       max_elapsed_time: 300s

   # Tempo exporter for traces
   otlp/tempo:
     endpoint: tempo-server.monitoring.svc.cluster.local:4317
     tls:
       insecure: true

 service:
   pipelines:
     # Traces pipeline
     traces:
       receivers: [otlp]
       processors: [memory_limiter, resourcedetection, attributes, batch]
       exporters: [otlp/tempo, debug]

     # Metrics pipeline
     metrics:
       receivers: [otlp, prometheus, hostmetrics]
       processors: [memory_limiter, resourcedetection, attributes, batch]
       exporters: [prometheus, prometheusremotewrite, debug]

     # Logs pipeline
     logs:
       receivers: [otlp, filelog]
       processors: [memory_limiter, k8sattributes, resource, resourcedetection, attributes, batch]
       exporters: [otlphttp/loki, debug]
Snippet of yaml file above explain about the core functionality config of Otel:
- The first config, receivers: the tools the collector uses to get data. otlp: Listens for data that your “modern” apps send voluntarily. Prometheus: This is the “Collector Bot.” It goes out every 30 seconds, finds all your apps, and “harvests” their numbers (like CPU or request counts). filelog: This is a “File Reader.” It looks at the actual log files saved on the server’s hard drive and reads them line by line. Hostmetrics: This measures the “Vitals” of the server itself for example it show how much RAM is left, how hard the disks are working, etc.
- The second config, Processors: The Sorting Factory. The processors act as the sorting factory where data is cleaned and organized before storage. To ensure high efficiency, the batch processor groups data into “boxes” rather than sending individual lines, reducing overhead. For system stability, the memory_limiter serves as a safety guard, dropping data if RAM usage spikes to prevent a full server crash. Meanwhile, the k8sattributes processor functions as a label maker, tagging data with metadata like app names or namespaces, while the resource processor acts as a translator to rename labels into a consistent format that Grafana prefers.
- The third config, Exporters: The Delivery Trucks. Once the data is refined, exporters act as delivery trucks that transport it to its long-term destination. The prometheusremotewrite exporter handles the delivery of numerical metrics to the Mimir server, while otlphttp/loki and otlp/tempo deliver logs and application traces to Loki and Tempo, respectively. Additionally, the debug exporter prints data directly to the terminal, allowing you to verify that the pipeline is working correctly before it reaches storage.
- The last config, Service Pipelines: The Assembly Lines. The service pipelines represent the assembly lines that plug every component together into a cohesive workflow. This section defines three distinct tracks to manage different data types: the Traces Line labels and routes application behavior to Tempo; the Metrics Line collects and cleans numerical sensor data for Mimir; and the Logs Line reads raw files, attaches Kubernetes context, and sends them to Loki. By defining these paths, the system ensures that every piece of telemetry follows the correct processing and delivery route.
Step-2: Install Prometheus Start by applying this otel-server.YAML file to a Kubernetes cluster. We will use this command:
helm repo add prometheus-community https://prometheus-community.github.io/helm-charts
helm repo update

# apply yaml file
helm install prometheus prometheus-community/prometheus \
 -f prometheus-server-agent.yaml \
 --namespace monitoring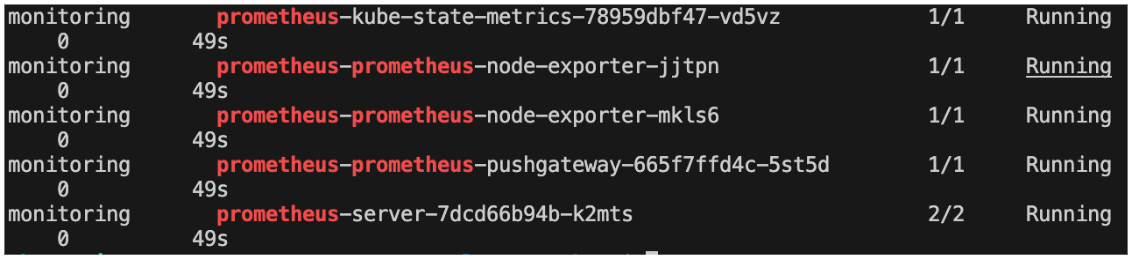
Promtheus pod is running
We will provision Prometheus in agent mode (the pod will not enable persistent data saving). This mode is a specialized, lightweight deployment mode for Prometheus optimized for service discovery, scraping, and forwarding metrics via Remote Write to a central storage system. It eliminates local storage (TSDB), alerting, and query capabilities to reduce resource usage, providing an efficient alternative for edge scenarios or long-term storage workflows. We use this mode due to mimir existence that will handling saving data mechanism to S3.
Step-3: Install Mimir Start by applying this mimir-server.YAML file to a Kubernetes cluster. We will use this command:
# apply yaml file
helm install mimir grafana/mimir-distributed \
-f mimir-server-nonprod.yaml \
 --namespace monitoring \
 --create-namespace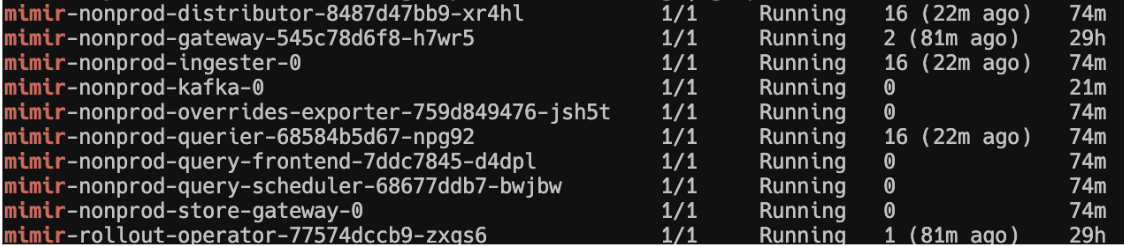
Mimir pod is running
We have provisioned mimir core components, each component is useful to keep metric data to s3 object: we will explain detail each config in mimir yaml file as follows:
1. Name Overrides
nameOverride: "mimir-nonprod"
fullnameOverride: "mimir-nonprod"
Sets the name of all Kubernetes resources to mimir-nonprod. Without this, Helm generates names with dots (e.g. mimir.nonprod) which causes DNS label warnings in Kubernetes, since dots are not valid in resource names.
2. Storage Configuration 2a. Common Storage (S3)
common:
  storage:
 backend: s3
 s3:
   endpoint: s3.amazonaws.com
   region: us-east-1
   bucket_name: <empty>
   access_key_id: <empty>
   secret_access_key: <empty>
Sets AWS S3 as the default storage backend for all Mimir components. All components (blocks, ruler, alertmanager) inherit this setting unless overridden individually.
⚠️ bucket_name, access_key_id, and secret_access_key are empty. S3 access will fail at runtime unless credentials are injected via environment variables or Kubernetes secrets.
2b. Blocks Storage
blocks_storage:
  backend: s3
  s3:
 bucket_name: test-bucket-10122225
  tsdb:
 dir: /data/mimir/tsdb
Metric blocks (actual time-series data) are stored in S3 bucket. Locally, TSDB uses /data/mimir/tsdb as a temporary write buffer before flushing to S3. The same bucket is used for Ruler and alertmanager storage — acceptable for non-prod, but in production, you should separate these into different buckets.
3. Ingest Storage (Kafka)
ingest_storage:
  enabled: true
Enables the Kafka-based ingest path. Instead of Prometheus writing metrics directly to ingesters, data flows through Kafka first: Prometheus → Distributor → Kafka → Ingester → S3
This adds a buffer layer, preventing metric loss if ingesters temporarily go down. Since this is enabled, Kafka must also be enabled in the Helm values — disabling Kafka while this is on will break the ingest path.
4. Ring / Memberlist Configuration
distributor:
  ring:
 kvstore:
   store: memberlist

ingester:
  ring:
 kvstore:
   store: memberlist
 replication_factor: 1
Memberlist is a gossip protocol — Mimir pods discover and communicate with each other automatically without needing an external key-value store like etcd or Consul. This simplifies the setup significantly.
replication_factor: 1 means metrics are written to only 1 ingester — no redundancy.
replication_factor: 1 means if the ingester crashes, recent metrics that haven’t been flushed to S3 yet will be lost. Acceptable for non-prod. In production, always use replication_factor: 3.
Step-4: Install Loki Start by applying this loki-server-nonprod.YAML file to a Kubernetes cluster. We will use this command:
# apply yaml file
helm install loki grafana/loki \
-f loki-server.yaml \
--namespace monitoring
Below is the detail explanation of each config from loki-server-nonprod.yaml
Deployment Mode deploymentMode: SingleBinary — Runs all Loki components (ingester, querier, compactor, ruler) inside a single process and a single pod. This is the simplest way to run Loki.
Storage Configuration Loki uses AWS S3 as its object storage backend. All log chunks, ruler data, and admin data are stored there.
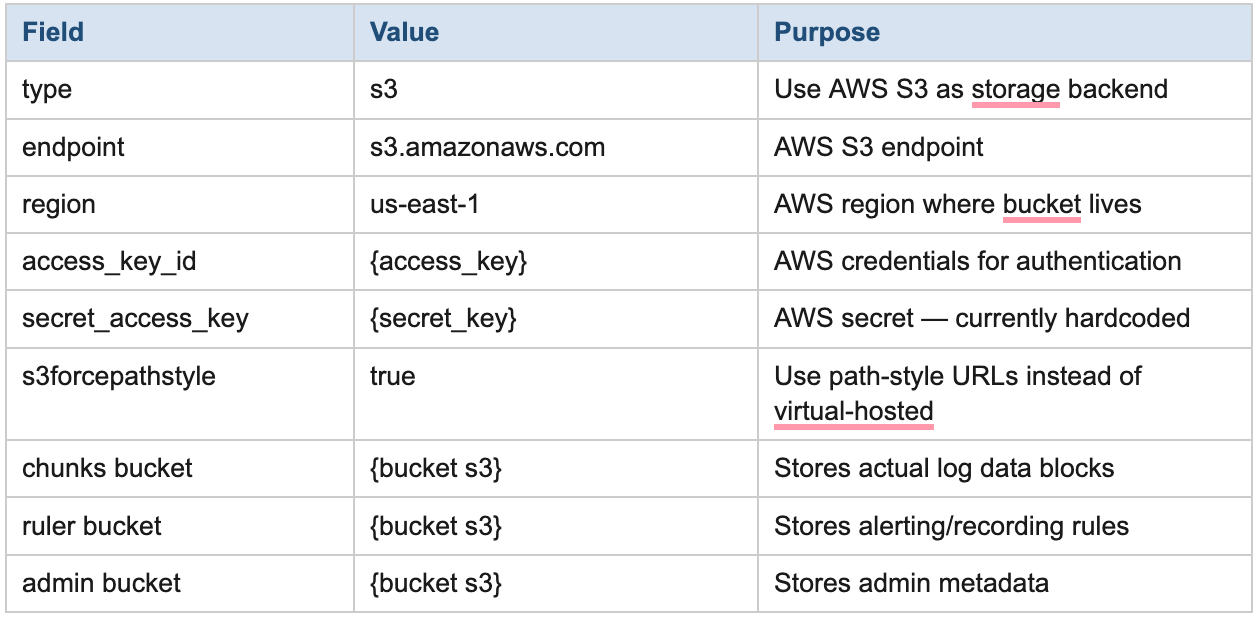
Table configuration S3
All three buckets can point to the same S3 bucket. This is fine for non-prod but in production you should separate them into dedicated buckets for clarity and access control.
Schema Configuration
from: 2024–01–01 | store: tsdb | schema: v13 | object_store: s3
Defines how Loki organizes and indexes log data:
- from: 2024–01–01 — This schema applies to all logs from January 1st 2024 onward
- store: tsdb — Uses TSDB (time-series database format) for the index. This is the modern and recommended index format
- object_store: s3 — Log chunks are stored in S3
- schema: v13 — Uses schema version 13, which is the latest stable Loki schema
- prefix: lokiindex — All index files in S3 are prefixed with lokiindex
- period: 24h — A new index table is created every 24 hours
Limits Configuration Controls how much data Loki will accept and how heavy queries can get. These are global defaults applied to all log streams.
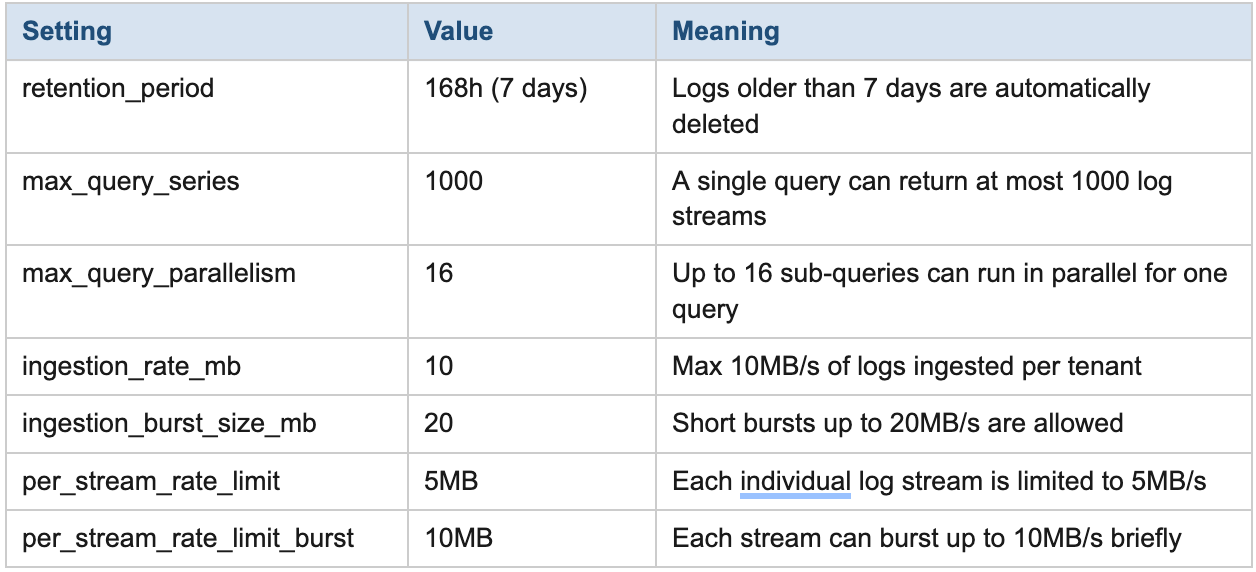
Table Configurations Limit
Retention only works when compactor.retention_enabled is set to true (which it is in this config). Without that, the retention_period setting has no effect.
Backend, Read, and Write Replicas
backend.replicas: 0 | read.replicas: 0 | write.replicas: 0
These are components used in Loki’s distributed/microservices deployment mode. Since this config uses SingleBinary mode, all these roles are handled by the single binary pod. Setting them to 0 prevents Helm from spinning up unnecessary extra pods.
Overall Summary
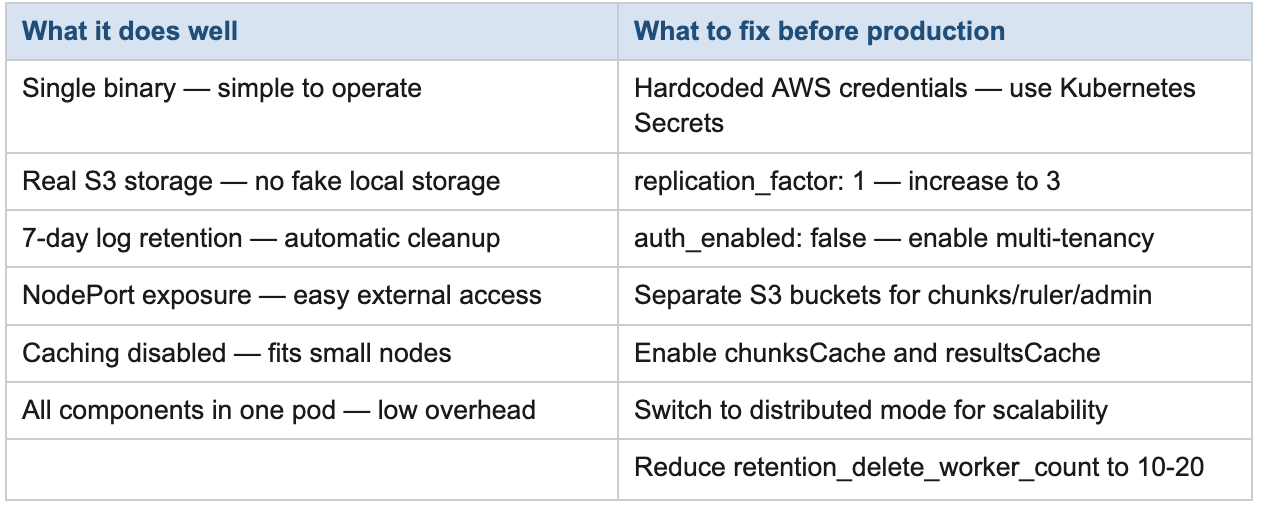
Summary configuration of loki
Step-5: Install Tempo Apply tempo-server-nonprod.yaml to provision in Kubernetes:
helm install tempo grafana/tempo \
-f tempo-server-nonprod.yaml \
--namespace monitoring
Pod Tempo is running
Below is the detail explanation of each config in tempo-server-nonprod.yaml:
Metrics Generator The Metrics Generator is the most significant addition in this config. It is a Tempo component that reads incoming traces and automatically produces Prometheus metrics from them — without you having to instrument your code separately.
Enabled and Remote Write
enabled: true
remoteWriteUrl: "http://prometheus-server.monitoring.svc.cluster.local/api/v1/write"
enabled: true Turns on the Metrics Generator component inside the Tempo pod. Without this, no metrics are produced from traces.
remoteWriteUrl The URL where generated metrics are pushed to. This points to your Prometheus server running inside the same cluster in the monitoring namespace. Tempo acts like a Prometheus remote write client. it pushes metrics directly into Prometheus at regular intervals.
Ingester Configuration max_block_duration: 5m
The ingester buffers incoming traces in memory and periodically flushes them as immutable blocks to S3. This setting controls how long a block stays open before being flushed:
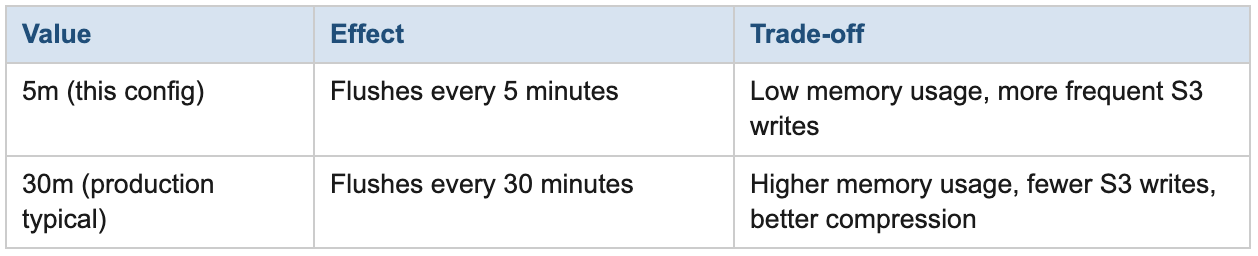
Table Ingester Config
Querier Configuration
max_concurrent_queries: 5 Limits how many trace queries (from Grafana or direct API calls) can run at the same time inside Tempo. Queries beyond this limit are queued and wait for a slot.
- 5 is appropriate for non-prod with a small number of users
- Increase to 20–50 in production depending on Grafana user count and available memory
- Each concurrent query consumes memory — keeping this low prevents OOM on small nodes
Persistence
enabled: true | size: 1Gi | storageClass: “”
Allocates a PersistentVolumeClaim for Tempo’s local storage. This is used for:
- WAL (Write-Ahead Log) — protects buffered traces from loss on pod restart
- local-blocks processor data — the local-blocks processor stores a short window of raw trace data on disk for TraceQL metric queries
Step-6: Install Grafana
This is the final installation for this stack. Start by applying grafana-server.yaml. Let’s use these commands:
# apply yaml file
helm install grafana grafana-community/grafana \
-f grafana-server.yaml \
--namespace monitoring
After that, try to open grafana ui: http://[public ip or domain]:30085/login
By default, the username and password are as follows:
- Username: admin
- Password: use this command to get the password by decoding the secret value -> kubectl get secret — namespace monitoring grafana -o jsonpath=”{.data.admin-password}” | base64 — decode ; echo
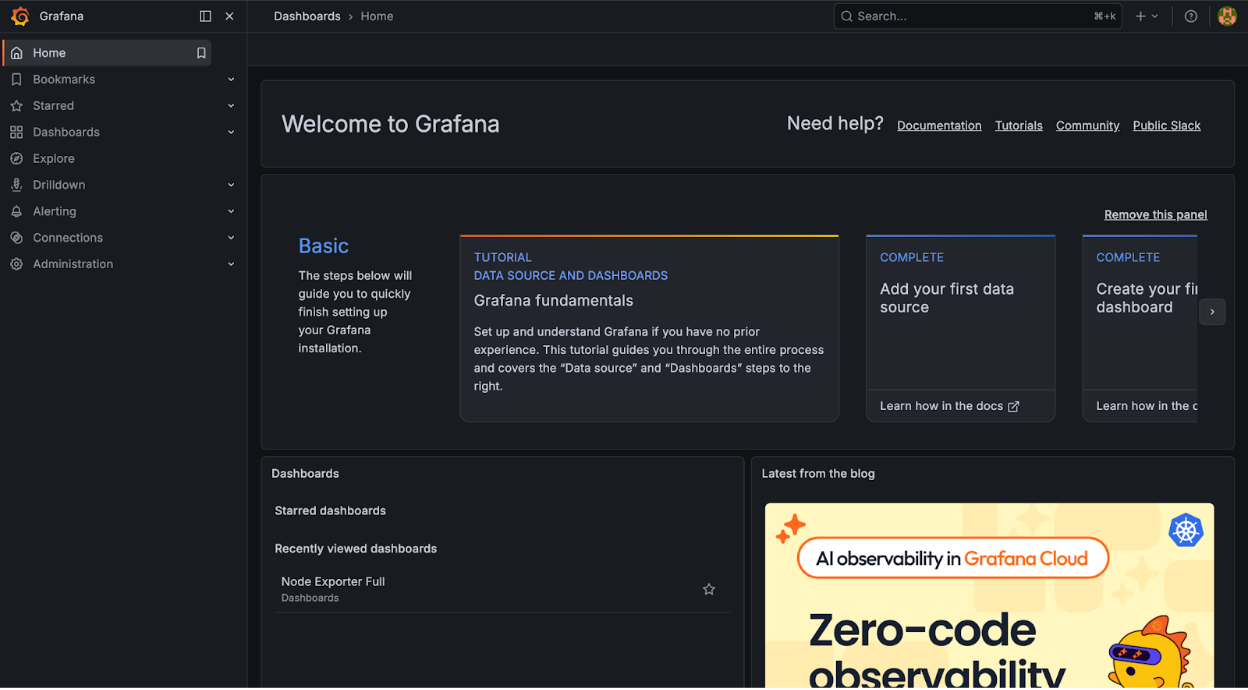
Grafana UI
Based on Grafana Server.yaml there are several highlighted configurations that we use to integrate each service in our stack:
datasources:
 datasources.yaml:
   apiVersion: 1
   datasources:
   - name: Prometheus
     type: prometheus
     url: http://prometheus-server.monitoring.svc.cluster.local
     access: proxy
     isDefault: true
   - name: Loki
     type: loki
     url: http://loki-gateway.monitoring.svc.cluster.local
     access: proxy
Since we have Prometheus and loki as datasource we will need to add these two configurations in yaml. access: proxy: This is a security and networking setting. It means that when you view a dashboard in your browser, your browser sends the request to Grafana, and then Grafana “proxies” that request to Prometheus/Loki. This is better because your Prometheus/Loki services don’t need to be exposed to the outside world; they only need to be reachable by the Grafana pod..isDefault: true: in prometheus it makes Prometheus the default choice whenever you create a new dashboard or panel.
After completing the installation of each component, continue access the grafana dashboard. By default in our manifest two dashboard is imported
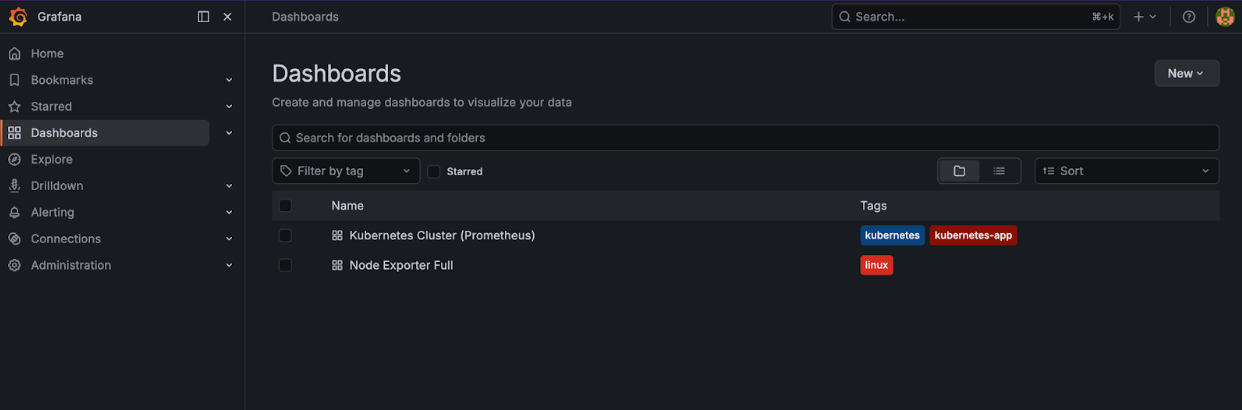
Dashboard Grafana
To check whether Kubernetes is monitored by Prometheus, choose “Node Exporter Full”. Monitor all important node metric is already there, such as CPU, memory, disk, etc. This functionality shows that prometheus have been successfully scraped data from kubernetes node. Continue to check data source, make sure there are 3 datasource configured: Loki, prometheus and Tempo (previously we have configured these three datasource in Grafana manifest).
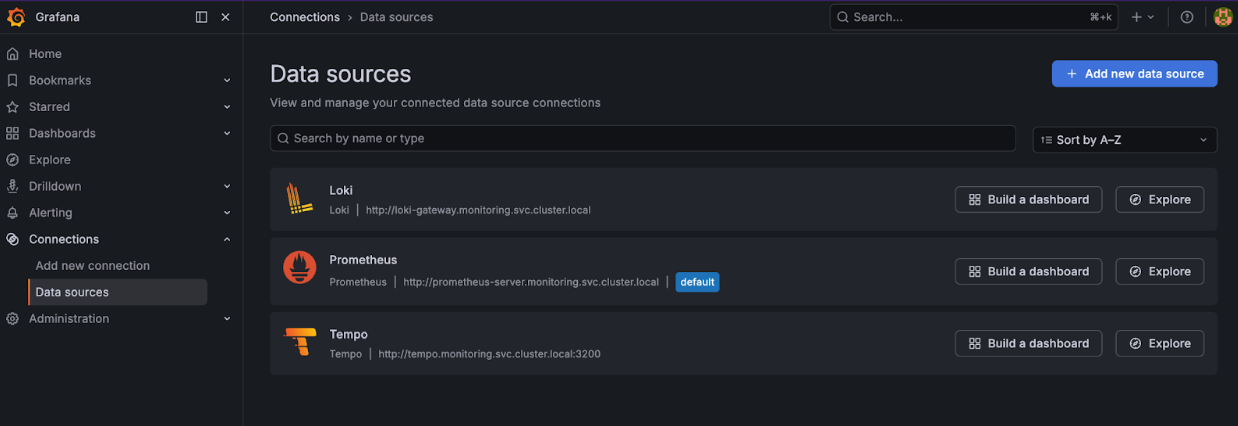
Data Source Grafana
To check container metric utilization we can create custom dashboard, import dashboard from internet or check menu drilldown choose metrics and filter container that you want to monitor.
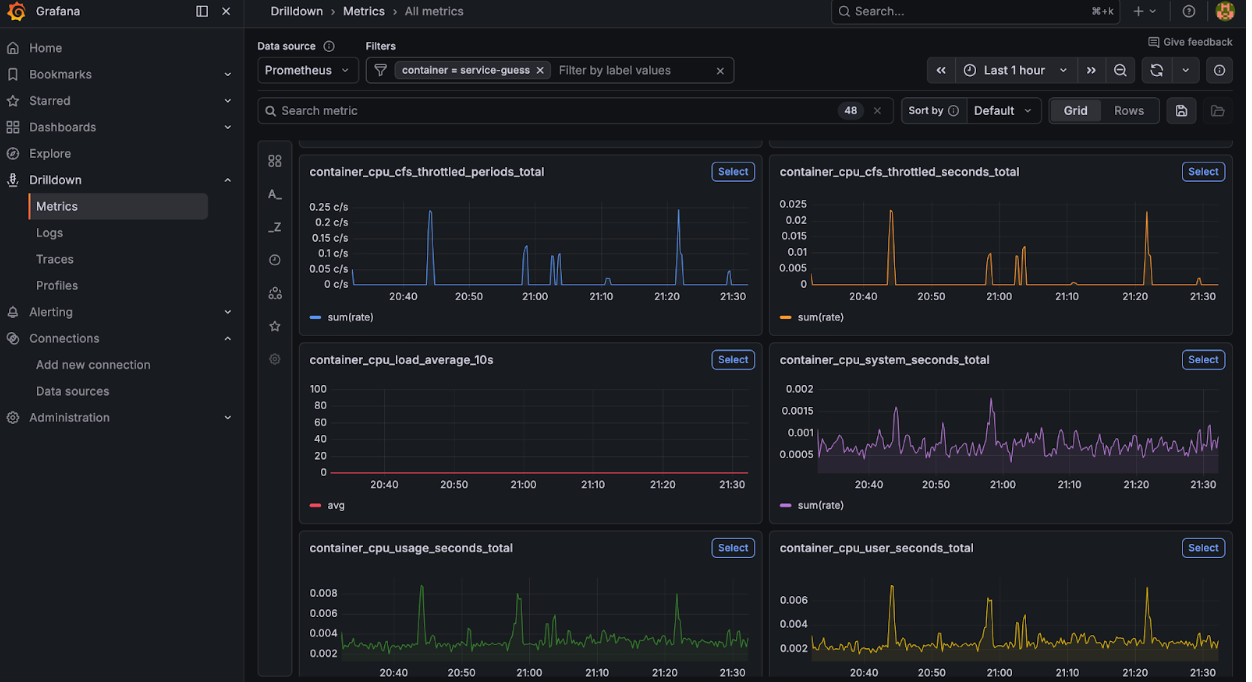
Metrics Grafana
To check loki functionality, we can click explore and choose datasource loki.

Loki Grafana
If you want to check the tempo copy trace_id from loki and go to explore choose tempo as datasource and hit blue refresh button the trace will be shown.
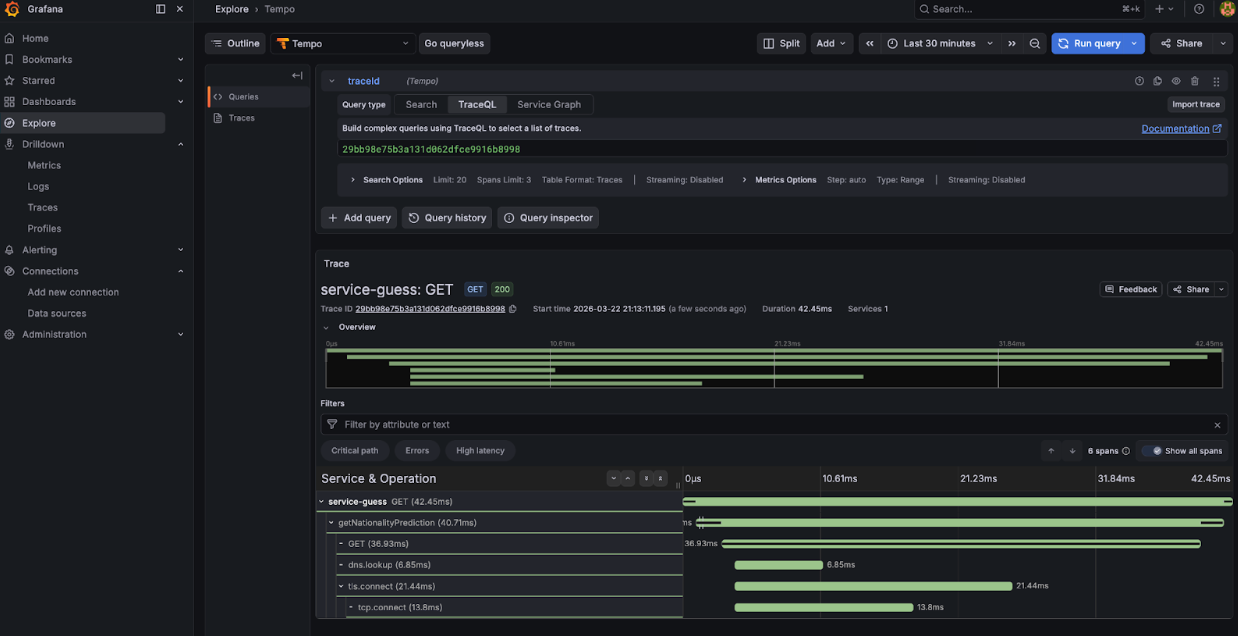
Grafana Tempo
The last to check whether Mimir gets data from Prometheus, you can check from s3 storage. Since we have not configured any tenant id so mimir will use the path “fake/” to store our data. If the path is not empty, then the mimir configuration is correct. Then you can also check the metric in the menu drilldown to make sure data is ingested to Mimir.
메타데이터
- post_id
- 1e1a8317bed0
- slug
- mastering-the-three-pillars-of-observability-in-k8s-metrics-logs-and-traces-with-the-grafana-1e1a8317bed0
- url
- https://medium.com/@PlatformEnthusiast/mastering-the-three-pillars-of-observability-in-k8s-metrics-logs-and-traces-with-the-grafana-1e1a8317bed0
- canonical_url
- https://medium.com/@PlatformEnthusiast/mastering-the-three-pillars-of-observability-in-k8s-metrics-logs-and-traces-with-the-grafana-1e1a8317bed0
- author_url
- https://medium.com/@PlatformEnthusiast
- status
- ok
- fetched_at
- 2026-07-11 15:00:27


