Why Large JSON Payloads Freeze Your UI (and the Fix) — Frontend Master
Your spinner stops, the tab goes white, and for half a second nothing clicks — here’s what JSON.parse is actually doing to your main…
Why Large JSON Payloads Freeze Your UI (and the Fix) — Frontend Master
Your spinner stops, the tab goes white, and for half a second nothing clicks — here’s what JSON.parse is actually doing to your main thread, and how to stop it.
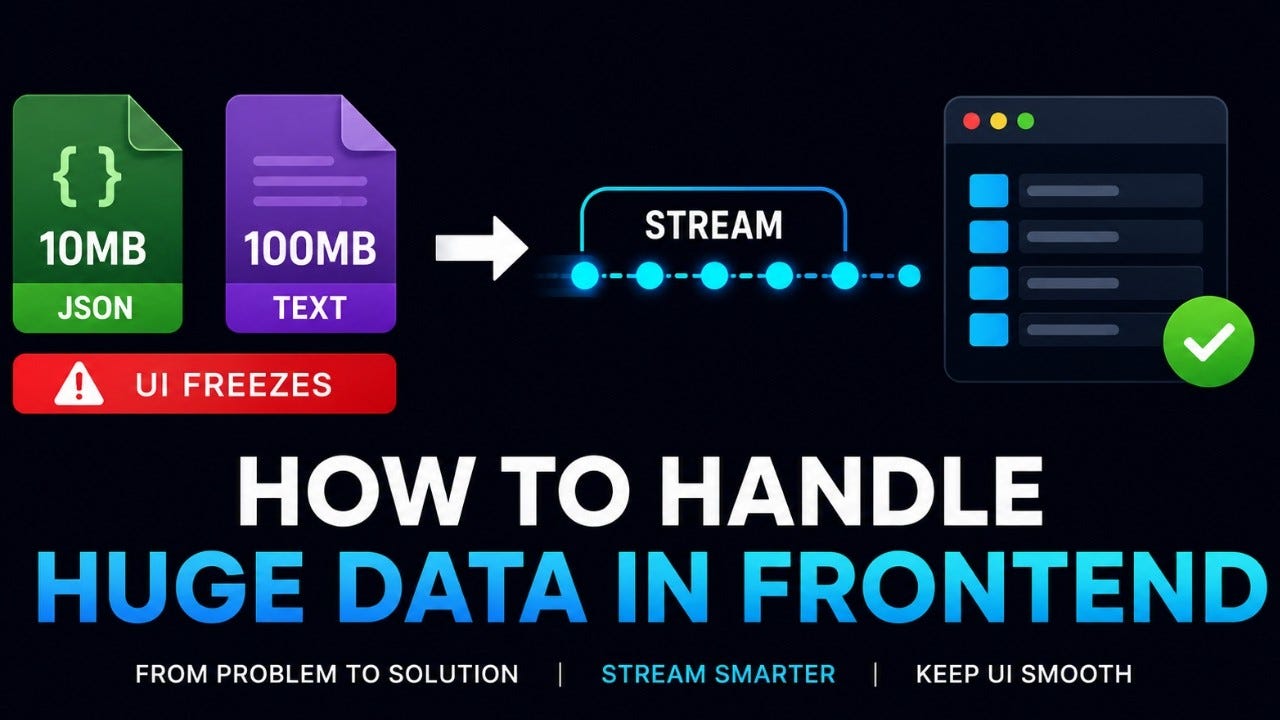
A user told me the app “froze for a second” after every search. No console errors. Network tab looked fine — the request came back in 180ms. So where did the second go?
It went into a single line of code:
const data = JSON.parse(await res.text());That line is synchronous. While it runs, your main thread does nothing else — no scrolling, no clicks, no paint. And the bigger the payload, the longer the freeze. This article is about why that happens and the handful of fixes that actually move the needle.
The part everyone forgets: parsing is CPU work
We tend to think of “loading data” as a network problem. Make the request faster, get the bytes sooner. But once the bytes arrive, the browser still has to turn that text into JavaScript objects, and JSON.parse runs entirely on the main thread.
For a 5MB response with deeply nested arrays, parsing alone can cost 100–400ms on a mid-range phone. That’s not network. That’s your CPU walking character by character through the string, allocating objects, and building a tree in memory.
Here’s the thing that surprises people: the freeze often isn’t JSON.parse at all. It's what you do after.
const data = JSON.parse(text);        // 120ms
const rows = data.results.map(r => ({ // 90ms
  id: r.id,
  name: `${r.first} ${r.last}`,
  tags: r.tags.map(normalizeTag),
}));
setState(rows);                       // triggers a render of 8,000 rows
Three separate main-thread stalls stacked back to back. Parse, transform, render. Each one blocks. Together they’re the “second” the user felt.
How to tell where the time actually goes
Don’t guess. Open DevTools, go to the Performance panel, record while you trigger the load, and look for the long yellow (scripting) block. Click it. You’ll see whether the time is in parse, in your .map, or in React/Vue reconciliation.
A quick-and-dirty alternative when you just want a number:
performance.mark('parse-start');
const data = JSON.parse(text);
performance.mark('parse-end');
performance.measure('json-parse', 'parse-start', 'parse-end');
console.log(performance.getEntriesByName('json-parse')[0].duration);
Measure before you optimize. I’ve watched people spend a day moving parsing to a worker when the real cost was rendering 8,000 DOM nodes.
Fix 1: Don’t fetch what you can’t show
The cheapest payload to parse is the one you never request. If your UI shows 50 rows, your API should return 50 rows. Pagination and cursor-based loading aren’t just network optimizations — they shrink the parse cost linearly.
// Instead of one 5MB blob:
GET /api/results?page=1&limit=50
// Then load more on scroll or click.This single change fixes more “freeze” complaints than any worker ever will, because it attacks the size, not the location, of the work.
Fix 2: Move parsing off the main thread with a Web Worker
When you genuinely need a large payload at once, parse it where it can’t block the UI. A Web Worker runs on its own thread.
// worker.js
self.onmessage = async ({ data: url }) => {
  const res = await fetch(url);
  const text = await res.text();
  const parsed = JSON.parse(text);     // heavy work, off main thread
  self.postMessage(parsed);            // structured clone back
};
// main.js
const worker = new Worker('/worker.js');
worker.postMessage('/api/results');
worker.onmessage = ({ data }) => setState(data);The catch nobody mentions: postMessage copies the result back to the main thread via structured cloning, and for a huge object that copy can itself cost real time. Workers win when the parse + transform is expensive relative to the size of the final result you hand back. If you parse 5MB only to send 5MB straight back, you've moved the parse but added a clone. Profile both paths.
Fix 3: Stream and parse incrementally
You don’t always have to wait for the whole response. The Fetch API gives you a ReadableStream, and if your backend sends newline-delimited JSON (NDJSON), you can parse and render rows as they arrive:
const res = await fetch('/api/results.ndjson');
const reader = res.body.getReader();
const decoder = new TextDecoder();
let buffer = '';
while (true) {
const { value, done } = await reader.read();
if (done) break;
buffer += decoder.decode(value, { stream: true }); let nl;
while ((nl = buffer.indexOf('\n')) >= 0) {
const line = buffer.slice(0, nl);
buffer = buffer.slice(nl + 1);
if (line) appendRow(JSON.parse(line)); // small parse, never blocks long
}
}Each JSON.parse here handles one small line, so no single call blocks for more than a millisecond. The user sees rows fill in instead of staring at a frozen tab. The trade-off is you give up "all data at once," so it suits feeds, logs, and search results better than, say, a config object you need fully before rendering anything.
Fix 4: Stop re-cloning unchanged data (structural sharing)
If your app reparses or deep-clones the same large dataset on every update, that’s self-inflicted. State libraries like Immer and tools like Redux Toolkit use structural sharing: when you update one item, only the changed nodes get new object references — the rest are reused by reference.
// Naive: new array + new object for every row on every edit
const next = state.map(row =>
  row.id === id ? { ...row, name } : { ...row } // don't spread the unchanged ones!
);
// Better: reuse unchanged references
const next = state.map(row =>
row.id === id ? { ...row, name } : row // same reference = cheap, GC-friendly
);That tiny difference means React’s memo/PureComponent can skip thousands of rows whose reference didn't change, and the garbage collector has far less to clean up. Cheap to do, surprisingly impactful at scale.
What happens if you ignore all this
The freeze doesn’t stay a one-second annoyance. On the main thread, a long task also blocks the browser from responding to input — which shows up directly in Interaction to Next Paint (INP), a Core Web Vital. Janky parsing is measurable, and Google measures it. A few stacked 300ms tasks can quietly drag your INP into the “needs improvement” band on real-user data.
The short version
- Profile first — the cost is often transform or render, not
JSON.parse. - Request less (pagination) before you optimize how you process more.
- Use a Worker when parse/transform cost outweighs the clone-back cost.
- Stream NDJSON for feeds and search results.
- Reuse unchanged references so updates stay cheap.
This is one slice of a bigger discipline. If you want the structured tour — critical rendering path, bundle size, Core Web Vitals, and how to measure instead of guess — watch the web performance crash course, which ties all of these together.
Keep going
The full walkthrough, with live profiling in DevTools, is here: **Why Large JSON Payloads Freeze Your UI*. Frontend Master publishes deep-dives like this regularly — worth subscribing on @rahuulmiishra. And if you want someone to look at your* slow component or prep you for performance rounds, Frontend Master runs 1:1 mock interviews — book one at allahabadi.dev/frontend-mock-interview.
메타데이터
- post_id
- 20dd7ac2891c
- slug
- why-large-json-payloads-freeze-your-ui-and-the-fix-frontend-master-20dd7ac2891c
- url
- https://medium.com/@rimjhimtiwari/why-large-json-payloads-freeze-your-ui-and-the-fix-frontend-master-20dd7ac2891c
- canonical_url
- https://medium.com/@rimjhimtiwari/why-large-json-payloads-freeze-your-ui-and-the-fix-frontend-master-20dd7ac2891c
- author_url
- https://medium.com/@rimjhimtiwari
- status
- ok
- fetched_at
- 2026-07-07 13:53:00





