Bollinger Bands Breakout Strategy: Spot Volatility Before the Move
Major market moves often begin when conditions appear quiet. Price enters a narrow range, trading activity declines, and volatility…
Bollinger Bands Breakout Strategy: Spot Volatility Before the Move
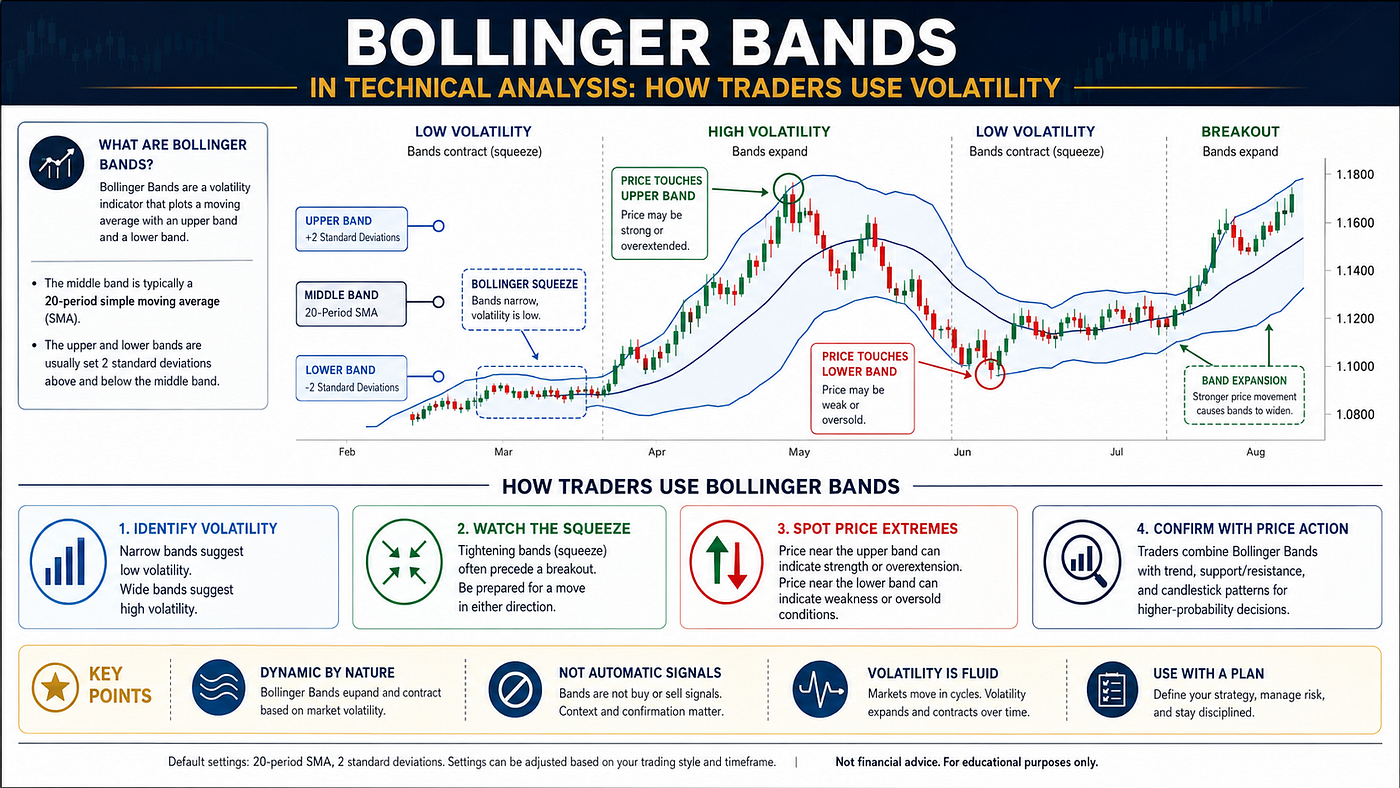
Bollinger Bands
Major market moves often begin when conditions appear quiet. Price enters a narrow range, trading activity declines, and volatility contracts. Many traders lose interest during this phase. However, experienced traders know that extended consolidation can prepare the market for a powerful move.
A Bollinger Bands breakout strategy helps traders identify this transition from low volatility to high volatility. The indicator shows when price movement is becoming compressed and when momentum may be starting to expand.
Yet narrow bands do not predict whether price will rise or fall. Traders must still identify the breakout direction, study support and resistance, confirm volume, and manage risk.
Bollinger Bands also have several uses beyond breakouts. Traders can use them to study trends, pullbacks, possible reversals, and range-bound markets. Their main strength comes from their ability to adjust to current market volatility.
This guide explains how to build a complete Bollinger Bands breakout strategy, filter false signals, define entries and exits, and integrate the indicator with disciplined trading rules.
For a complete introduction to the indicator, read Bollinger Bands in Technical Analysis: How Traders Use Volatility.
What Is a Bollinger Bands Breakout Strategy?
A Bollinger Bands breakout strategy aims to capture a significant price move after volatility contracts.
Bollinger Bands usually include three lines:
- A middle moving average
- An upper volatility band
- A lower volatility band
The standard setting uses a 20-period simple moving average for the middle band. The upper band usually sits two standard deviations above that average. The lower band sits two standard deviations below it.
Standard deviation measures how widely prices vary around their average.
When prices move within a narrow range, standard deviation falls. As a result, the bands move closer together. When prices start moving more sharply, standard deviation rises and the bands expand.
Traders call an unusually narrow band formation a Bollinger Band squeeze. A squeeze signals low volatility, but it does not reveal breakout direction.
The trader must wait for price to break above resistance or below support before considering an entry.
Why Volatility Contraction Matters
Markets often move through repeating phases of contraction and expansion.
During contraction, buyers and sellers reach temporary balance. Neither side has enough strength to create a sustained move. Candles become smaller, trading ranges tighten, and volatility declines.
This condition can continue for several sessions or even several weeks.
Eventually, new information or changing market participation breaks the balance. Buyers may take control and push price above resistance. Alternatively, sellers may overwhelm demand and force price below support.
The resulting volatility expansion can produce a fast directional move.
A Bollinger Bands breakout strategy helps traders recognize the low-volatility phase before expansion begins. This allows them to prepare possible entries, stop-losses, and targets instead of reacting after the move becomes extended.
However, not every squeeze leads to a large breakout. Some consolidations continue longer than expected, while others produce false breaks. Confirmation remains essential.
Understanding the Bollinger Band Squeeze
A Bollinger Band squeeze develops when the upper and lower bands move unusually close together.
Traders may notice several related signs:
- Smaller price candles
- A narrow trading range
- Reduced band width
- A flat or slowly moving middle band
- Declining trading volume
- Repeated tests of support and resistance
- Lower average daily movement
These conditions indicate that volatility has declined.
The squeeze itself is not a buy or sell signal. It only tells traders that price has entered a compressed state.
The next task involves defining the boundaries of the consolidation. Traders should mark the nearest horizontal resistance and support levels. These price levels usually provide more reliable breakout triggers than the bands alone.
A close above range resistance may create a bullish opportunity. A close below range support may produce a bearish setup.
How to Identify a High-Quality Squeeze
Not every period of narrowing bands deserves a trade.
A higher-quality squeeze usually includes a clear consolidation range. Price should respect visible support and resistance rather than move unpredictably through a wide area.
The squeeze becomes more useful when:
- The bands are narrower than their recent average
- Price has remained inside a defined range
- The range follows a meaningful trend or price move
- Trading volume has contracted
- The higher timeframe provides a clear market context
- There is enough space between the breakout point and the next major price barrier
The duration of the squeeze also matters. A longer consolidation may create a more important breakout level because more traders have placed orders around the range.
However, duration alone does not guarantee a strong move. Traders still need a confirmed close and follow-through.
Bullish Bollinger Bands Breakout Setup
A bullish Bollinger Bands breakout strategy looks for price to escape above a consolidation range.
Conditions for a Bullish Setup
A stronger bullish setup may include:
- Narrow Bollinger Bands
- Clearly defined horizontal resistance
- Price holding above or near the middle band
- A rising or stable higher-timeframe trend
- A close above both resistance and the upper band
- Higher trading volume
- Expanding band width after the breakout
The closing price matters more than a brief intraday move.
Price may trade above resistance during the session but close back inside the range. This action creates a warning that buyers could not maintain control.
A strong close above resistance shows greater commitment.
Bullish Entry Methods
Traders can use two main entry approaches.
The aggressive method enters after the confirmed breakout candle closes. This approach may capture the move early, but it can involve a wide stop if the breakout candle is large.
The conservative method waits for price to retest the former resistance level. If resistance becomes support and price forms a bullish reaction, the trader may enter after confirmation.
A retest can improve the risk-to-reward ratio. However, some breakouts continue without returning to the entry zone.
Neither method is automatically better. The choice depends on market volatility, trading style, and risk tolerance.
Bearish Bollinger Bands Breakout Setup
A bearish breakout occurs when sellers force price below a well-defined support level.
Conditions for a Bearish Setup
A stronger bearish setup may include:
- Narrow Bollinger Bands
- Clearly defined range support
- Price trading below or near the middle band
- A weak or negative higher-timeframe trend
- A close below support and the lower band
- Increasing selling volume
- Expanding band width after the breakdown
A breakdown directly into major higher-timeframe support may offer limited downside potential. Traders should check the next price barrier before entering.
Bearish Entry Methods
An aggressive trader may enter after price closes below support.
A more conservative trader may wait for price to return toward the broken support level. If that level becomes resistance and price produces bearish confirmation, the setup may offer a clearer invalidation point.
Possible confirmation signals include:
- A bearish engulfing candle
- A long upper rejection wick
- A lower high
- A close back below the middle band
- Rising selling volume
- Weak momentum during the retest
The stop-loss should sit above the level that invalidates the bearish idea.
Why Price Closing Outside the Bands Is Not Enough
A common mistake involves treating every close outside the Bollinger Bands as a breakout signal.
Price can close outside a band during normal trend movement. It may also become temporarily extended and reverse during the next session.
A valid breakout requires more context.
Traders should ask:
- Did price break horizontal support or resistance?
- Did volume increase?
- Are the bands beginning to expand?
- Does the higher-timeframe trend support the direction?
- Is the breakout candle reasonably sized?
- Is there room before the next major price level?
- Did price hold beyond the breakout zone?
A band break without structural confirmation may produce a weak trade.
The bands measure volatility. Price structure identifies the actual trading level.
How Volume Confirms a Bollinger Bands Breakout
Volume helps traders evaluate market participation.
During a squeeze, volume often declines because fewer traders are actively buying or selling. When price breaks the range, rising volume can signal that participation has returned.
A bullish breakout with strong volume suggests that buyers support the move. A bearish breakdown with expanding volume indicates more aggressive selling.
Weak volume can increase the risk of a false breakout.
However, volume should not be viewed in isolation. Some markets, such as decentralized currency markets, do not provide centralized volume data. Traders may need to use tick volume, futures volume, or related market activity.
Volume can also increase because of earnings, economic reports, index rebalancing, or options expiration. Traders should understand why participation has changed.
Financial astrology prepares, technical analysis confirms, volume validates, and risk management protects.
How to Avoid False Bollinger Band Breakouts
False breakouts occur when price briefly moves beyond a range and then returns inside it.
They can trigger entries before reversing sharply.
Warning Signs of a False Breakout
Potential warning signs include:
- A long rejection wick
- A weak closing price
- Low or average trading volume
- Immediate movement back inside the bands
- A breakout against a strong higher-timeframe trend
- Major support or resistance directly beyond the range
- No expansion in band width
- Weak participation from related stocks or indices
For example, a technology stock may break higher while the broader technology index remains weak. This lack of sector confirmation may reduce the quality of the setup.
Confirmation Techniques
Traders can reduce false signals by waiting for:
- A full candle close beyond the range
- Follow-through during the next candle
- Rising volume
- Expansion in band width
- A successful retest
- Confirmation from momentum indicators
- Alignment with the broader market
Waiting for confirmation means entering at a less favorable price. However, it can prevent some low-quality trades.
Using the Middle Band After a Breakout
The middle Bollinger Band can help traders manage an open position.
During a healthy bullish trend, price may remain above a rising middle band. Pullbacks toward the middle band may attract buyers.
A trader can use a close below the middle band as a warning that momentum is weakening. However, this should not automatically trigger an exit. Market structure and the trading timeframe still matter.
During a bearish trend, price may remain below a falling middle band. Rallies toward the average can fail and restart the decline.
The middle band may therefore serve as:
- Dynamic support in an uptrend
- Dynamic resistance in a downtrend
- A trailing exit reference
- A momentum filter
- A pullback entry zone
Traders should avoid relying on the middle band alone. A recent swing low or swing high may provide a more logical invalidation point.
Bollinger Band Walking During Strong Trends
After a successful breakout, price may repeatedly touch or move along one outer band.
This behavior is often called walking the band.
In a strong uptrend, price may follow the upper band for several sessions. The middle band rises, and pullbacks remain limited.
In a strong downtrend, price may repeatedly touch the lower band while the middle band slopes downward.
Walking the band indicates momentum. It does not automatically mean that price must reverse.
Traders who sell every upper-band touch during a strong rally may exit too early. Traders who buy every lower-band touch during a decline may continue entering against the trend.
Always examine trend structure before treating an outer-band touch as an extreme.
Combining Bollinger Bands With RSI
The Relative Strength Index measures the speed and magnitude of recent price changes.
RSI can help assess momentum during a Bollinger Bands breakout strategy.
A bullish breakout may gain support when:
- Price closes above resistance
- The bands begin expanding
- RSI rises above its neutral area
- RSI has not formed a strong bearish divergence
- Volume confirms buying pressure
A bearish breakdown may gain support when:
- Price closes below support
- The bands expand
- RSI moves lower
- Momentum remains weak
- Selling volume increases
Traders should not reject every bullish breakout because RSI appears overbought. Strong trends can keep RSI elevated for an extended period.
Likewise, an oversold RSI does not guarantee that a bearish trend will reverse.
Use RSI as a momentum filter rather than an independent signal.
Combining Bollinger Bands With Support and Resistance
Support and resistance remain essential because Bollinger Bands move with volatility.
A band does not necessarily represent a price level that traders will defend. Horizontal support and resistance reflect actual areas where price has reacted before.
Traders can identify these levels through:
- Previous swing highs
- Previous swing lows
- Consolidation boundaries
- Gap areas
- Breakout and breakdown levels
- Psychological round numbers
- High-volume price zones
- Weekly and monthly pivots
The Support and Resistance Calculator can help traders generate objective pivot-based levels from a previous period’s high, low, and close.
A squeeze breakout that clears both the upper band and established resistance usually offers more structure than a simple upper-band cross.
Combining Bollinger Bands With Moving Averages
The Bollinger Bands middle line already uses a moving average. Still, traders may add a longer moving average to identify the broader trend.
For example, a trader may use:
- The 20-period Bollinger middle band for short-term direction
- The 50-period moving average for intermediate trend
- The 200-period moving average for long-term context
A bullish breakout above the upper band may carry more weight when price also trades above rising 50-period and 200-period averages.
A bearish breakdown may gain strength when price remains below declining longer-term averages.
Avoid adding too many moving averages. The chart should clarify the decision, not create unnecessary complexity.
A Practical Bollinger Bands Breakout Example
Assume a stock rallies from $70 to $90 and then trades between $87 and $92 for three weeks.
During the consolidation:
- The Bollinger Bands narrow
- The middle band becomes flat
- Daily trading volume declines
- Price repeatedly fails near $92
- Buyers continue defending $87
The trader marks $92 as resistance and $87 as support.
The stock eventually closes at $93.50. The close sits above resistance and the upper Bollinger Band. Volume reaches twice its recent average, while the bands begin expanding.
The trader does not chase the first move.
During the next session, price returns to $92.30 and holds above former resistance. A bullish candle forms and closes at $94.
The trader enters above the confirmation candle. The stop-loss sits below the retest low. The next major resistance near $102 provides the initial target.
Before placing the trade, the trader checks the possible reward against the planned loss through the Risk-to-Reward Calculator.
This setup combines:
- Volatility contraction
- A defined consolidation range
- A closing breakout
- Higher volume
- Expanding bands
- A successful retest
- A logical stop-loss
- A clear target
The Bollinger Band squeeze alerts the trader to changing volatility. Price structure and volume confirm the opportunity.
How to Place a Stop-Loss
A stop-loss should reflect the point at which the breakout setup fails.
For a bullish trade, possible stop locations include:
- Below the breakout level
- Below the retest low
- Below the middle Bollinger Band
- Below a recent structural swing low
For a bearish trade, possible locations include:
- Above broken support
- Above the retest high
- Above the middle band
- Above a recent lower high
The breakout level often provides a useful reference, but normal volatility may cause price to move briefly through it.
A trader can place the stop beyond the invalidation zone and reduce position size to maintain a consistent level of account risk.
Do not make the stop tighter simply to increase the position size.
How to Set Profit Targets
Profit targets should reflect nearby market structure.
Possible target methods include:
- The next support or resistance level
- The height of the consolidation range
- A previous swing high or swing low
- A fixed reward-to-risk multiple
- A trailing stop based on the middle band
- A volatility-based trailing exit
Suppose a consolidation extends from $50 to $55. Its height equals $5. After an upside breakout at $55, a measured objective may sit near $60.
This projection offers a planning reference, not a guaranteed destination.
Some traders close part of the position at the first target and trail the rest. This approach protects part of the gain while maintaining exposure to a larger trend.
Position Sizing for Volatility Breakouts
A breakout can move quickly in either direction. Position sizing helps limit the damage when the setup fails.
Assume a trader has a $30,000 account and risks 1% on each trade. The maximum planned loss equals $300.
If the entry is $62 and the stop is $59, the risk equals $3 per share. The trader can purchase 100 shares before allowing for fees and slippage.
If wider volatility requires a $6 stop, the position should fall to 50 shares.
The Financial Calculator Hub provides tools for position sizing, risk-to-reward analysis, stop-loss planning, profit and loss, support and resistance, and capital recovery.
Consistent account risk matters more than using the same number of shares in every trade.
Common Bollinger Bands Trading Mistakes
Trading the Squeeze Before the Breakout
Narrow bands can remain narrow for a long time.
Wait for price to break a defined level instead of guessing the direction.
Entering on an Intraday Spike
Price may move beyond resistance or support and then reverse before the close.
A confirmed closing breakout usually provides stronger evidence.
Ignoring Volume
A breakout without increased participation may fail quickly.
Compare current volume with the recent average.
Buying an Overextended Breakout
A very large breakout candle may create a poor risk-to-reward ratio.
Waiting for a pause or retest may produce a better setup.
Ignoring the Higher-Timeframe Trend
A breakout against the larger trend may face strong opposition.
Review the daily or weekly chart before entering from a shorter timeframe.
Treating Band Touches as Automatic Reversals
Price can remain near an outer band during a strong trend.
Use trend structure and confirmation before taking a countertrend trade.
Risking Too Much
No breakout setup has a guaranteed result.
Determine the maximum acceptable loss before entering.
Financial Astrology as an Additional Timing Layer
Technical analysis helps traders identify the price structure of a squeeze and breakout. Financial astrology studies cycles that may coincide with changes in sentiment, momentum, and volatility.
The Financial Astrology Terminal combines market charts, watchlists, technical indicators, global stocks, indices, commodities, and financial astrology timing insights in one research environment.
A trader may use Bollinger Bands to identify a low-volatility squeeze. Astrological timing analysis may then highlight periods that deserve closer attention for possible volatility expansion.
However, timing indicators should never replace market confirmation.
A disciplined framework may include:
- Identify the broader trend.
- Find a Bollinger Band squeeze.
- Mark range support and resistance.
- Review potential timing windows.
- Wait for a closing breakout.
- Confirm the move with volume.
- Calculate the stop-loss and target.
- Set the position size.
Financial astrology should remain a probability-based timing layer. Price, volume, and risk management must determine whether the trade is valid.
Bollinger Bands Breakout Strategy Checklist
Before entering a trade, ask:
- Have the Bollinger Bands clearly contracted?
- Does price have defined support and resistance?
- Has price closed outside the consolidation range?
- Has band width started expanding?
- Does volume confirm the breakout?
- Does the higher timeframe support the direction?
- Is there enough room before the next price barrier?
- Where does the trade become invalid?
- Does the potential reward justify the risk?
- Is the position size within the account-risk limit?
A trade does not need to satisfy every possible condition. However, unclear answers often indicate a weak setup.
Conclusion: Trade the Expansion, Not the Excitement
A Bollinger Bands breakout strategy helps traders identify periods when quiet markets may be preparing for larger moves.
Narrow bands reveal volatility contraction. A confirmed break of support or resistance can signal that expansion has begun. However, the bands cannot predict direction or guarantee follow-through.
The strongest setups combine a clear squeeze with horizontal price structure, a decisive closing breakout, rising volume, expanding bands, and alignment with the broader trend.
Traders must also define the stop-loss, target, position size, and maximum acceptable loss before entering. Without risk management, even a technically correct breakout strategy can damage a trading account.
메타데이터
- post_id
- 226aef3dbd21
- slug
- bollinger-bands-breakout-strategy-spot-volatility-before-the-move-226aef3dbd21
- url
- https://medium.com/@astro5dunia/bollinger-bands-breakout-strategy-spot-volatility-before-the-move-226aef3dbd21
- canonical_url
- https://medium.com/@astro5dunia/bollinger-bands-breakout-strategy-spot-volatility-before-the-move-226aef3dbd21
- author_url
- https://medium.com/@astro5dunia
- status
- ok
- fetched_at
- 2026-07-08 23:38:59