I Let 31 Algorithms Trade My Roth IRA for Two Years. Here’s the Scoreboard.
It was the summer of 2024 when I moved the first of my retirement money into Composer, a brokerage where you don’t really pick stocks, you…
I Let 31 Algorithms Trade My Roth IRA for Two Years. Here’s the Scoreboard.
It was the summer of 2024 when I moved the first of my retirement money into Composer, a brokerage where you don’t really pick stocks, you pick strategies that trade for you. At the time I thought of it as a small experiment. Two years later the experiment has grown into 39 different algorithms across two accounts, 31 of them in the Roth IRA this post is about, and enough results, good and bad, that it felt like time to write them down.
My best algorithm is up 150% since January. My worst lost more than half its money over roughly the same stretch. I didn’t write either of them, which is sort of the point of this series.
This post is the scoreboard. Every strategy I run and every result, including the embarrassing ones. Everything here is live performance pulled from Composer’s API, not backtests dressed up as results.
The headline result
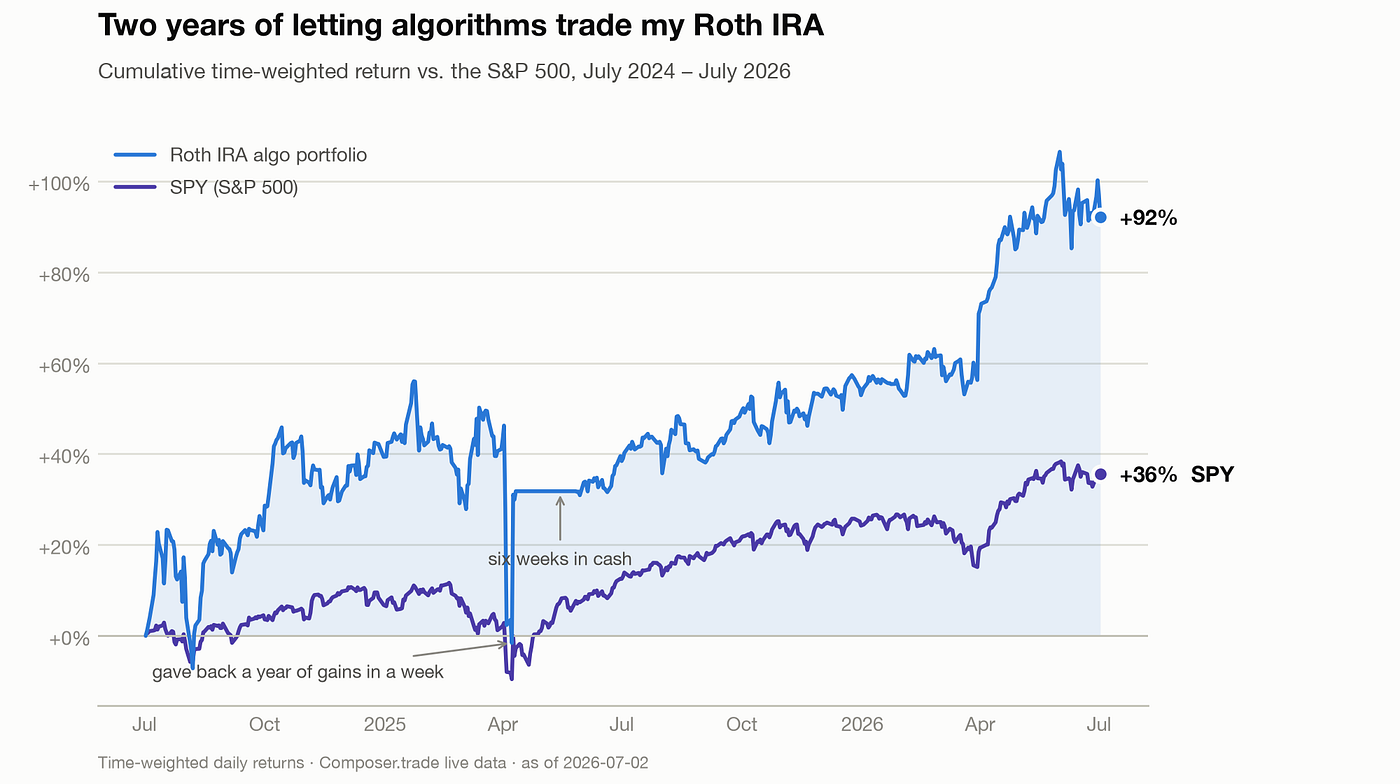
From July 2024 through July 2026, the algorithm portfolio in my Roth IRA returned +92% time-weighted, against +35% for the S&P 500. In dollar terms, every $1,000 the algorithms managed grew to about $1,920, while the same $1,000 in an index fund grew to about $1,350. (Time-weighted means my deposits along the way don’t inflate the number. It measures the strategies, not my paycheck.)
The two notes written on that chart are the honest part of it.
In April 2025 the portfolio gave back close to a year of gains in about a week. At the time I was only running a handful of strategies, all high volatility, chosen partly because they weren’t supposed to move together. In that crash they moved together anyway. Looking back, the drawdown did more damage to me than to the account. I pulled everything to cash and sat out for about six weeks while the market recovered without me. That flat line is what panic looks like on a chart.
The steadier climb afterward is the rebuilt version, with far more strategies, each one weighted by its volatility and drawdown numbers instead of by how exciting its equity curve looked. Most of what follows is really about that rebuild.
What Composer actually is
Composer is a real brokerage (SIPC-insured and all that), but the unit of investing is a strategy they call a symphony, a decision tree that runs automatically. One real slice from a strategy I own: if the 3x gold-miner ETF’s 10-day RSI is above 79, short gold miners. If not, and the Nasdaq is trending up, hold whichever leveraged tech stock screens best that day. If everything looks overheated at once, buy volatility and wait. The whole tree re-evaluates itself every trading day without me touching anything.
Two things drew me in. You can inspect and backtest any strategy before funding it, since the logic is right there on the page instead of inside a black box run by a stranger on Discord. And you can copy anyone’s public symphony in a couple of clicks, which is how I ended up running 39 of them.
The catch is that community strategies are mostly advertised by their backtests. Some carry the backtest number right in the name, like “684% Annual Return.” A backtest is a promise. Live money is the receipt. Most of what I’ve learned in two years sits in the gap between those two.
Every algorithm, ranked
Here’s all 39, 31 in the Roth and 8 in a taxable account, ranked by time-weighted return since the day I funded each one:

22 made money and 17 lost. The portfolio still beat the index by a wide margin, and the reason turned out to be boring: position sizing.
Every strategy in my account gets weighted using two numbers Composer shows before you invest a cent, standard deviation and max drawdown. My biggest position runs about 36% annualized volatility with a 21% worst drawdown. The +150% rocket at the top of the chart runs 137% volatility with a 41% drawdown, so it got a fraction of the money. The disaster at the bottom, down 55%, had a 169% standard deviation and an 88% max drawdown. The only reason it’s a bruise instead of a crater is that those two numbers set its size, not its backtest.
A few other things stand out to me when I look at that chart.
I funded “Pals Minor Spell of Summon Money” in January and again in February. The January copy is up 150%, the February copy 94%. Identical algorithm, same market. The only difference is when the money went in. Timing risk doesn’t go away just because a robot is doing the trading.
The names and the advertised numbers turned out to be useless for sizing. That “684%” in a title is a backtested annual return, meaning how the strategy would have done in one particular version of the past. It says nothing about what happens to your money next. Whatever a title promises, the weight should come from standard deviation and max drawdown.
And the bottom of the table is mostly leveraged ETFs, SOXL and friends. The -55% one down there gets a full autopsy in post #3.
Every strategy on that leaderboard is public on Composer, by the way. Anyone can open one and read the entire decision tree without an account, which is what I would recommend doing before believing a word anyone says about them, including me. (If you ever want to go past browsing, the referral link at the bottom of this post takes 25% off.)
What I wish I had known at the start
This isn’t a quit-your-index-funds pitch. Most of my retirement is still boring, and this is the experimental slice of it. But after two years, this is what I would tell the 2024 version of me:
- Judge strategies by live track record, not backtests. Composer shows both, and the gap between them is the most useful number on the platform.
- Expect drawdowns that would make you sell anything you were managing by hand. The algorithm doesn’t panic, but you might. I did, and my April 2025 flat line cost me six weeks of a recovery.
- Spread the money across many strategies, and size each one by its standard deviation and max drawdown. Not by conviction, and not by how clever the logic looks. No single row of my scoreboard could have sunk the whole thing, and that is the only reason the scoreboard looks good.
- A Roth IRA is a good sandbox for this. Strategies that trade daily would be a tax headache in a regular account. 8 of my 39 live in taxable anyway, and that comparison is coming in a future post.
This is part 1 of Real Money, Real Algorithms. Part 2 is a teardown of the strategy at the top of the scoreboard, what “Pals Minor Spell of Summon Money” actually does under the hood, and the hedged version I built for money I can’t afford to be brave with. Follow me here to catch it.
I’m also curious which row of that leaderboard you’d want explained next. Tell me in the responses.
A note on the numbers: everything above is a time-weighted return pulled from Composer’s API on July 2, 2026, and every chart is generated directly from that data. Nothing here is a backtest unless labeled as one.
Try it yourself: everything in this series runs on Composer. If you sign up with my referral code jYGwZm4-TRADE, you get 25% off a subscription. Disclosure: that’s a referral link — I receive credit toward my own Composer subscription when people join through it.
I’m not a financial adviser, and nothing here is financial advice. These are my real results in my real accounts — several of these algorithms lost money, my results are not typical, and past performance doesn’t predict future returns. Many strategies discussed use leveraged ETFs, which can lose value rapidly. Do your own research, and consider talking to a licensed financial adviser before acting on anything you read here.
Be the Signal on DataDrivenInvestor — Movement for the One-Person Era
https://datadriveninvestor.com/write-for-ddi
Visit us at https://DataDrivenInvestor.com
Join our Writer-Entrepreneur-Investor Ecosystem Here:
메타데이터
- post_id
- 22bcce2bf1c0
- slug
- i-let-31-algorithms-trade-my-roth-ira-for-two-years-heres-the-scoreboard-22bcce2bf1c0
- url
- https://medium.datadriveninvestor.com/i-let-31-algorithms-trade-my-roth-ira-for-two-years-heres-the-scoreboard-22bcce2bf1c0
- canonical_url
- https://medium.datadriveninvestor.com/i-let-31-algorithms-trade-my-roth-ira-for-two-years-heres-the-scoreboard-22bcce2bf1c0
- author_url
- https://medium.com/@ryan-lavelle
- status
- ok
- fetched_at
- 2026-07-09 05:26:43