A Quick Dive into WNBA Road Trips
(Note: the analyses were done in April, prior to the WNBA season starting but I was unable to finish writing this until 7/28/25, about…
A Quick Dive into WNBA Road Trips
(Note: the analyses were done in April, prior to the WNBA season starting but I was unable to finish writing this until 7/28/25, about two-thirds of the way through the season).
With the start of the WNBA’s 2025 season set to kick off on May 16, I thought I’d take a look at the road trips of WNBA teams. I was interested to see how the road trips were constructed (east/west coast swings, short/long, number of games) to see if there were any travel advantages/disadvantages.
Data
The data for this quick dive was obtained as follows:
- Distance data between arenas — To get the distance between the arenas I used Claude 3.7. I prompted Claude to find the locations for each teams home arena and to calculate the distances between the arenas, along with R code to create a data frame with the information. It gave me the code for a data frame with the arena name, city and coordinates for each team, functions to calculate distances, and the code to create a matrix with the distances between arenas.
- 2025 Schedules — I scraped espn.com for each teams schedule.
- Team colors — I found team colors at truecolor.net. The first color listed for each team was used for the team color.
- Team logos — The logos for each team were downloaded from wnba.com in svg format and converted to png format.
Distance
Here is a map of the arena locations for each WNBA team:
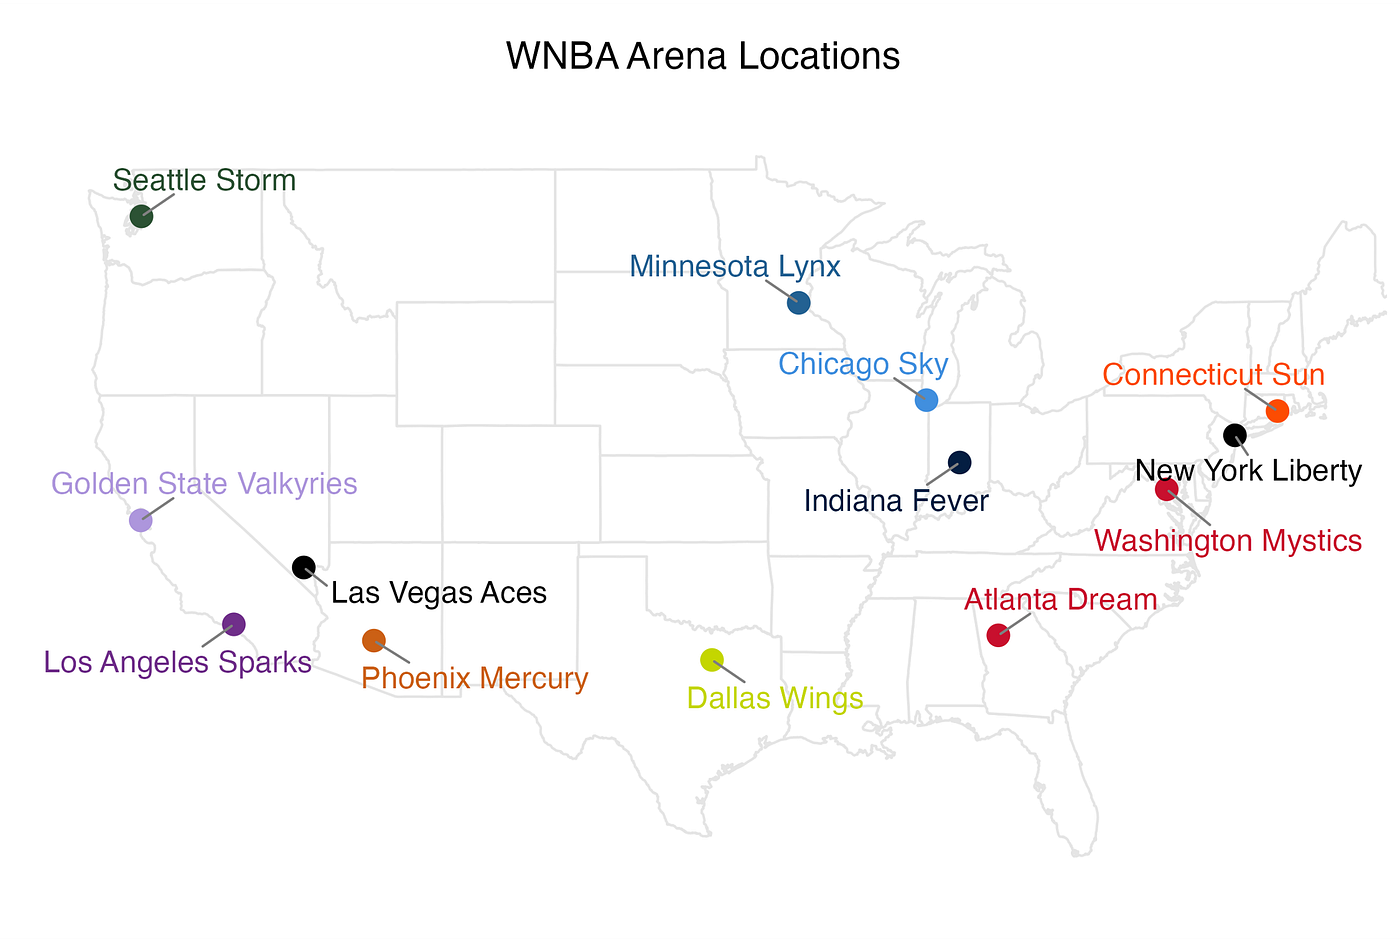
Looking at the map it looks like Atlanta, Seattle and Dallas would travel more miles since they are don’t have regional opponents (and maybe Golden State). The heatmap below shows the miles between the arenas (note — some arena names have changed):

Examining the heatmap, it can be seen that Seattle and Dallas don’t have any relatively close opponents (> 682 miles to nearest arena). This can also be seen in the following showing the distribution of the distances by team (arranged by median distance):

Unsurprisingly, teams in the east (NY, CONN, WSH) and out west (GS, LA, LV, PHX, SEA) have the widest distributions of distances. Dallas and Minnesota, two teams in the ‘middle’ in the country, have the narrowest distributions. Interestingly, Indiana and Chicago have the lowest median distances while Golden State has the longest (just edging out Seattle).
Road Trips
The mileage for a road trip was calculated a ‘round trip’ mileage — starting at a team’s home arena and included the miles from the last arena on the trip back to a team’s home arena. Road trips were considered to end at the all-star break if the break occurred between road games for a team. Seattle and Atlanta play a neutral site game in Vancouver two days after playing in Seattle — I counted this as part of the Atlanta road trip and also considered it a road trip for Seattle.
The distribution of road trips by the number of games for each team:

It does not appear there are any patterns to the number of road trips. Teams have different number of single-game road trips, from Minnesota with 2 to Indiana with 8, while Dallas and Seattle only have 3. The majority of road trips for teams are one or two games, and very few road trips longer than 3 games. Below are maps of some teams road trips.

Atlanta is the only team with a 6 game road trip, which takes place over 12 days, starting in Chicago and then visiting teams in the west. Seattle is listed twice on that road trip because the first game is in Seattle but the second game is in Vancouver. After the long road trip they have two road trips, both round trips to play Connecticut.

Indiana has the most single game road trips with 8, but also has the most road trips with 13 (along with Los Angeles).
Below are the descriptive statistics for teams’ road trips:

Seattle has the shortest trip, 240 miles to and from Vancouver for a neutral site game against Atlanta. If that is excluded their shortest trip is a one game trip to Phoenix. Each team’s shortest road trip is a single game trip (not necessarily to their closest opponent).
For 2025, Indiana travels the least amount of miles (they also have the shortest median distance to opponents’ arenas) and Golden State will travel the most miles (they have the highest median distance to opponents’ arenas, just above Seattle).
Final Thoughts
After looking at the numbers, it does seem that Indiana may have an advantage since they will travel the fewest miles, but they also have the most one game road trips which may have an effect. Atlanta and Chicago may also benefit from less miles traveling, while teams such as Golden State and Los Angeles may not benefit from the miles they will travel throughout the season. Other factors that may be examined are when the longer trips occur (early, middle or late season) and days between road trips. Once the regular season is complete, it can be examined is there is an association between road trips and performance.
메타데이터
- post_id
- 22e39b0cffc2
- slug
- a-quick-dive-into-wnba-road-trips-22e39b0cffc2
- url
- https://medium.com/@j3follis/a-quick-dive-into-wnba-road-trips-22e39b0cffc2
- canonical_url
- https://medium.com/@j3follis/a-quick-dive-into-wnba-road-trips-22e39b0cffc2
- author_url
- https://medium.com/@j3follis
- status
- ok
- fetched_at
- 2026-07-18 16:14:08